Complete Solutions to Exercise 4.4 of chapter KINEMATICS-1 of Class 11 book with complete answers and questions
| Class 11 | PHYSICS |
| Chapter | KINEMATICS-1 |
| CENGAGE PHYSICS | Exercise 4.4 |
| Number Of Questions | 16 |
| Academic Year | 2023-24 |
a. What can you say about velocity in each of the following position-time graphs?
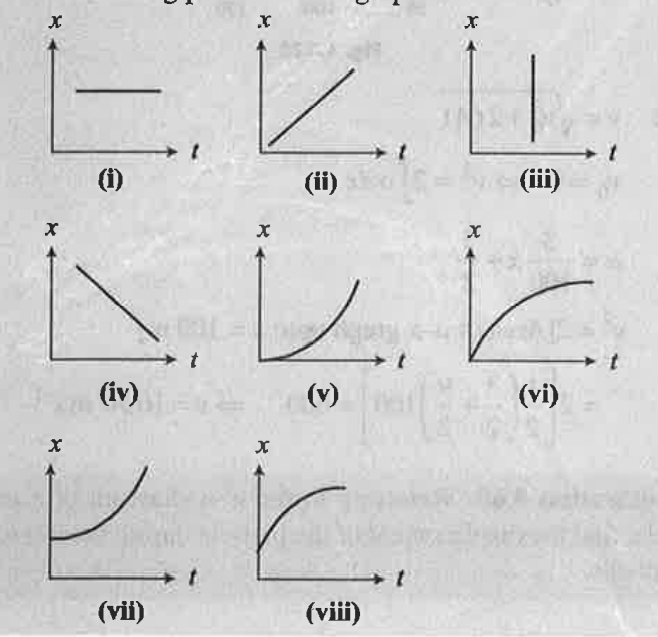 .
.
b. The slope of the velocity-time graph is equal to acceleration. (True//False)
c. What does the area under acceleration-time graph represents?
d. Can velocity-time graph be parallel to the velocity axis? (Yes//No)
e. What is the slope of the `v-t` fraph in uniform motion? .
View Solutiona. A ball is thrown vertically upwards. Aftre some time it trturns to the throuer. Draw the velocity-time graph and speed-time graph.
b. A ball is dropped from some height. After rebounding from the floor, it ascends to the same height. Draw the velocity-time graph and speed-time graph.
View SolutionA body starts at `t=0` with velcoity `u` and travels along a straight linge. The body has a constant acceleration(a). Draw the acceleration-time graph from `t=0` to `t=10 s` for the following cases:
a. `u=8 ms^(-1)`, a=2s^(-2)`
b. `u=8 ms^(-1)`, a=-2 ms^(-2)`
c. `u=- 8ms^(-1)` ,a=2 ms^(-2)`
d. `u=-8ms^(-1)` ,a=-2 ms^(-2)`.
View SolutionFind the average acceleration in first `20 s`. (Hint: Area under `a-t` fraph is equal to the change in velocity).
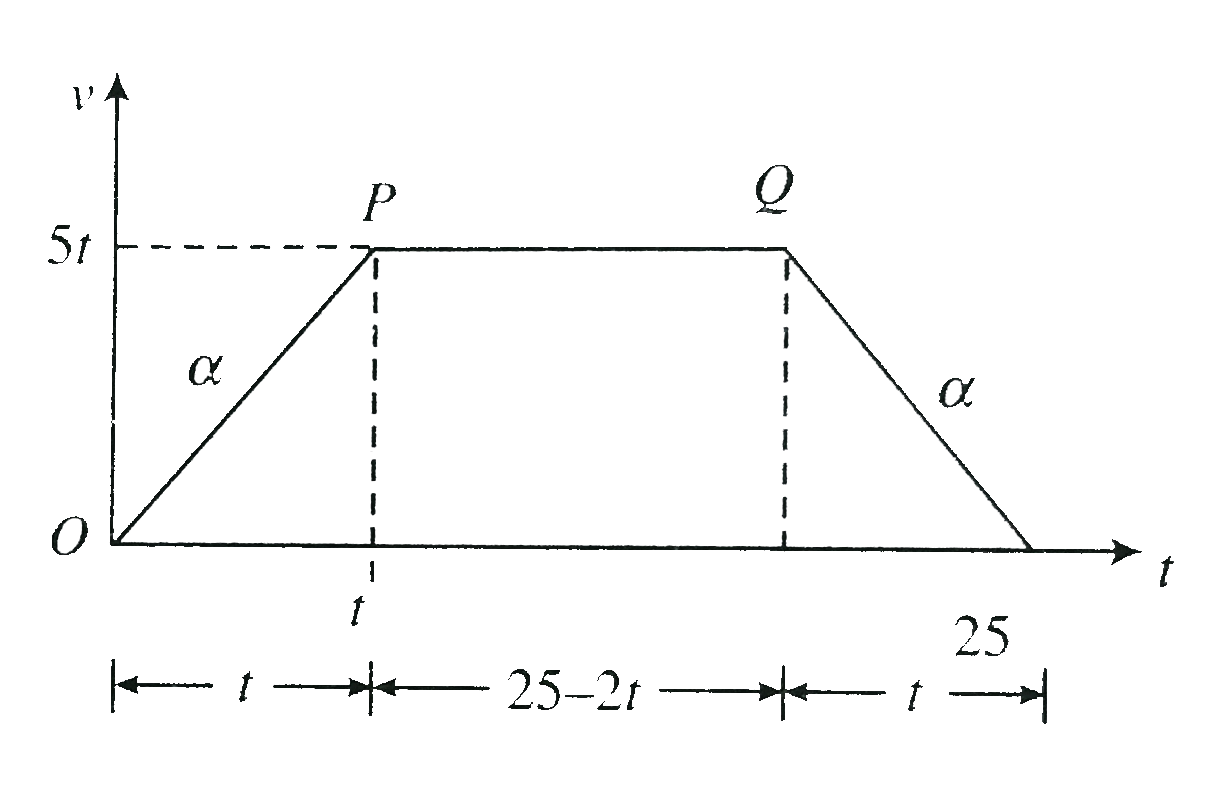 .
.
View SolutionAt `t=0`, a particle starts from reat and moves along a straight line, whose acceleration-time graph is shown in .
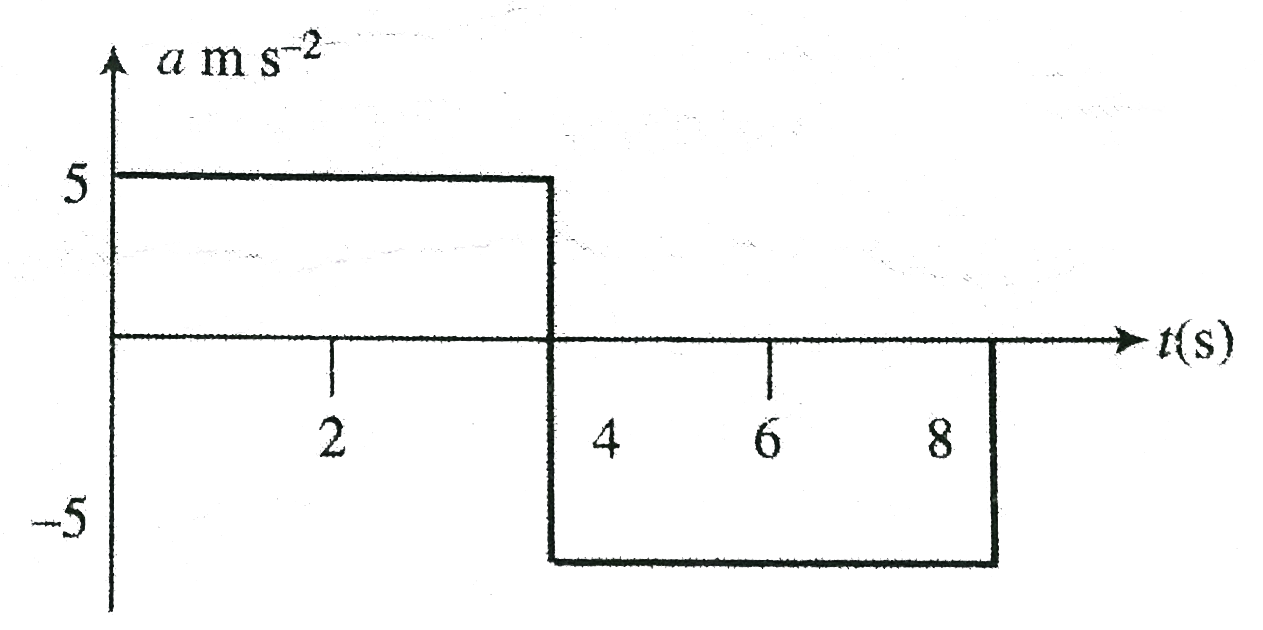 .
.
Convert this graph into velocity-time, From the velocity-time graph, find the maximum velocity attained by the particle. Also find from `v-t` graph, the sisplacement and distance travelled by the particle from `2` to `6 s`,
View SolutionGiven below shows the desplacemen-time graph for a particle moving along a straight line path.
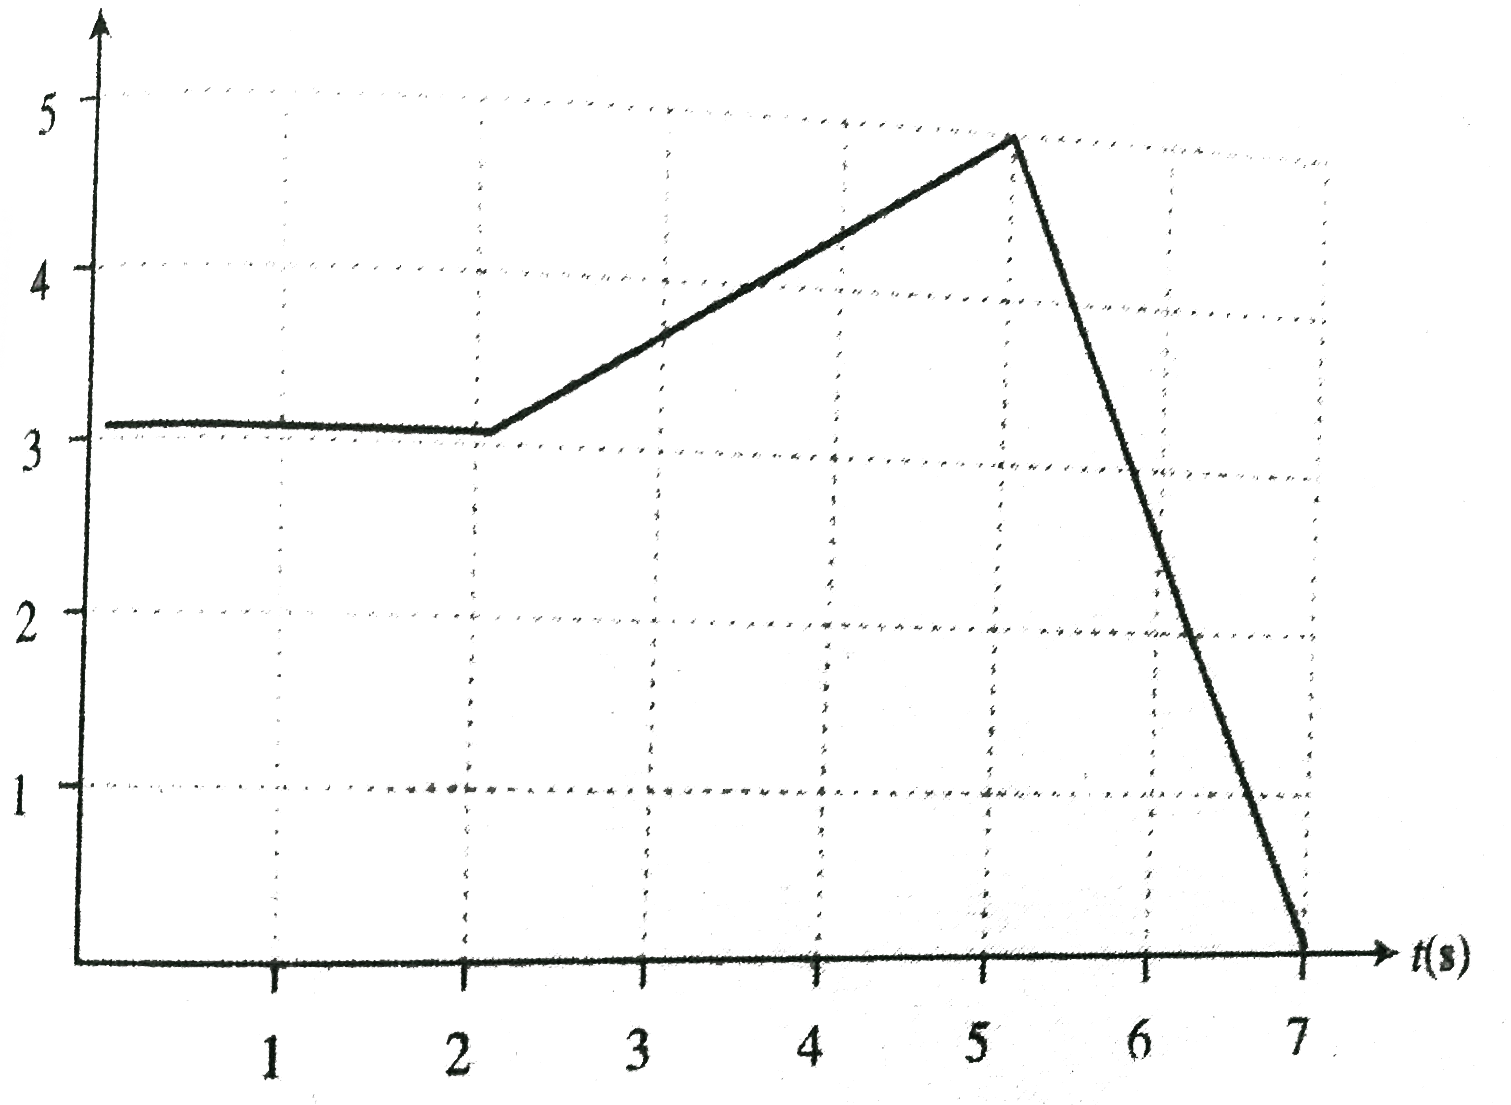 .
.
State true or false.
a. Time during which the particle was at reat is `0` to `2s`
b. Time maximum velocity of the particle is `-2.5 ms^(-1)` .
View SolutionYou are given the position-time graph of three deffernt bodies `A,B,` and `C`, Find which will have grater velocity an which will have least velocity.
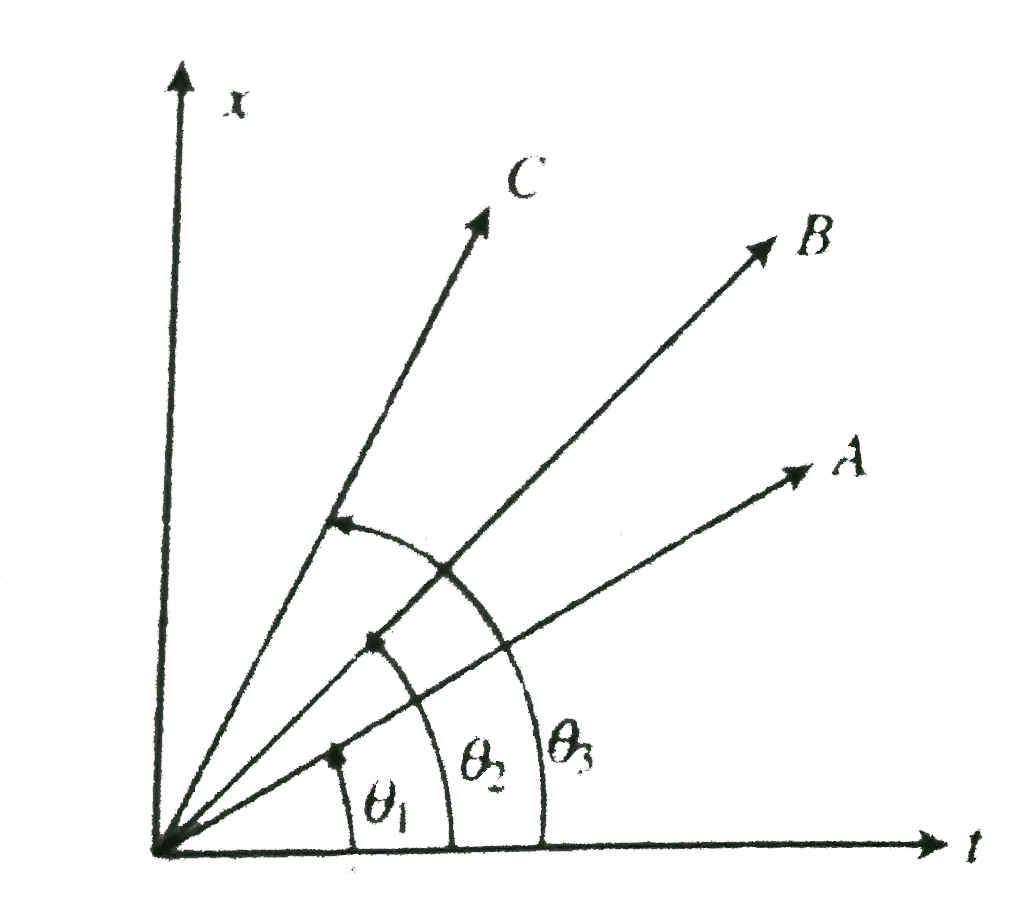 .
.
View SolutionA physics professor leaves her house and walks along the sidewalk towards campus. After `5 min`, it starts to tain and she terurns home. Her distance from her house as a function of time is shown in .
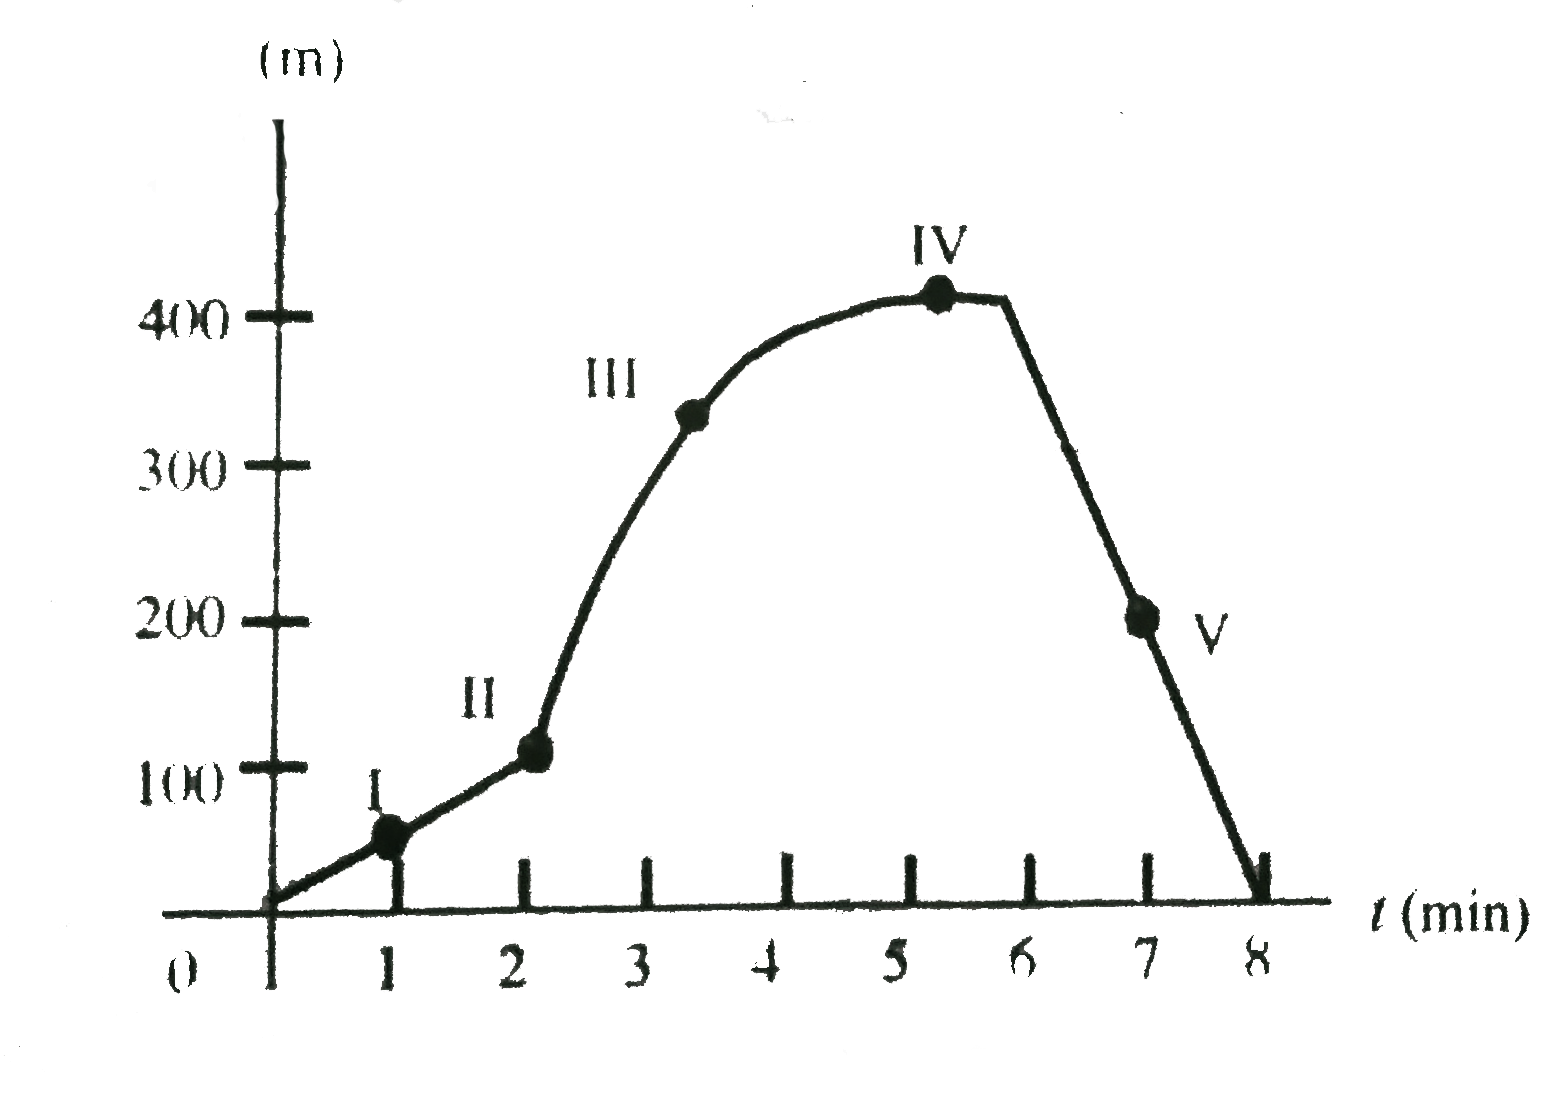 .
.
At which of the labeld points is her velocity
a. Zero
b. Constant and positive
c. Constant and negative
d. Increasing in magnitude .
View SolutionShows the position-time graphs of three cars `A,B` and `C` On the basis of the graphs answer the follwing questions:
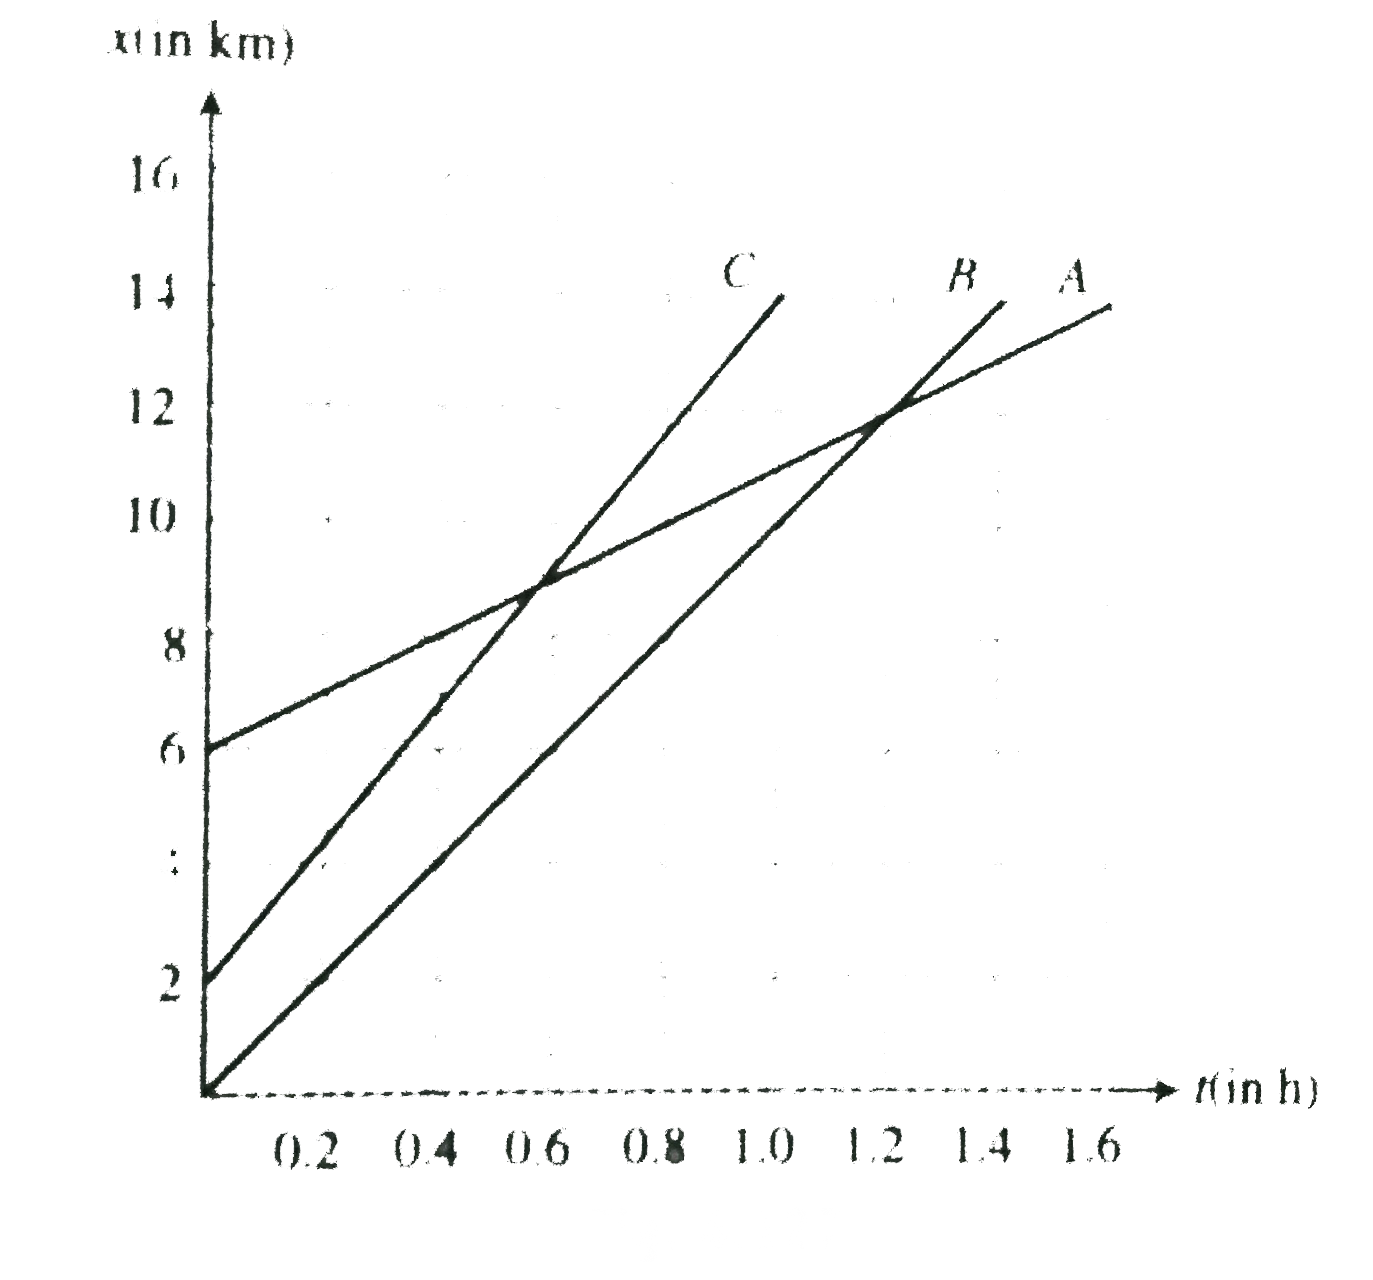 .
.
a. Which car has the highest speed and which the lowest?
b. Are the three cars evrs at the same point on the road?
c. When `C` passes `A`, wher is `B`?
d. What is the time interval during car `A` travel between the time it passed cars `B` and `C` ?.
e. What is the relative velocty of car `B` with respect to car `C`?
View SolutionA cockroach moves rectilinearly such that after sometime `t_(0)` let its (instantaneous) velocity be equal to its average velocity over that time. Referring to the `S Delta t` graph as shown in , for the motion of the cockroach, find the time `t_(0)` and the average velocity of the cockroach over the time `t_(0)`
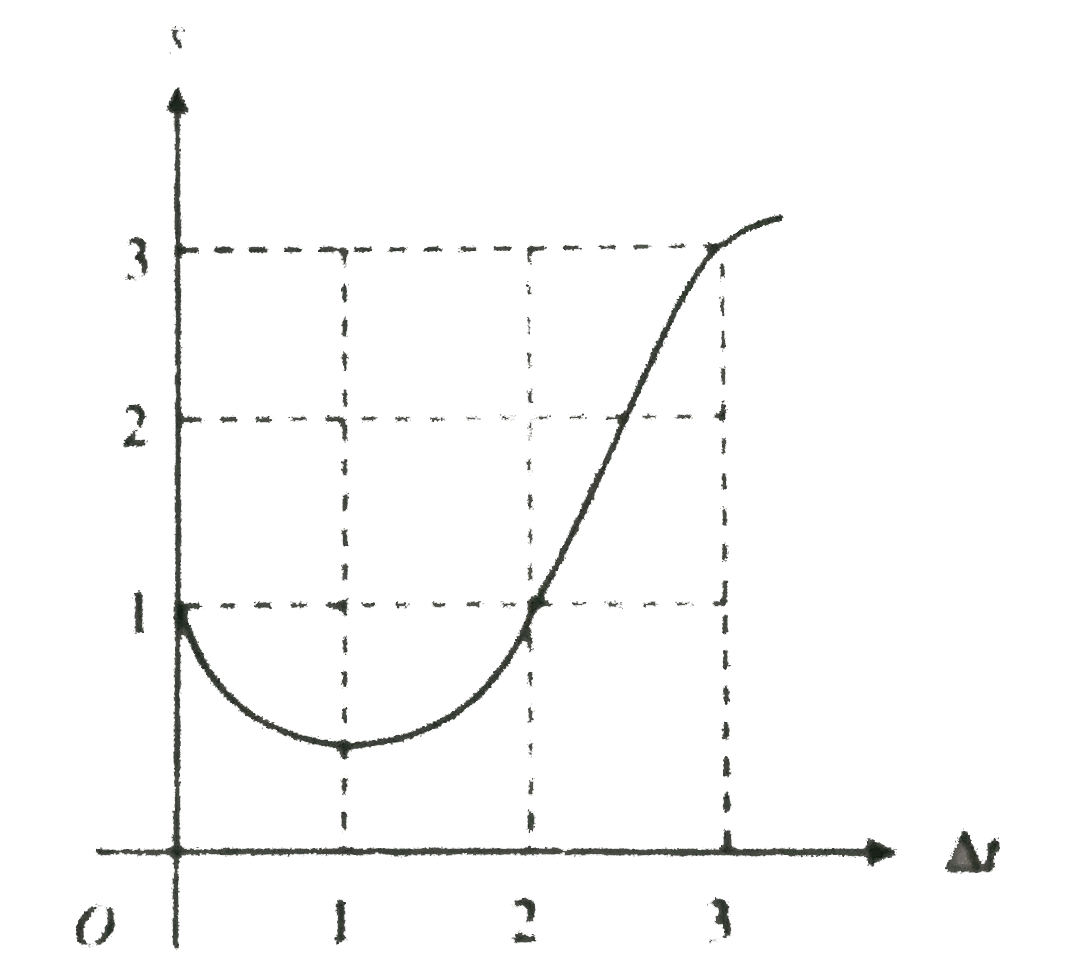 .
.
View SolutionA car accelerates from rest at a constant rate `alpha` for some time, after which it decelerates at a constant rate `beta,` to come to rest. If the total time elapsed is t seconds. Then evalute (a) the maximum velocity reached and (b) the total distance travelled.
View SolutionTwo cars, `A` and `B` move along the x-axis. Car `A` starts from rest with constant accelertion while car `B` moves with consstant velocity.
a. At what time `s`, t `s`, if any, do `A` and `B` have the same position?
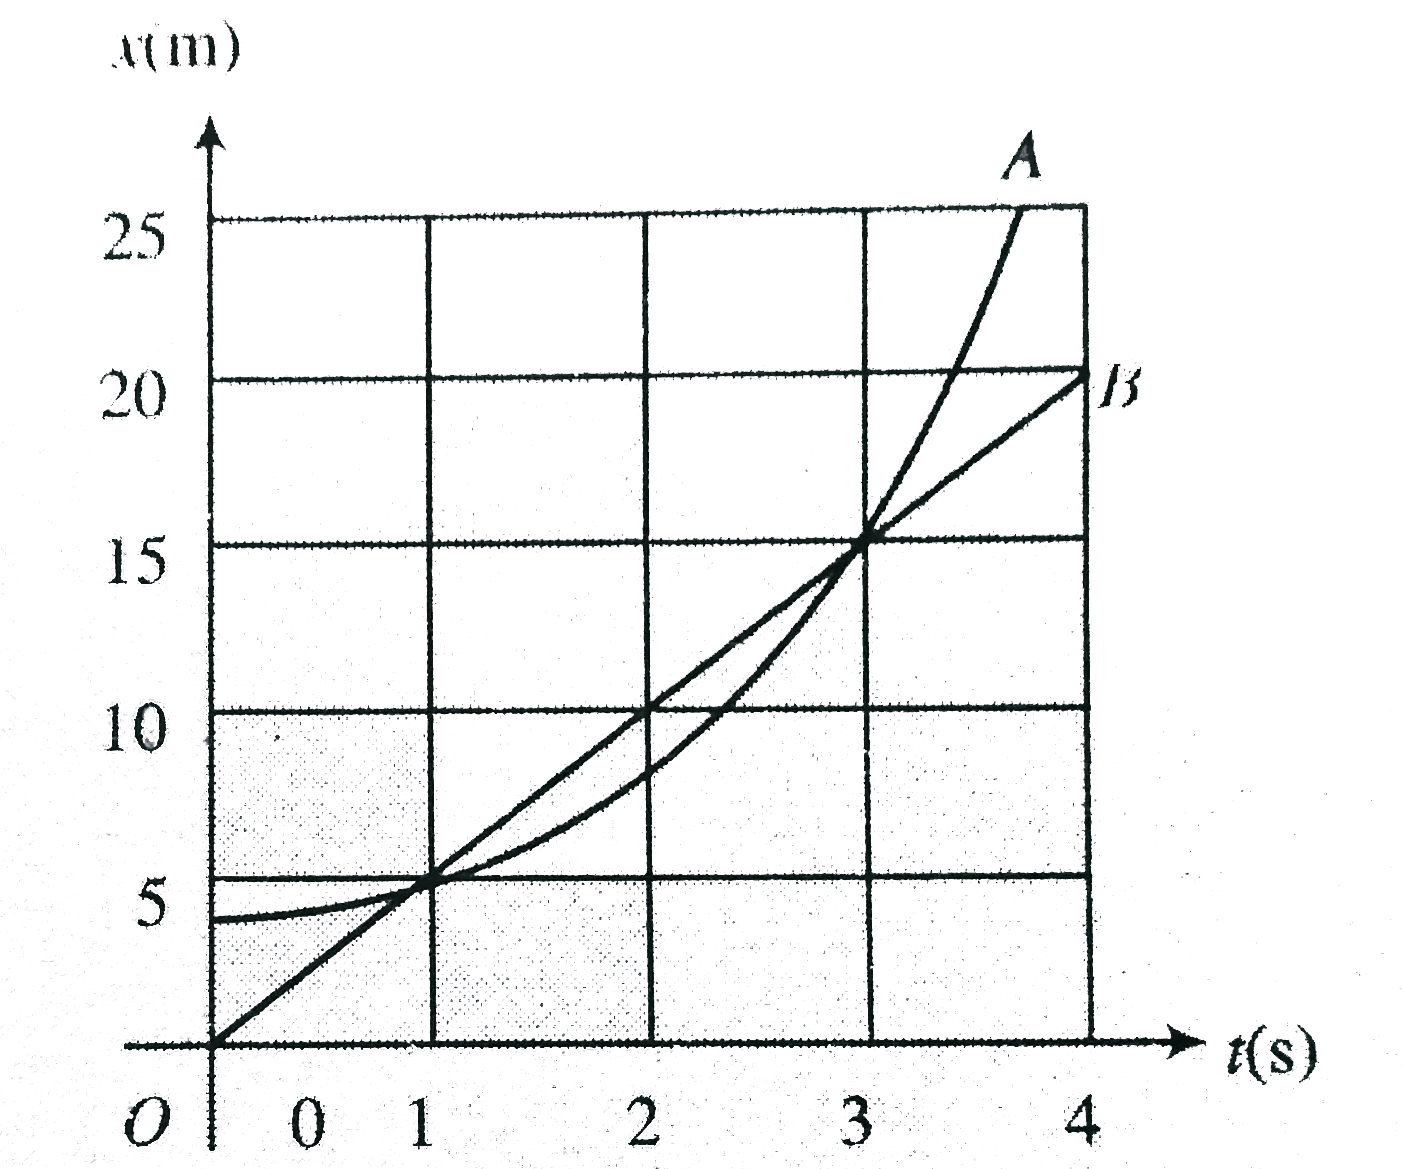 .
.
b. At what time `s` if any, do `A` and `B` have the same velocity? What is the velocity of car `B` at this time.
c. Graph velocity versus time for both `A` and `B`.
d. At what time `s`. If any, does car `A pass car `A`?
e. At what time `s`, if any does car `B` pass car `A`?
View SolutionA rigid ball traveling in a straight line `the x-axis` hits a soled wall and suddenly rebounds during a brief instant . The `v_(x)-t` grap in . shows this ball `s` velocty as a function of time. During the first `20 s` of its motion, find (a) its displacement (b) the total destance the ball moves, and (c ) skerch a graph of `a_(x)-t` for this ball`s motion. (d) Is the graph shown really vertcal at `5 s`?
Explain.
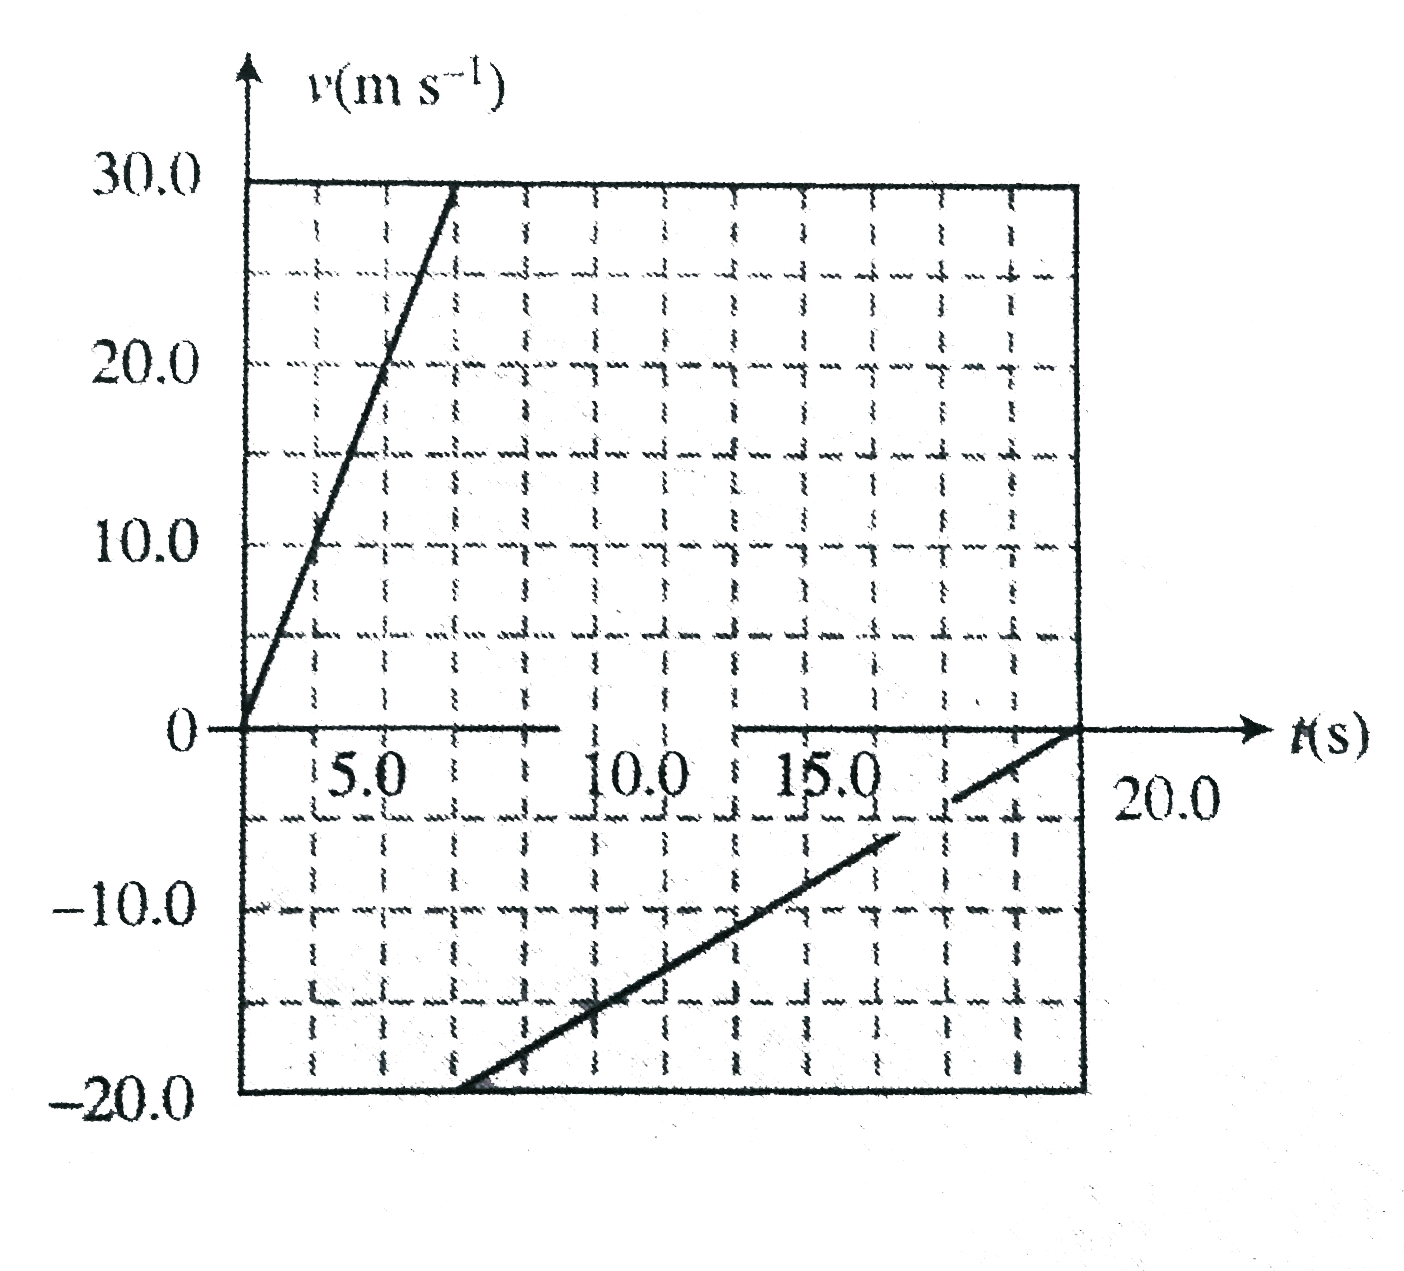 .
.
View SolutionRefering to `v-s` diagram, find:
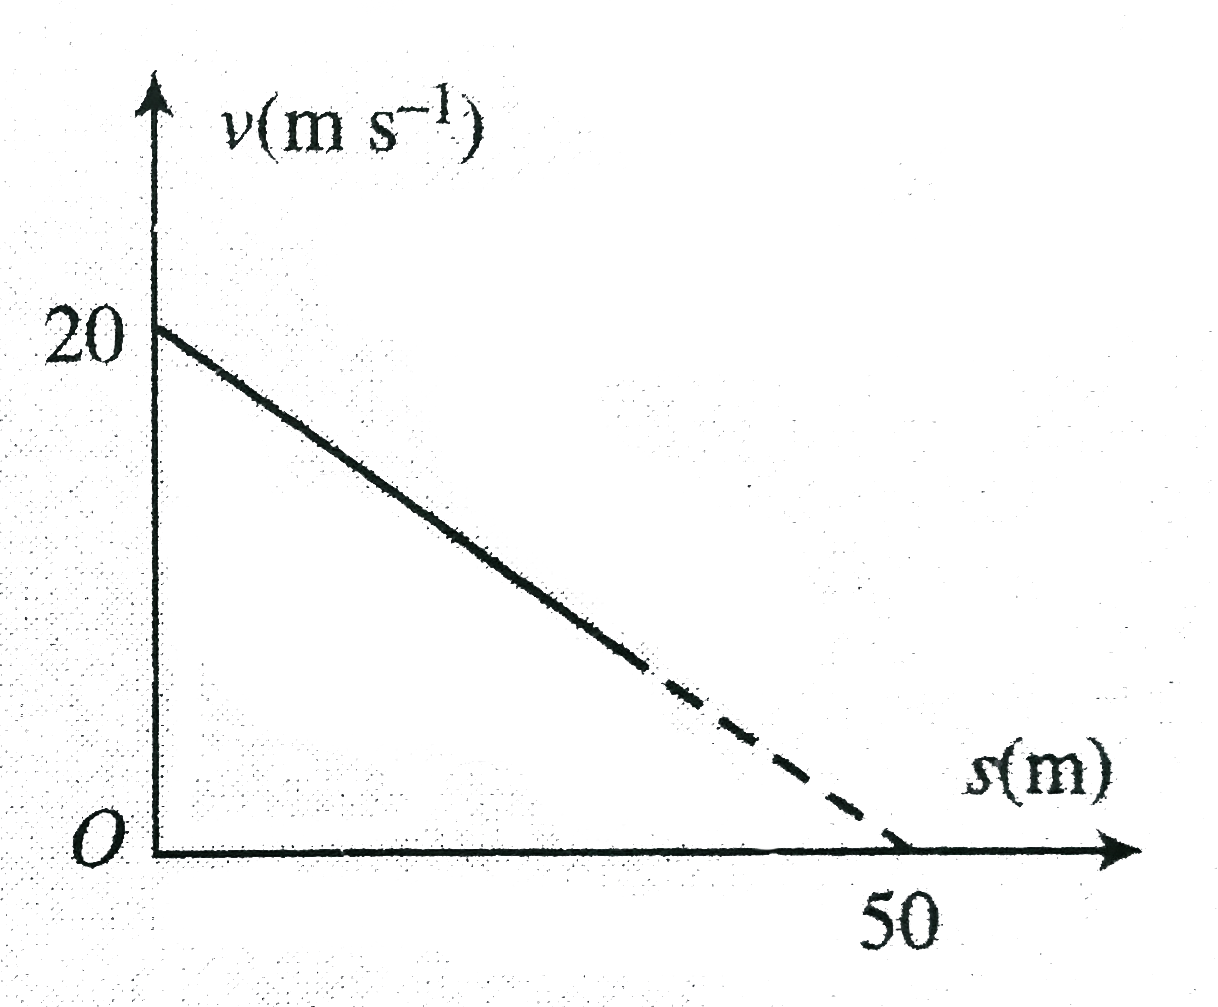 .
.
a. Acceleration of the particle when its velocity becomes half of the initial velocity.
b. Total distance covered by the particle.
View SolutionA racing motor boat speeds up in a straight line in a lake, from rest. Referring to the acceleration-displacement graph for the speeding boat dind its speed when it passes a raft at a distance of `40m` from the starting poingt.
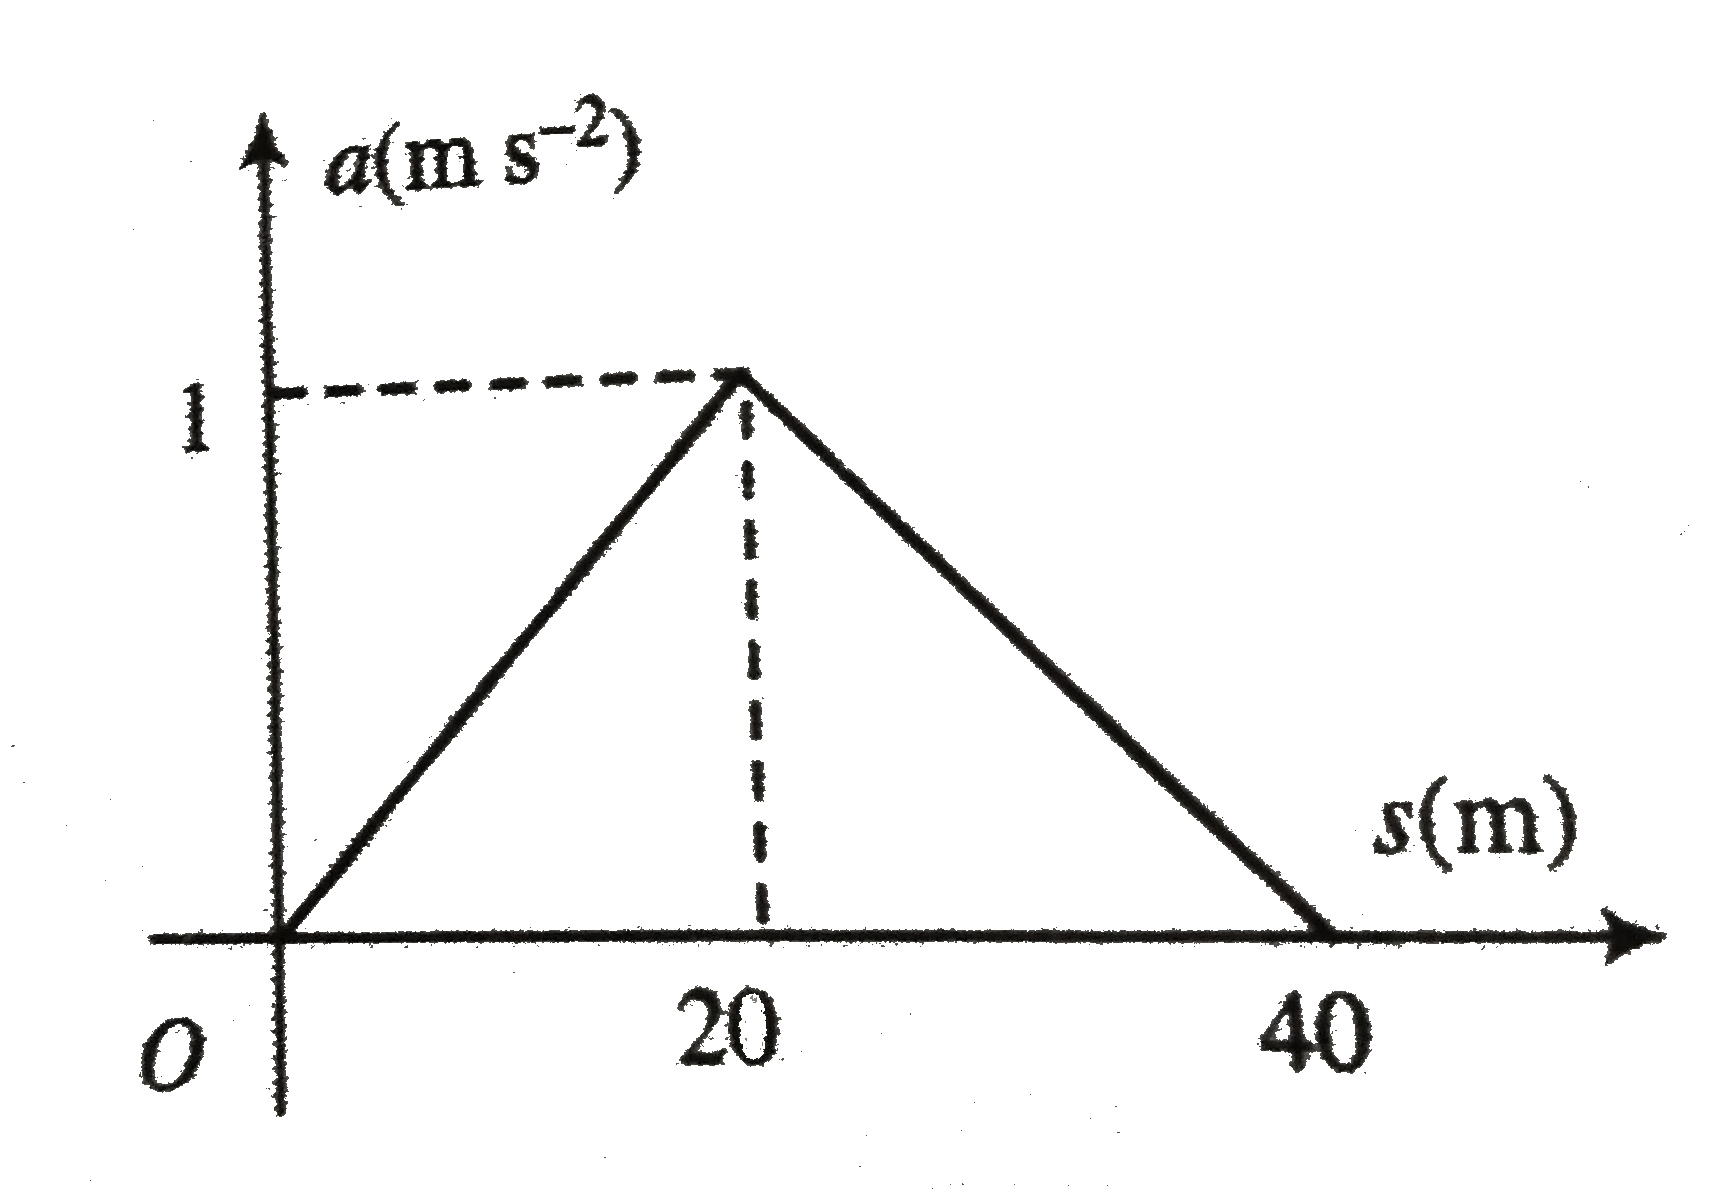 .
.
View SolutionReferring `a-s` diagram in , find the velocity after particle travel `120 m` from starting. Assume `v_(0)=0`.
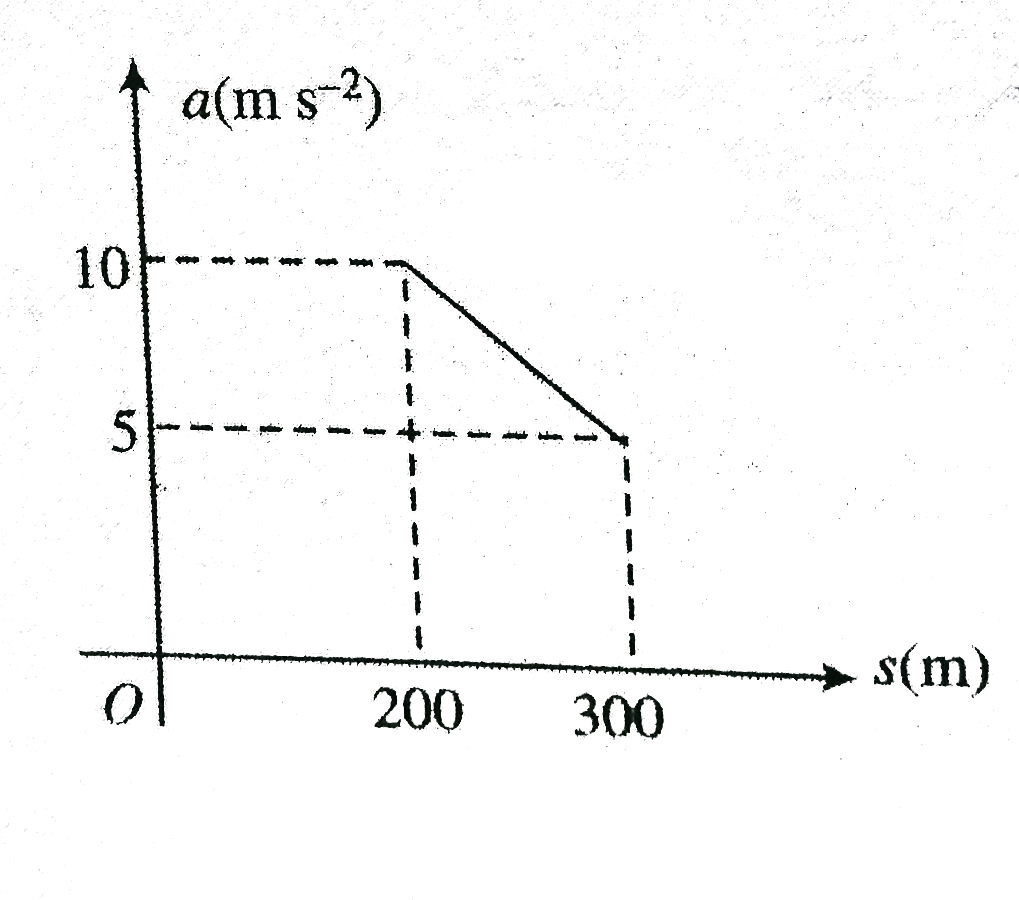 .
.
View Solution
Exercise 4.4 questions and complete solutions for chapter KINEMATICS-1 of CENGAGE PHYSICS (HINGLISH) of Class 11