Complete Solutions to Graphical Concept of chapter KINEMATICS-1 of Class 11 book with complete answers and questions
| Class 11 | PHYSICS |
| Chapter | KINEMATICS-1 |
| CENGAGE PHYSICS | Graphical Concept |
| Number Of Questions | 17 |
| Academic Year | 2023-24 |
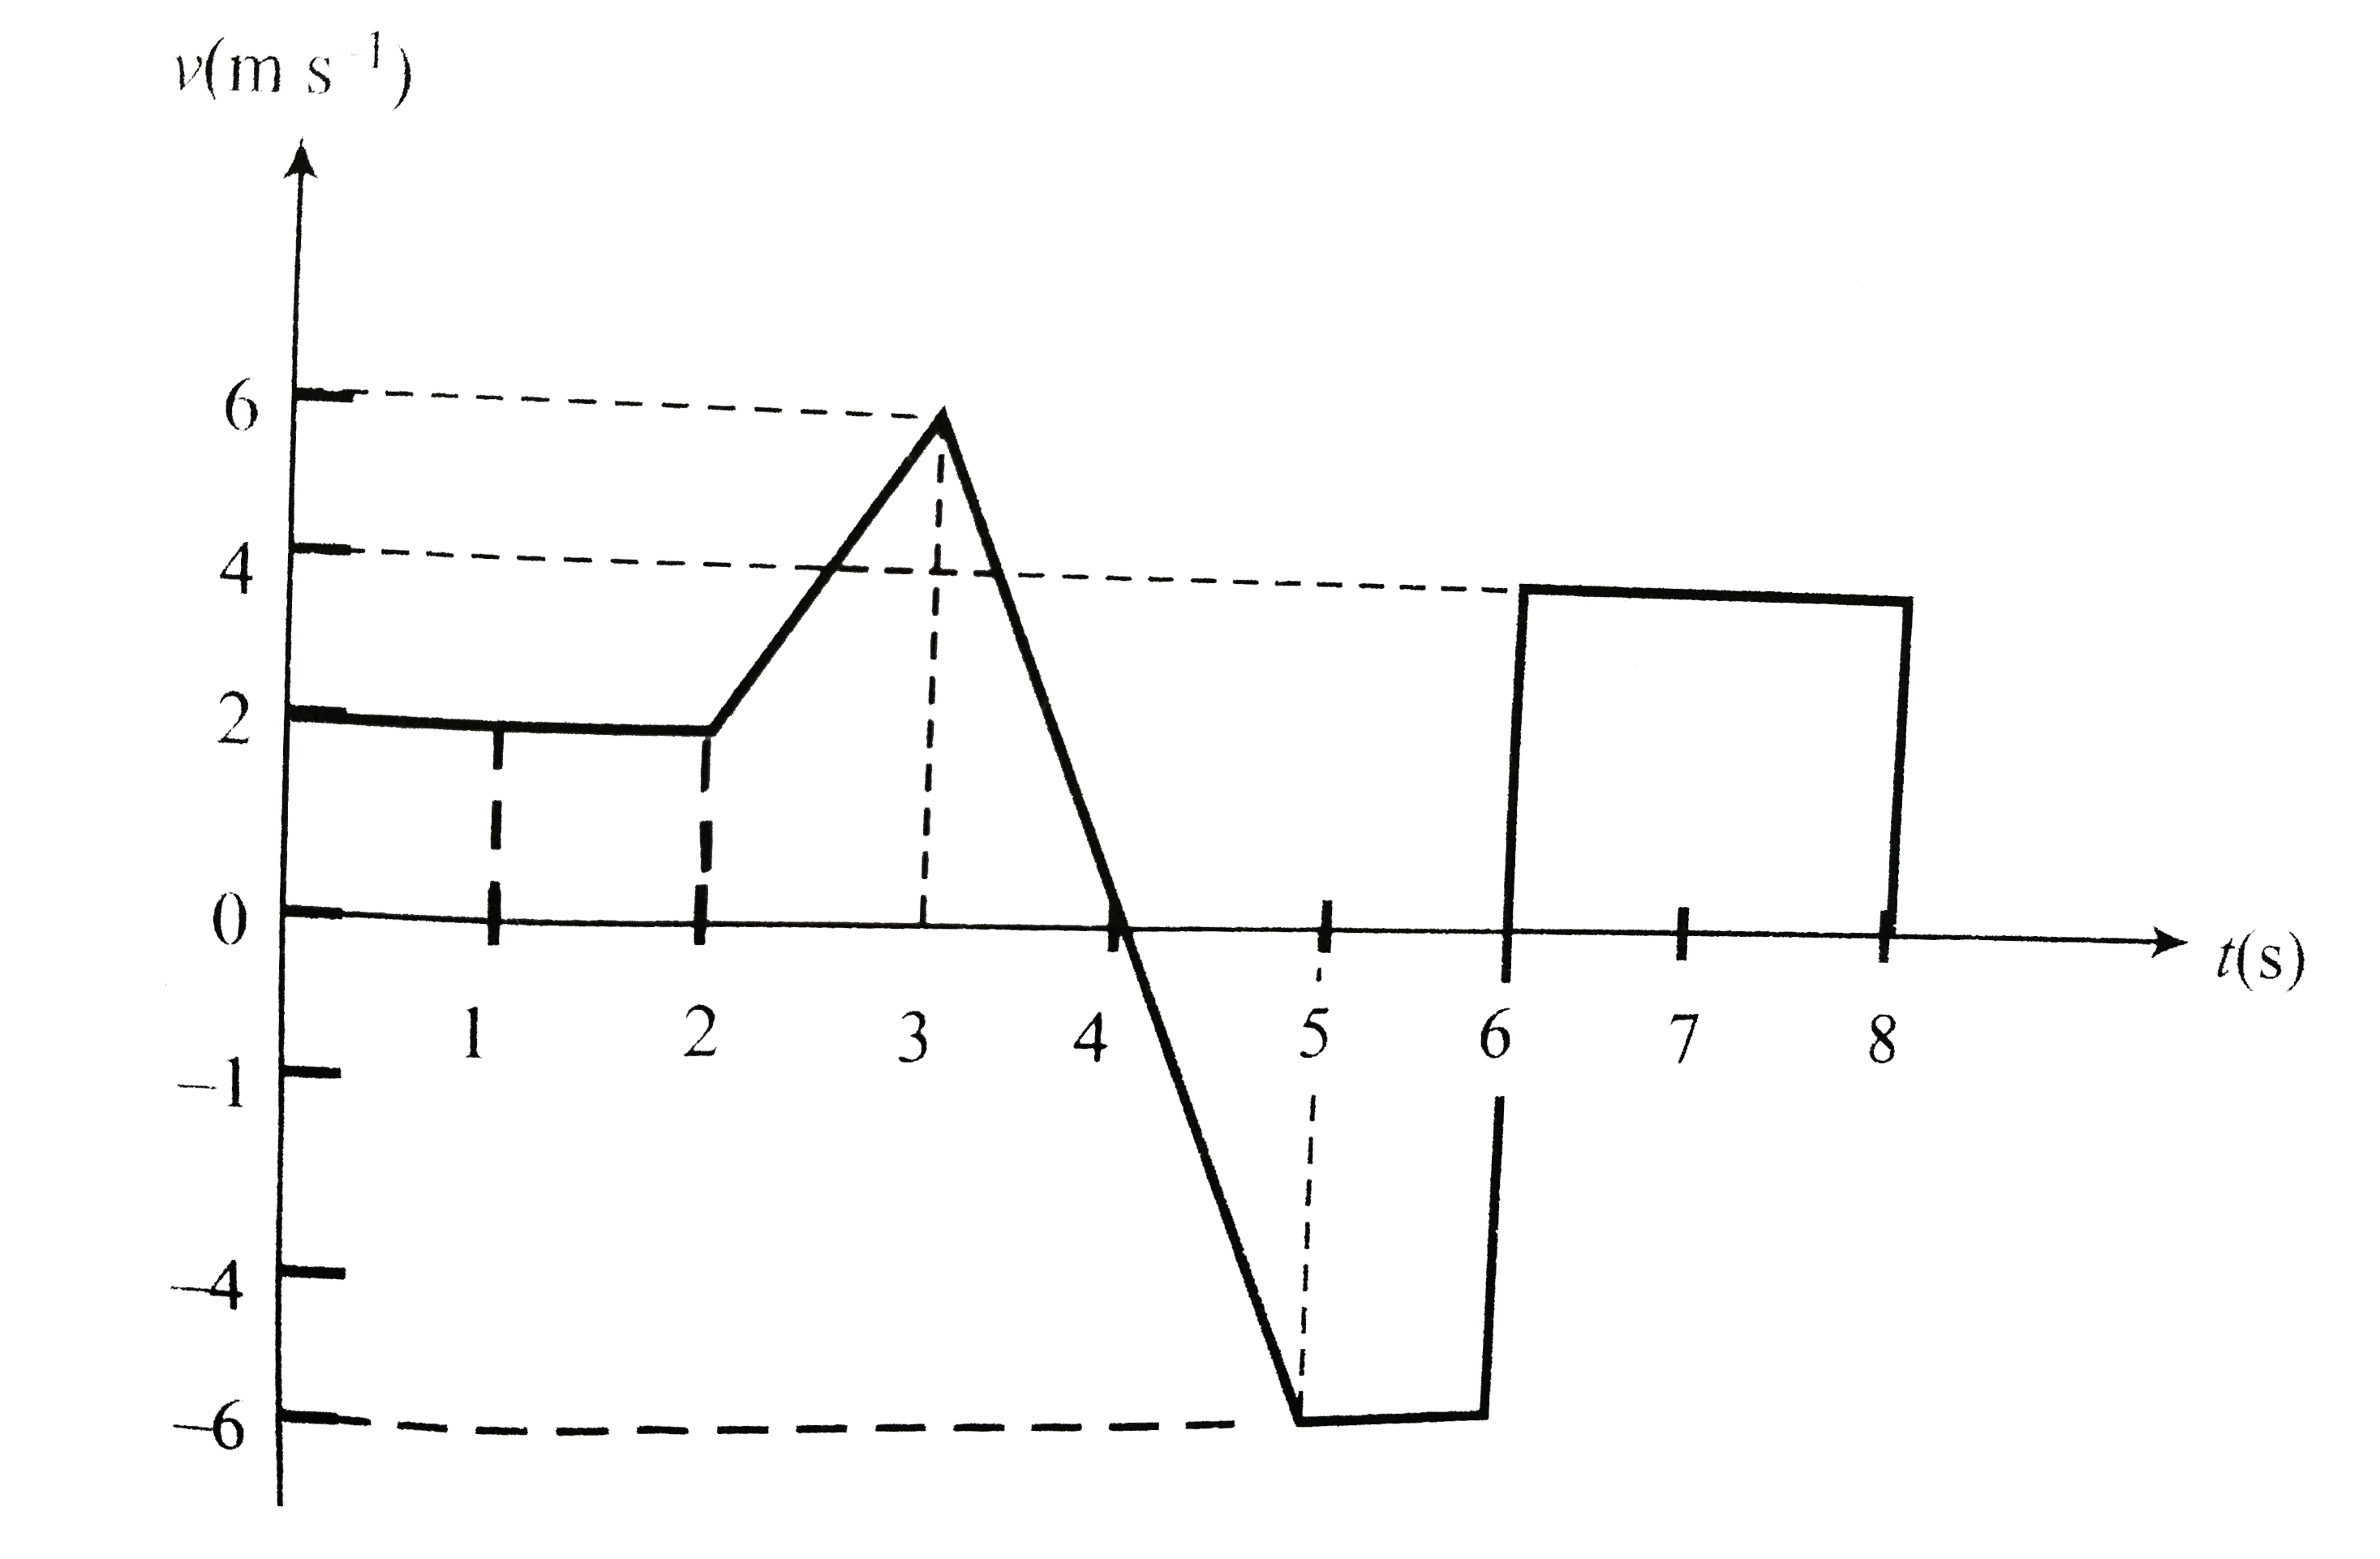
The velocity-time graph of a body is shown in .
The displacement of the body in `8 s` is.
 .
.
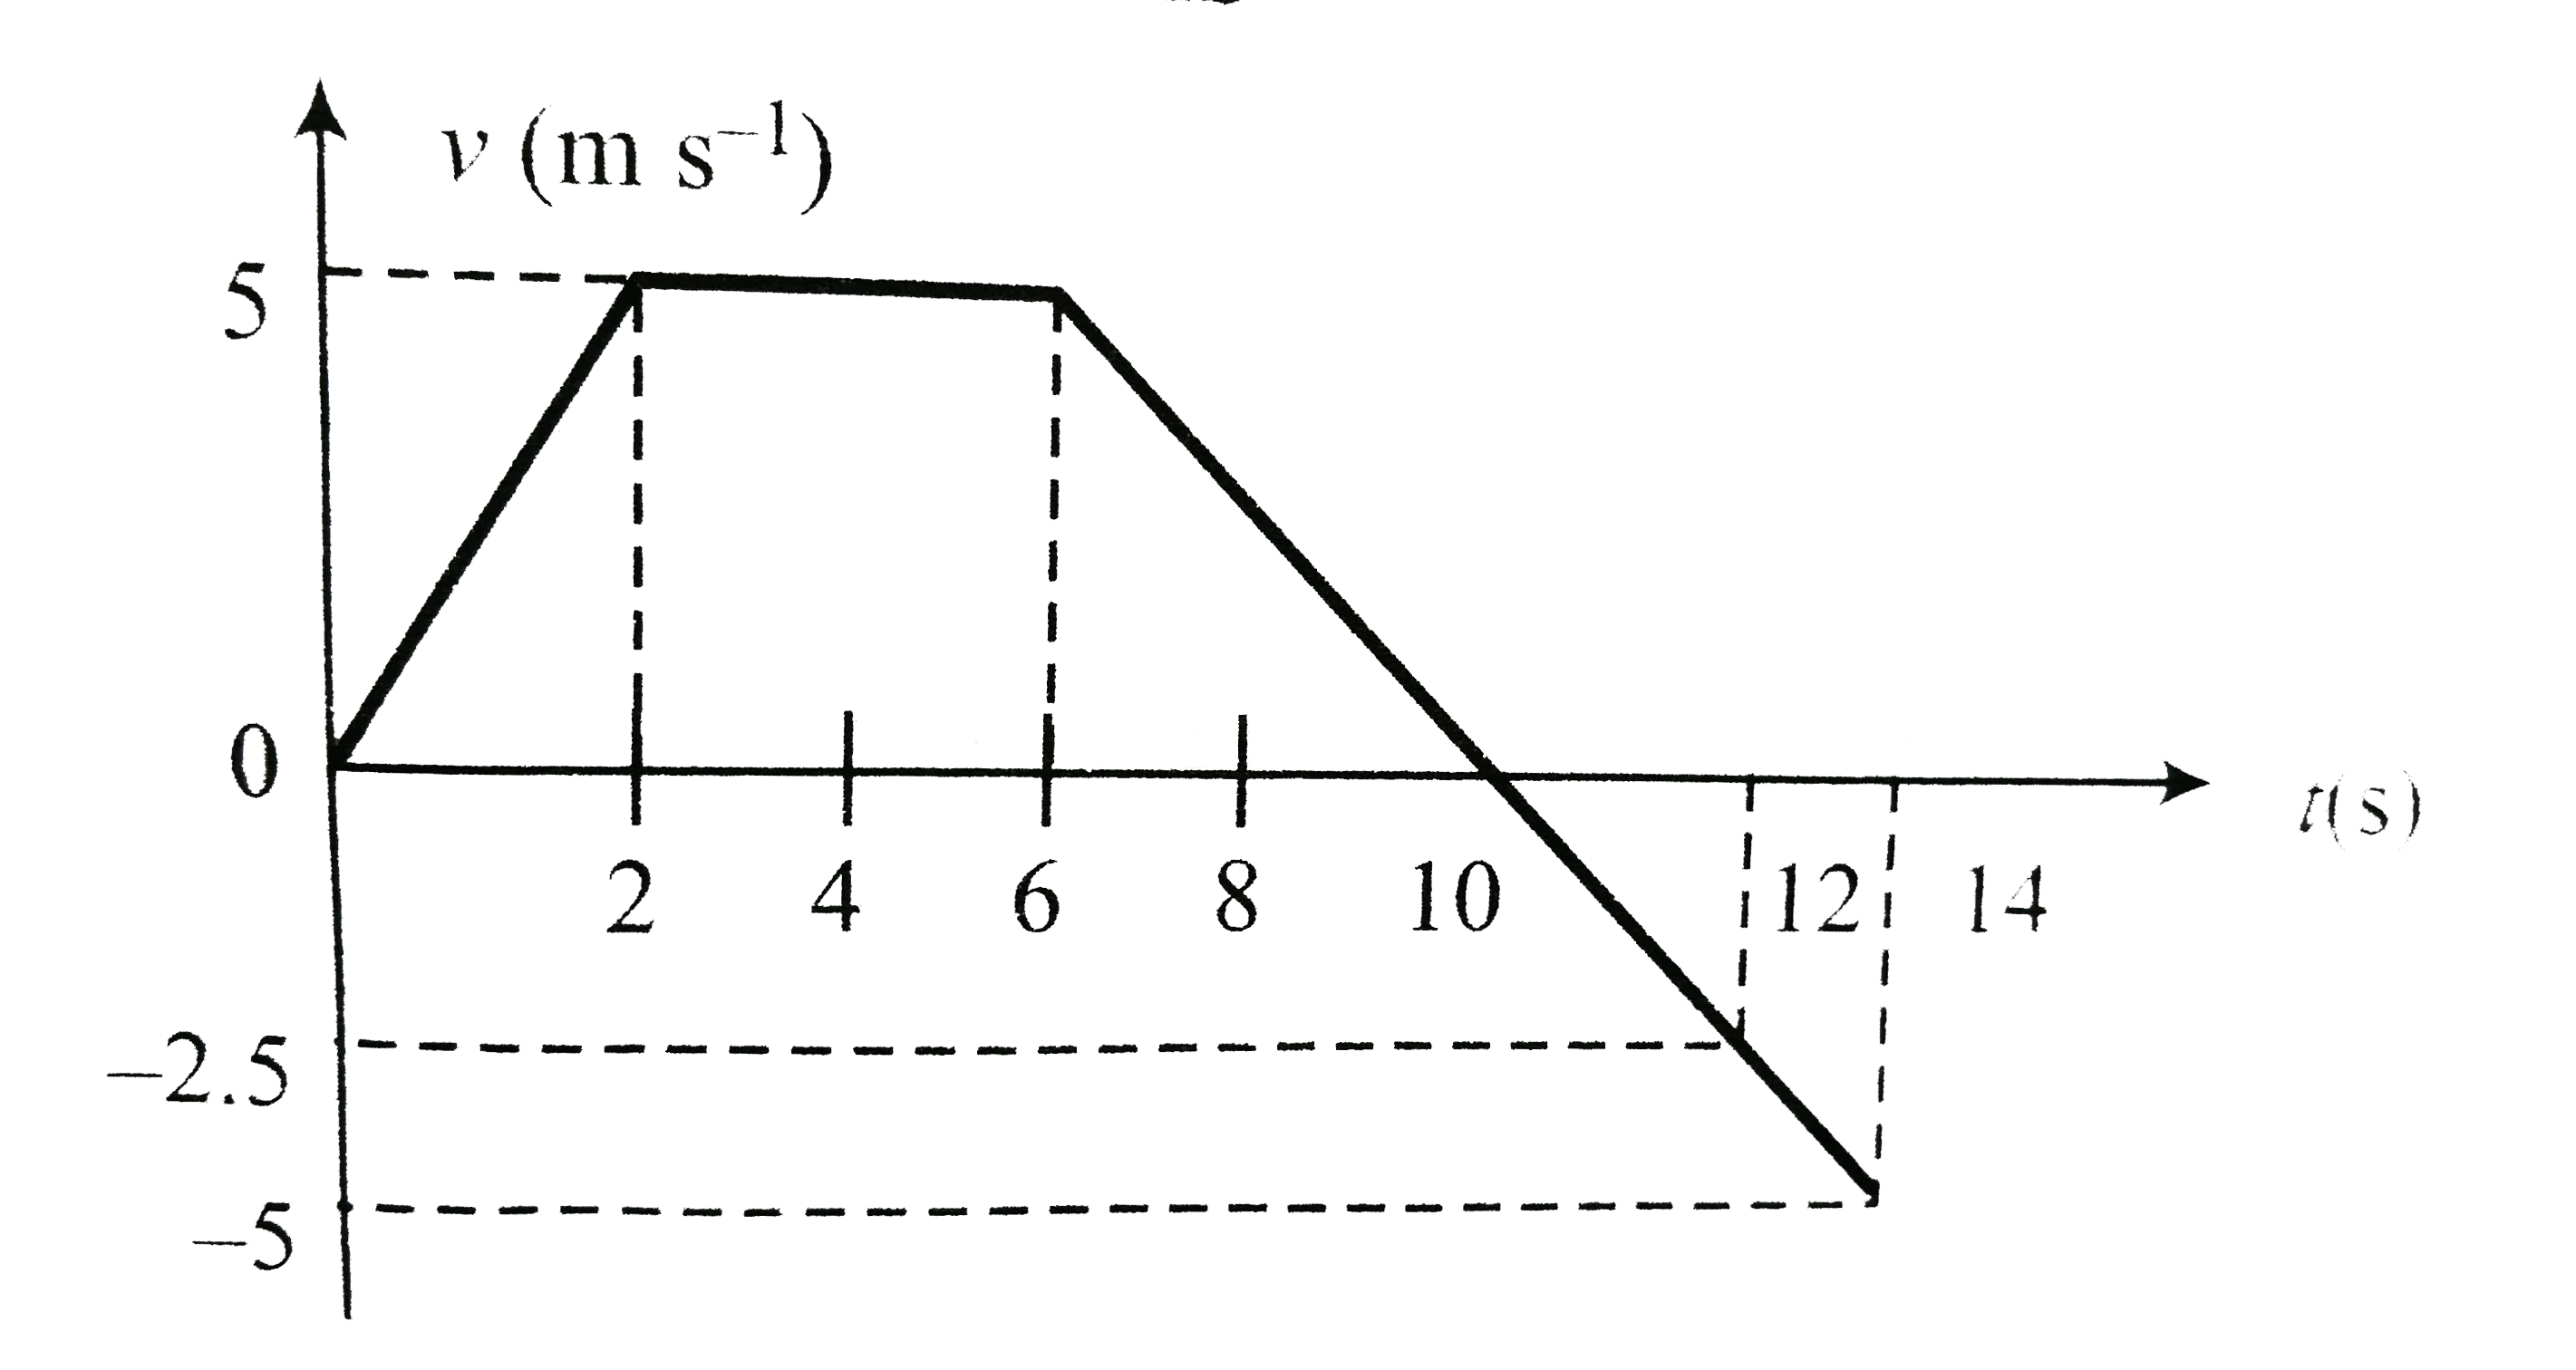
View SolutionThe variation of velocity of a particle moving along a straight line is shown in . is
 .
.
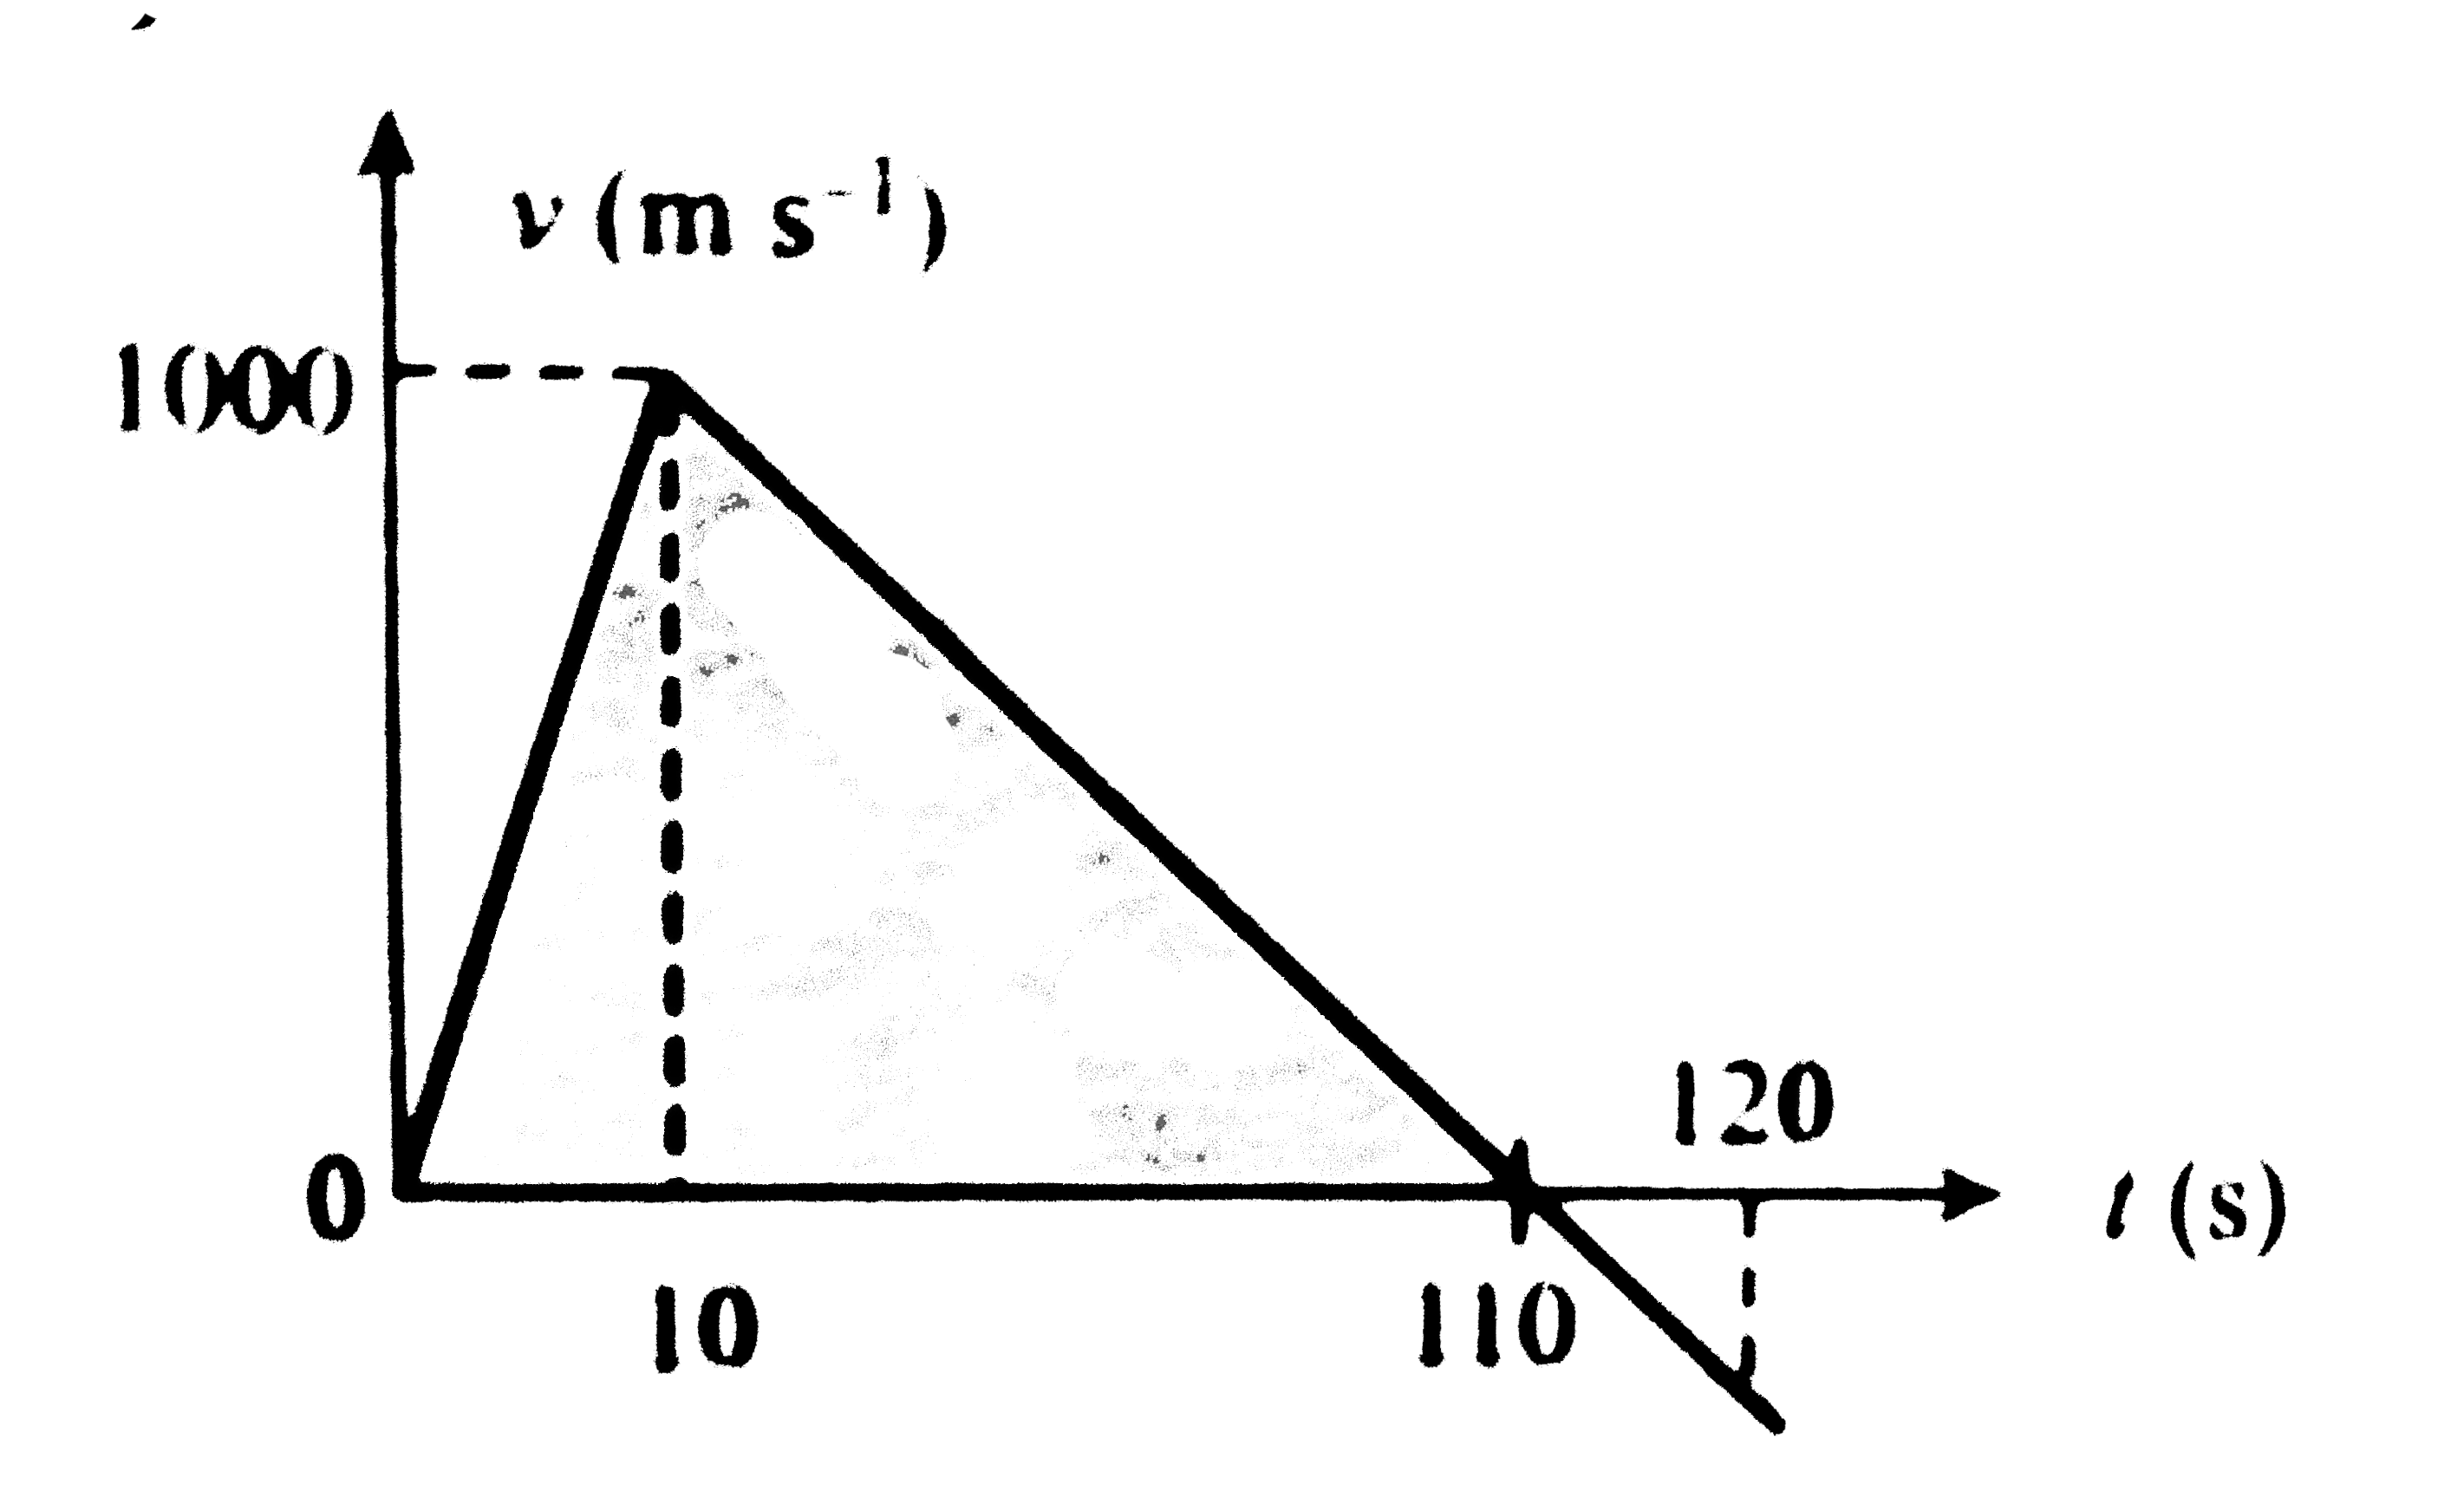
View SolutionThe follwing graph shows the variation of velocity of a rocker with time. Then the mximum height attained by the rocket is.
 .
.
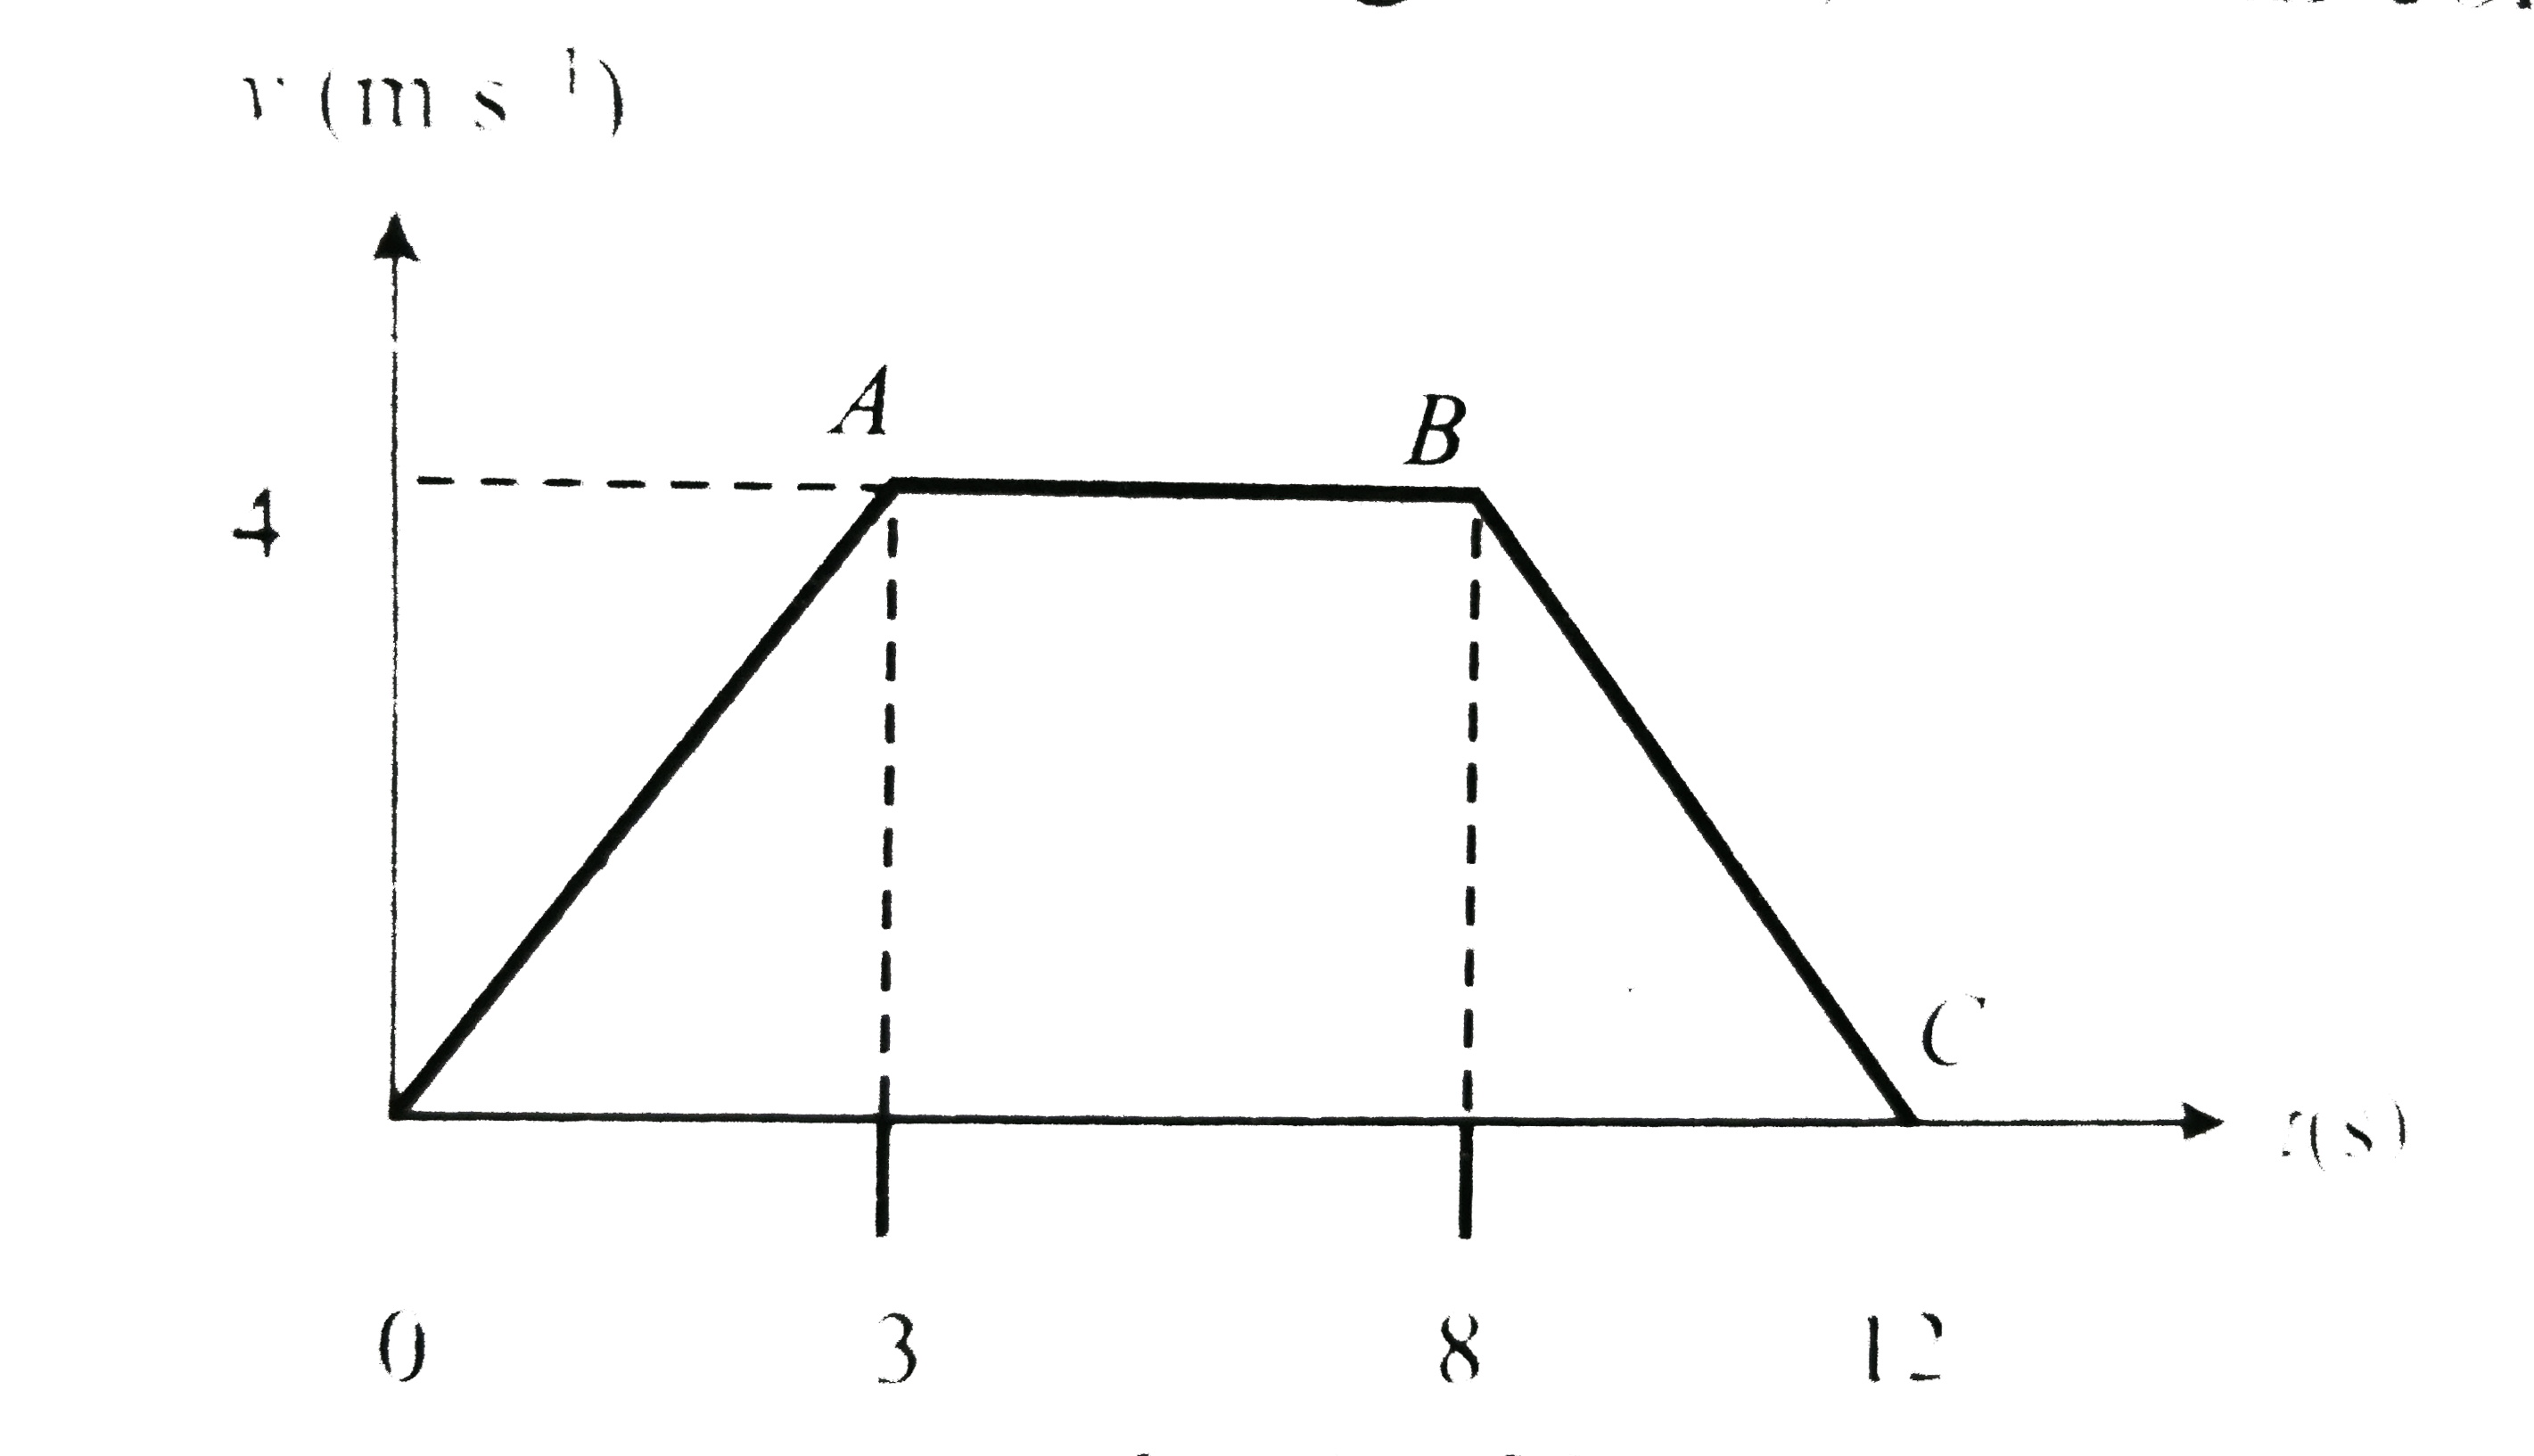
View SolutionFrom athe velocity time graph, given in of a particle moving in a straight line, one can conclude that
 .
.
View SolutionThe velovity-time graph of a particle moving in a straitht line is shown in . The acceleration of the particle at `t=9 s` is.
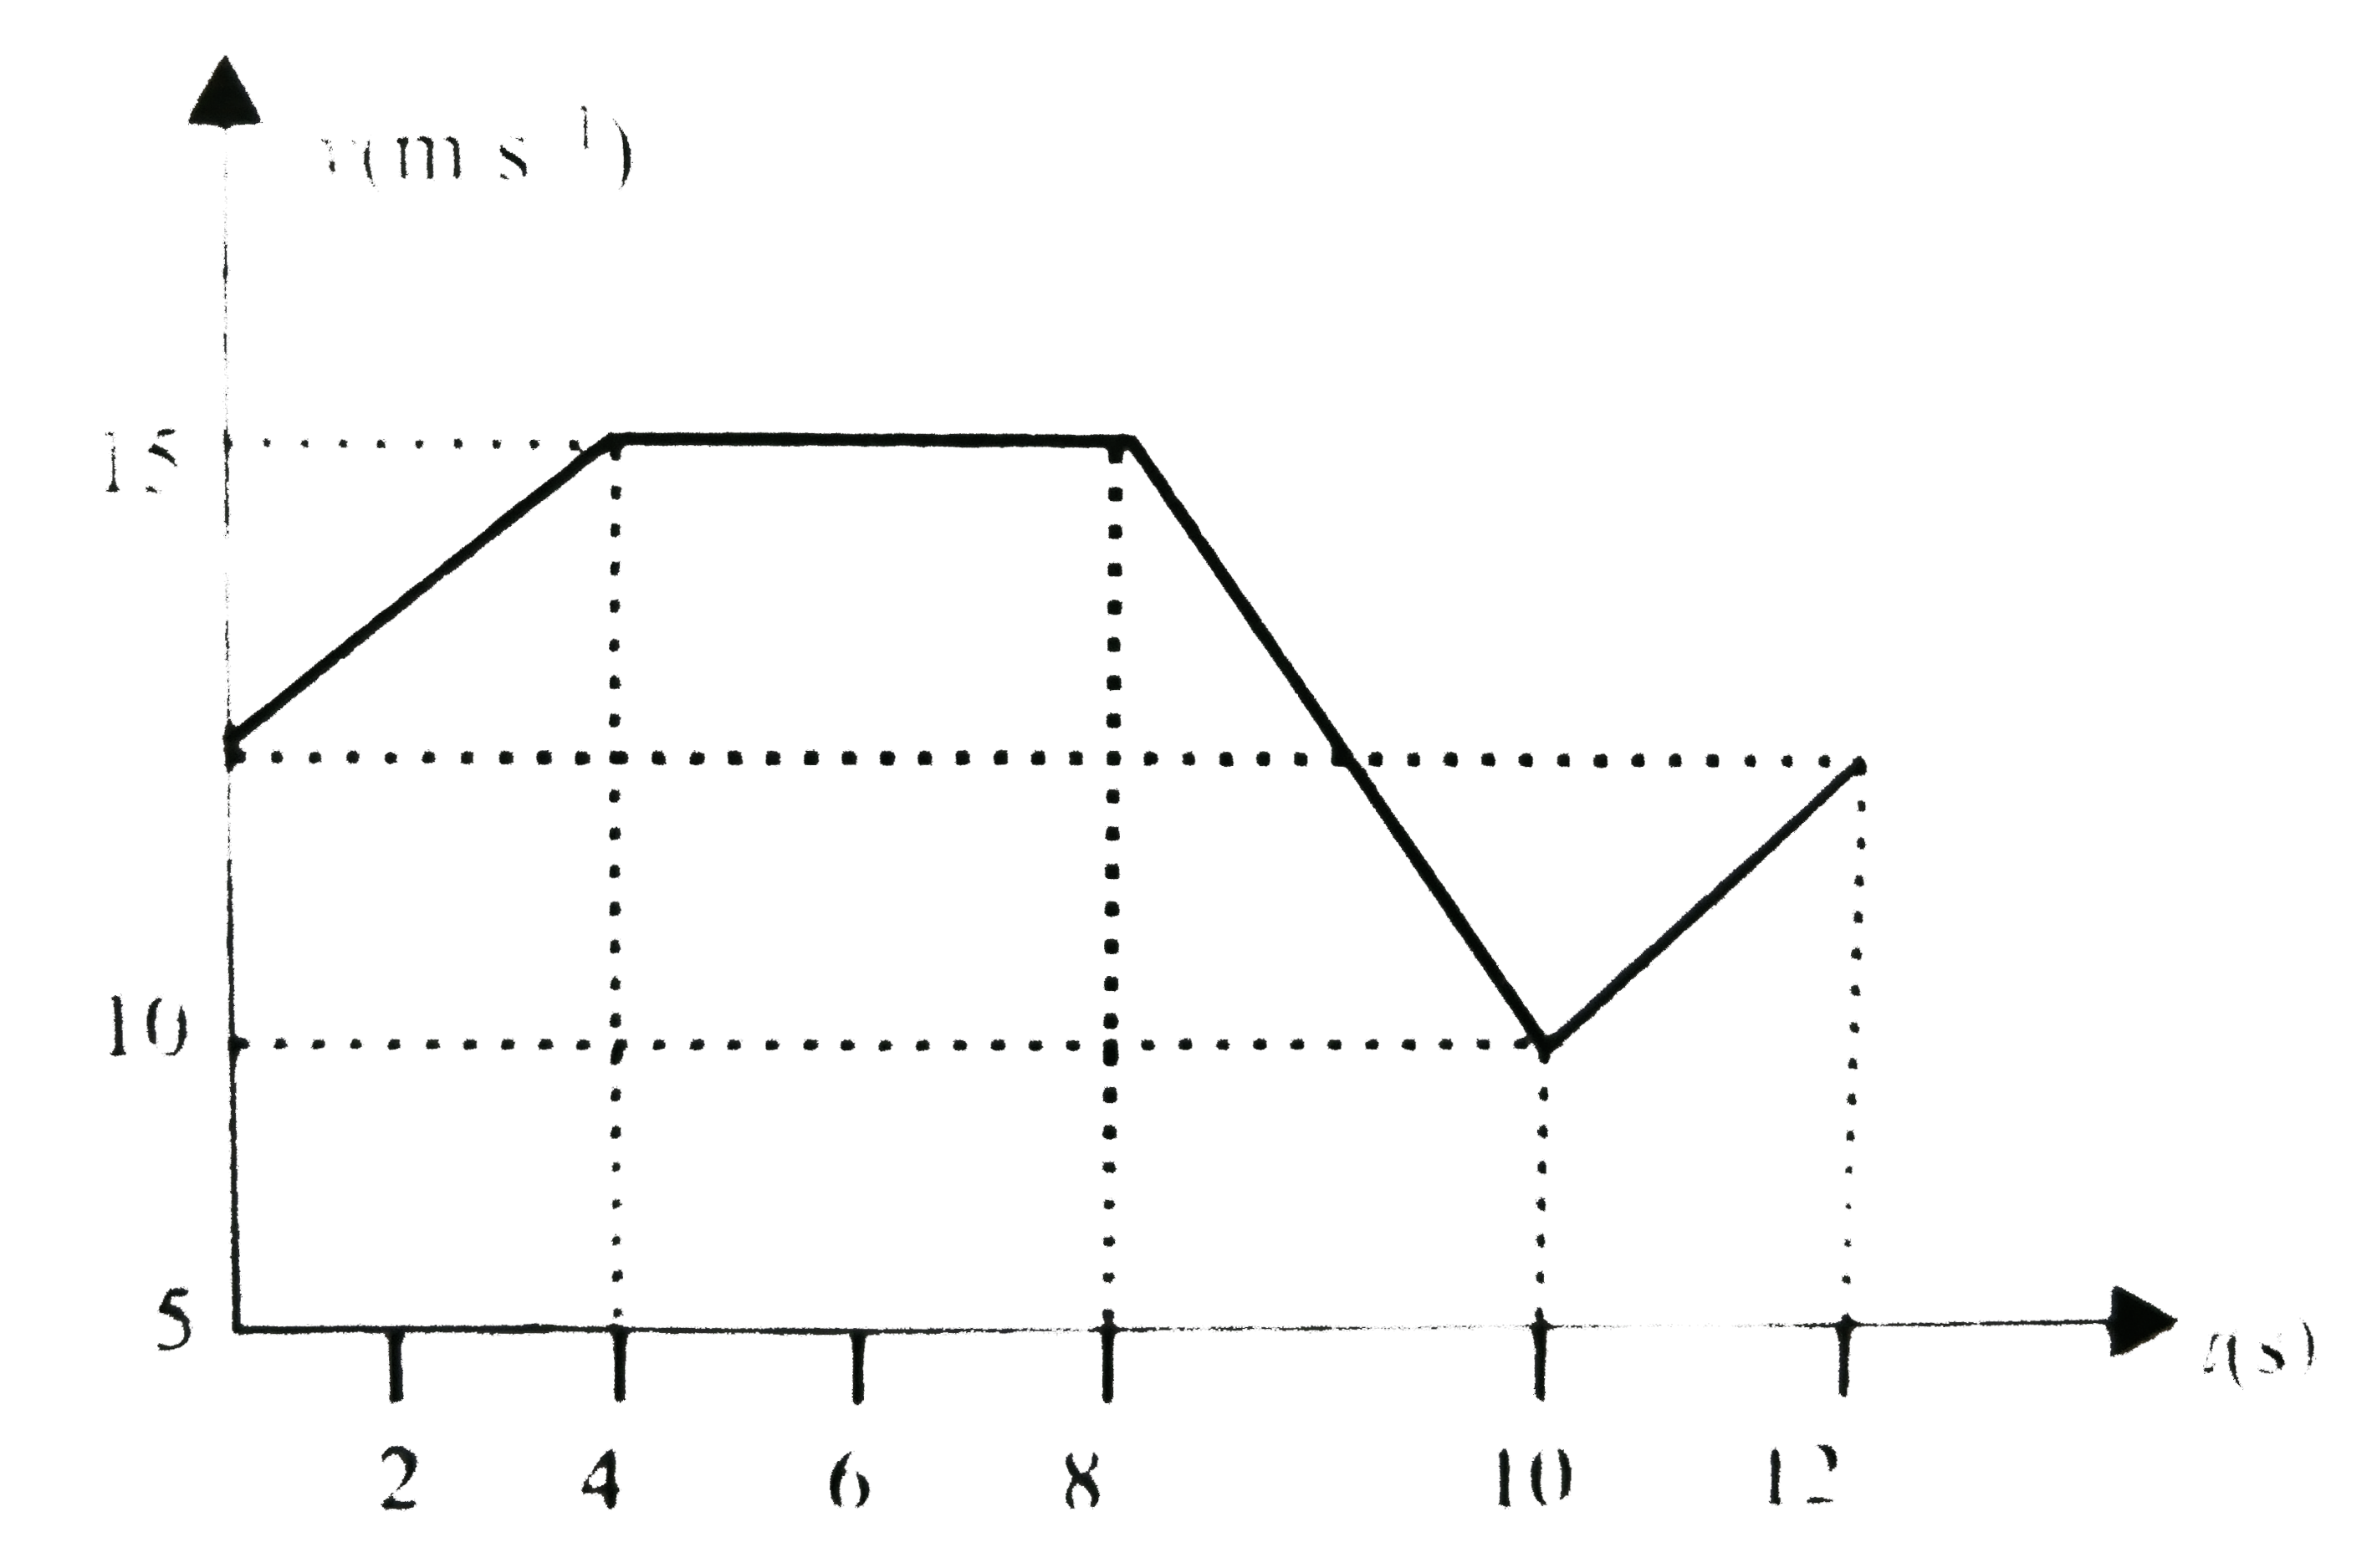 .
.
View SolutionThe velocity-time graph of a body is given in. The maximum acceleration in `ms^(-1)` is .
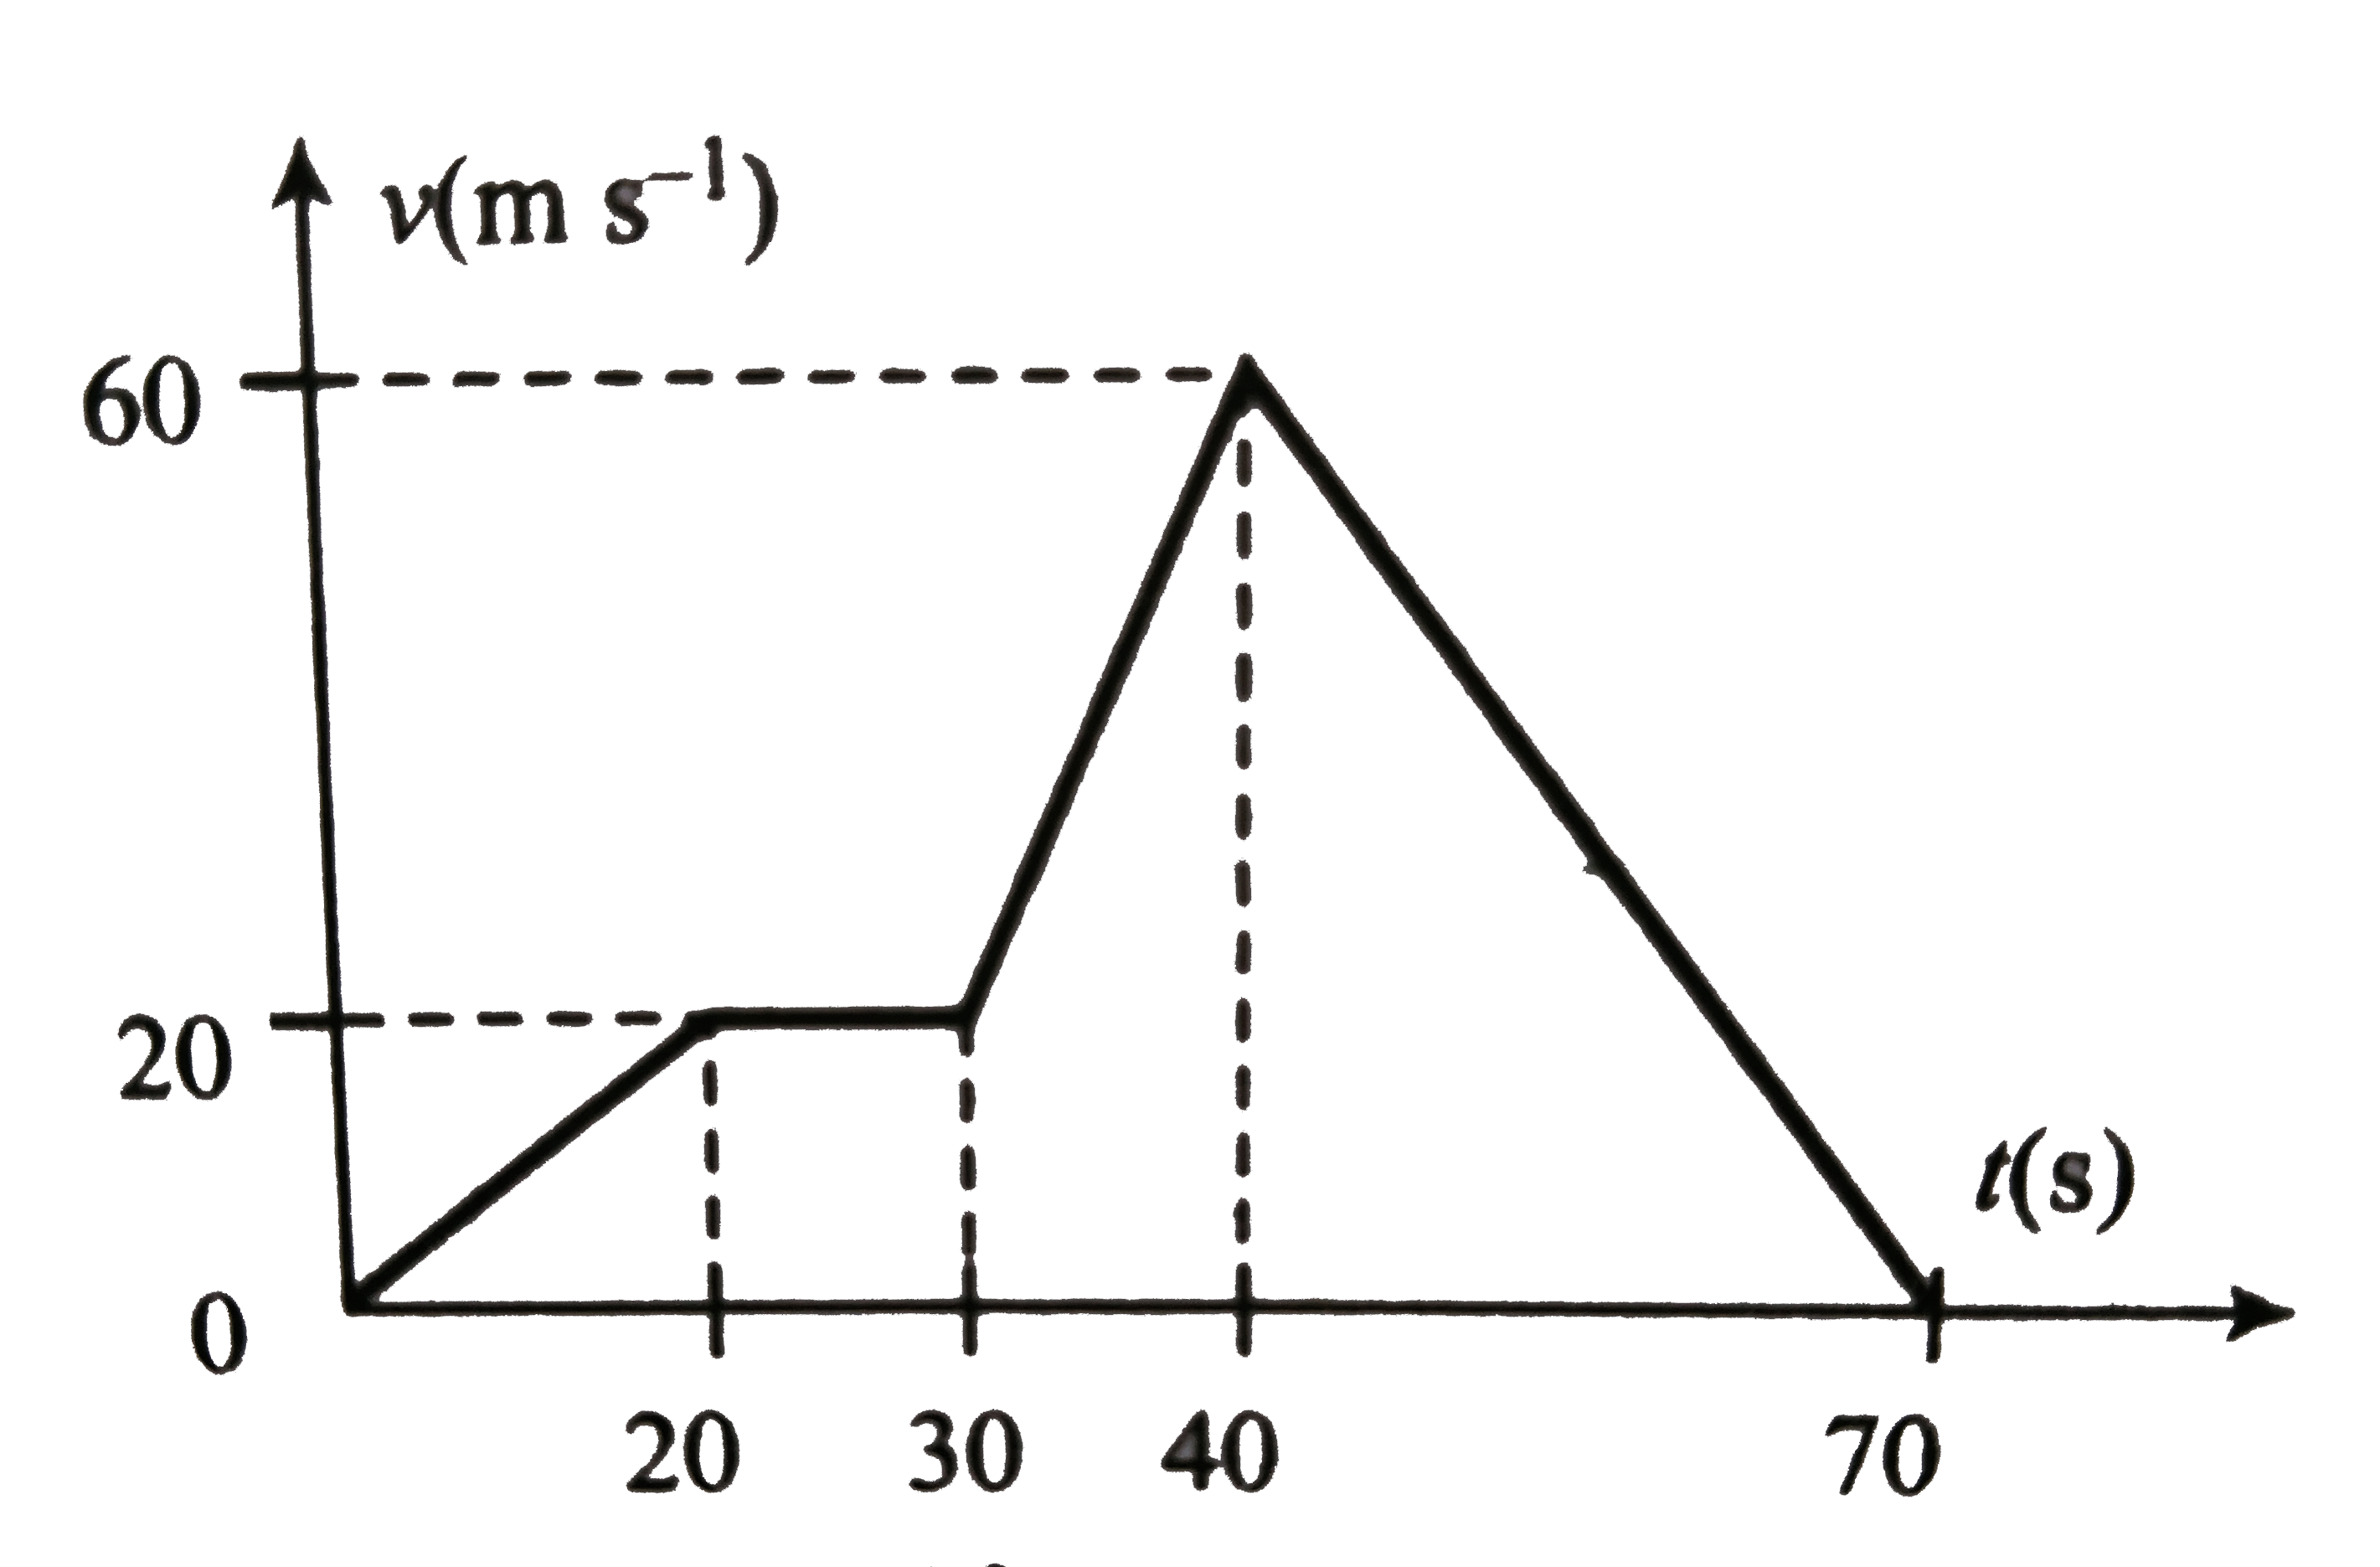 .
.
View SolutionThe displacement-time graph of a body is shown in.
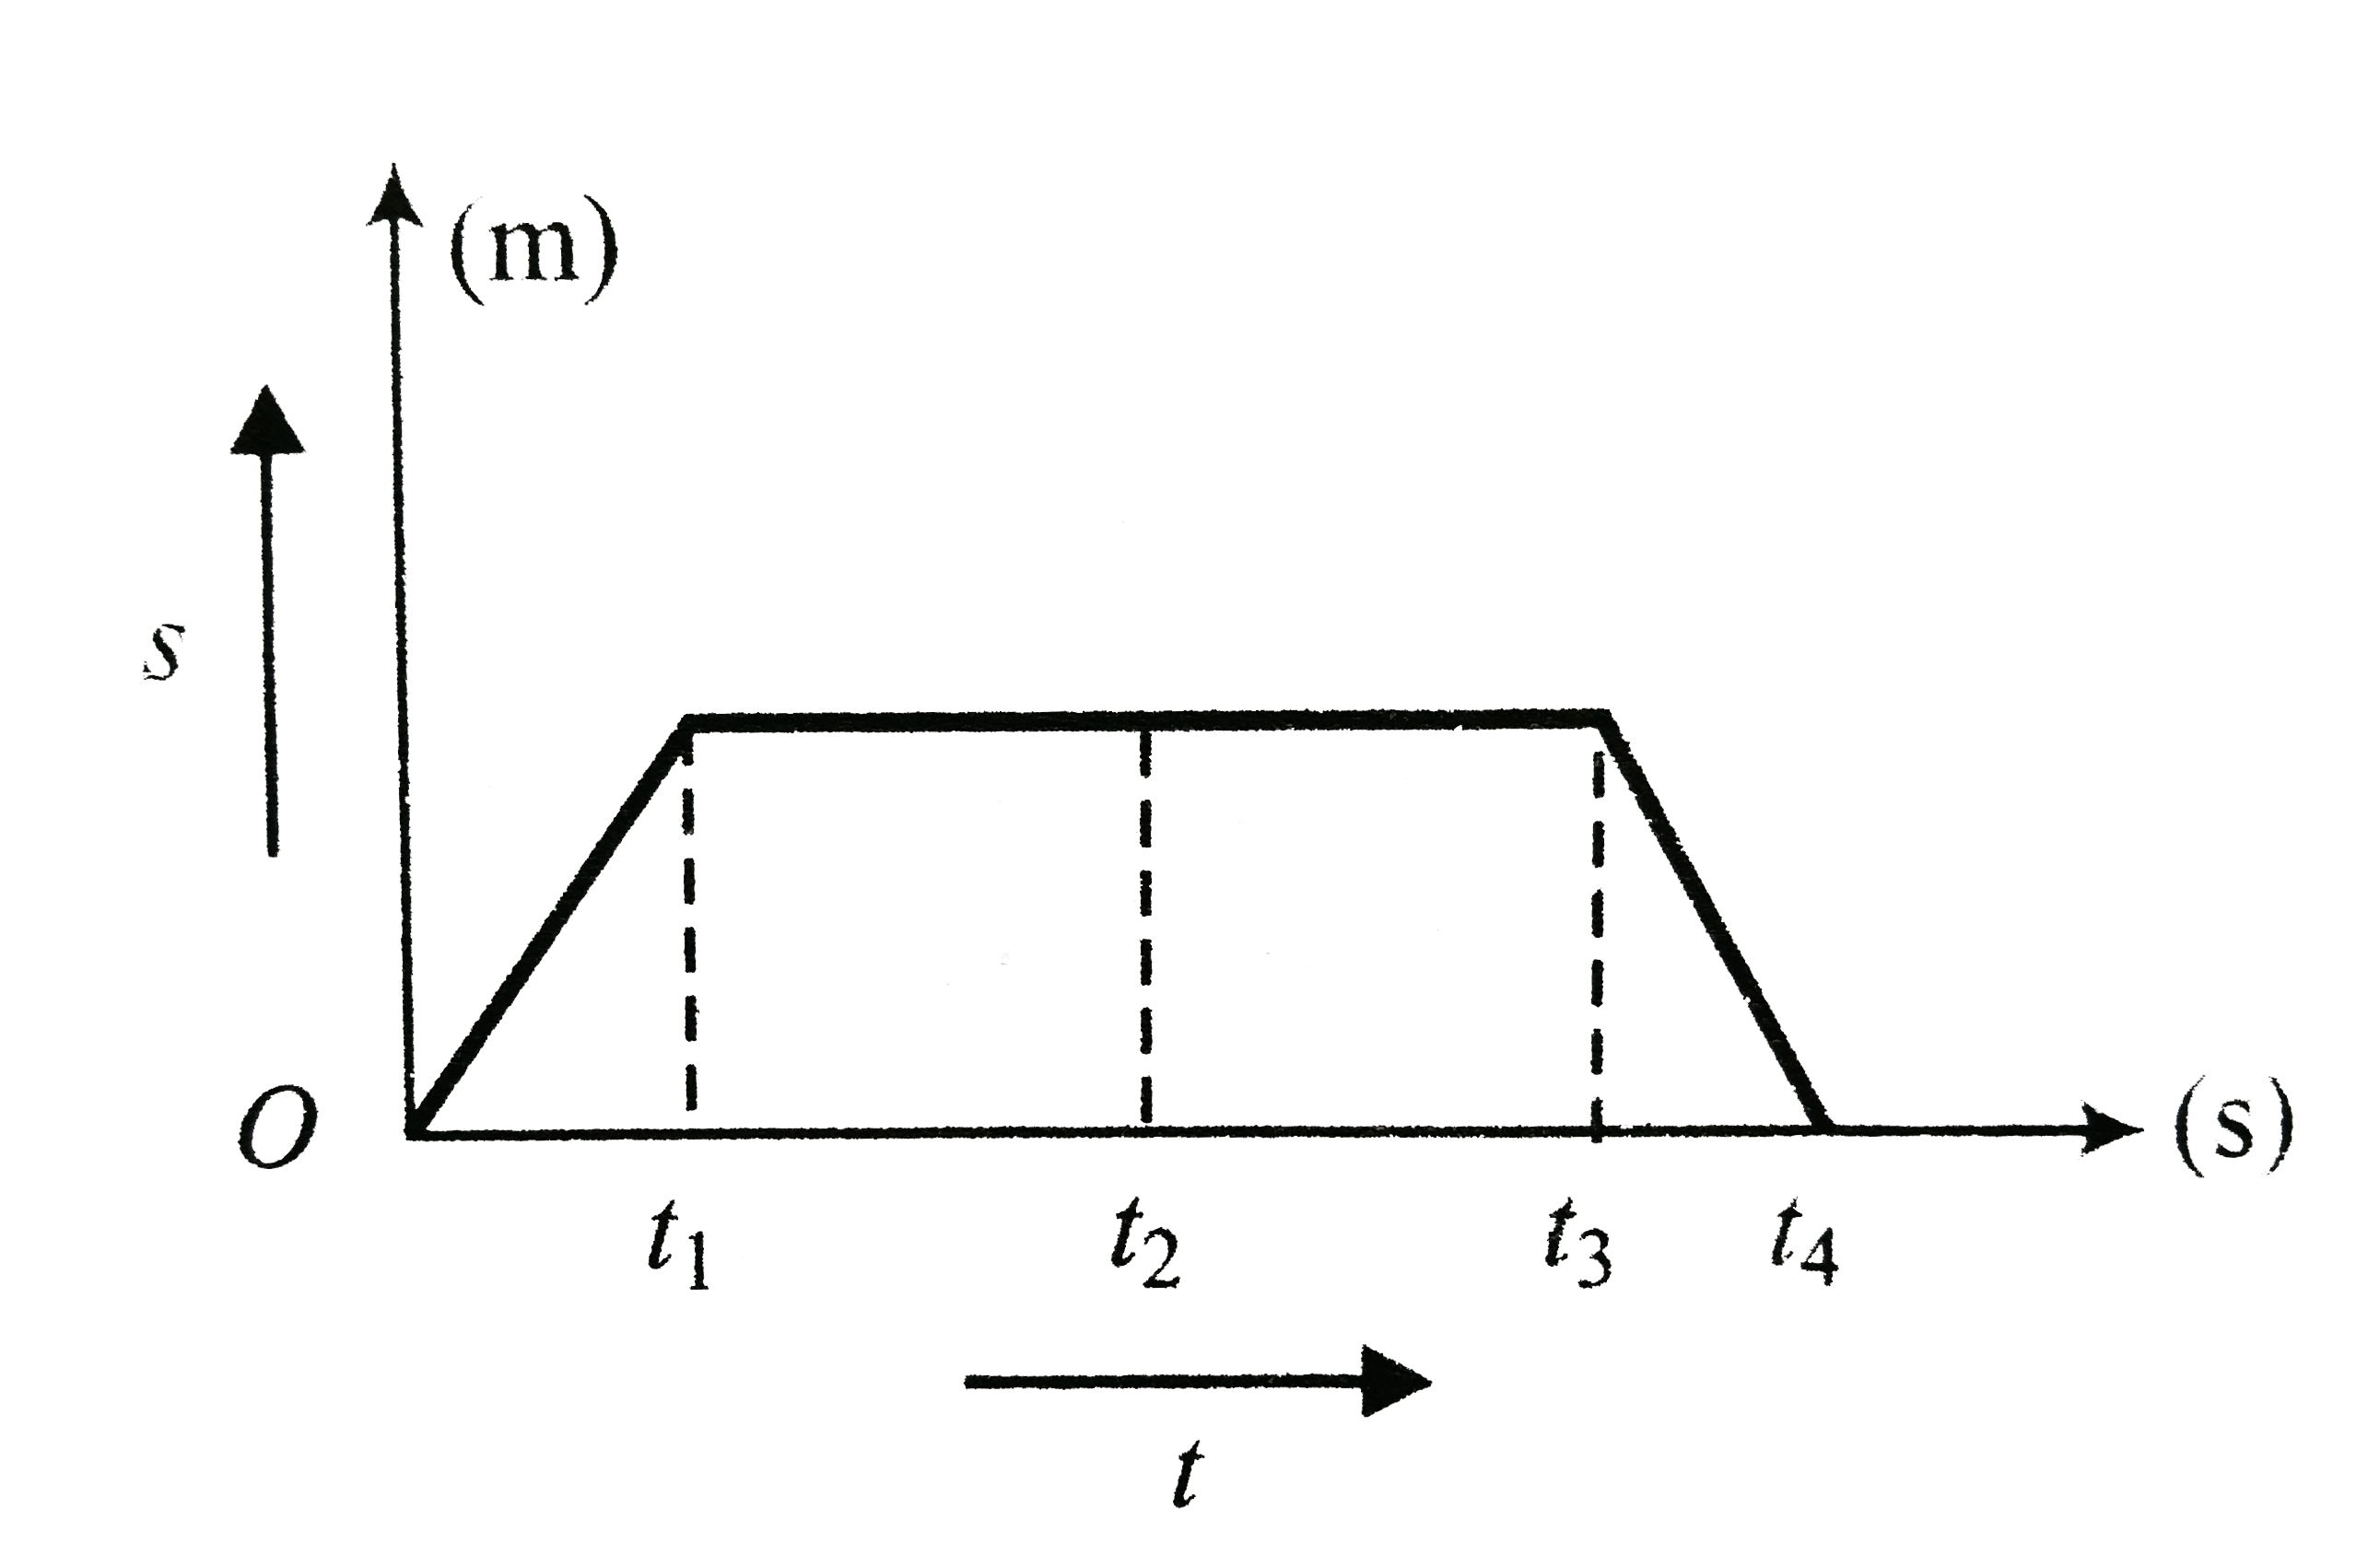 .
.
The velocity-time graph of the motion of the body will be .
View SolutionAn object thrown vertically. Thevelocity-time graph for the motion of the particle is .
View SolutionFrom a high tower, at time `t=0`, one stone is dropped from rest and simultaneously another stone is projected vertically up with an initial velocity .The graph of distance `S` between the two stones plotted against time `t` will be
View SolutionAn object is verically thrown upwards. The the dislacement-time graph for the motion is as shown in .
View SolutionThe graph as shown in. below descrines the motion of a ball rebounding from a horizontal surface being released from a point above the surface. Assume that the ball colledes each time with the floor inelastically. The quantity represented on the y-axis in the is the ball`s (take upward direction as positive)
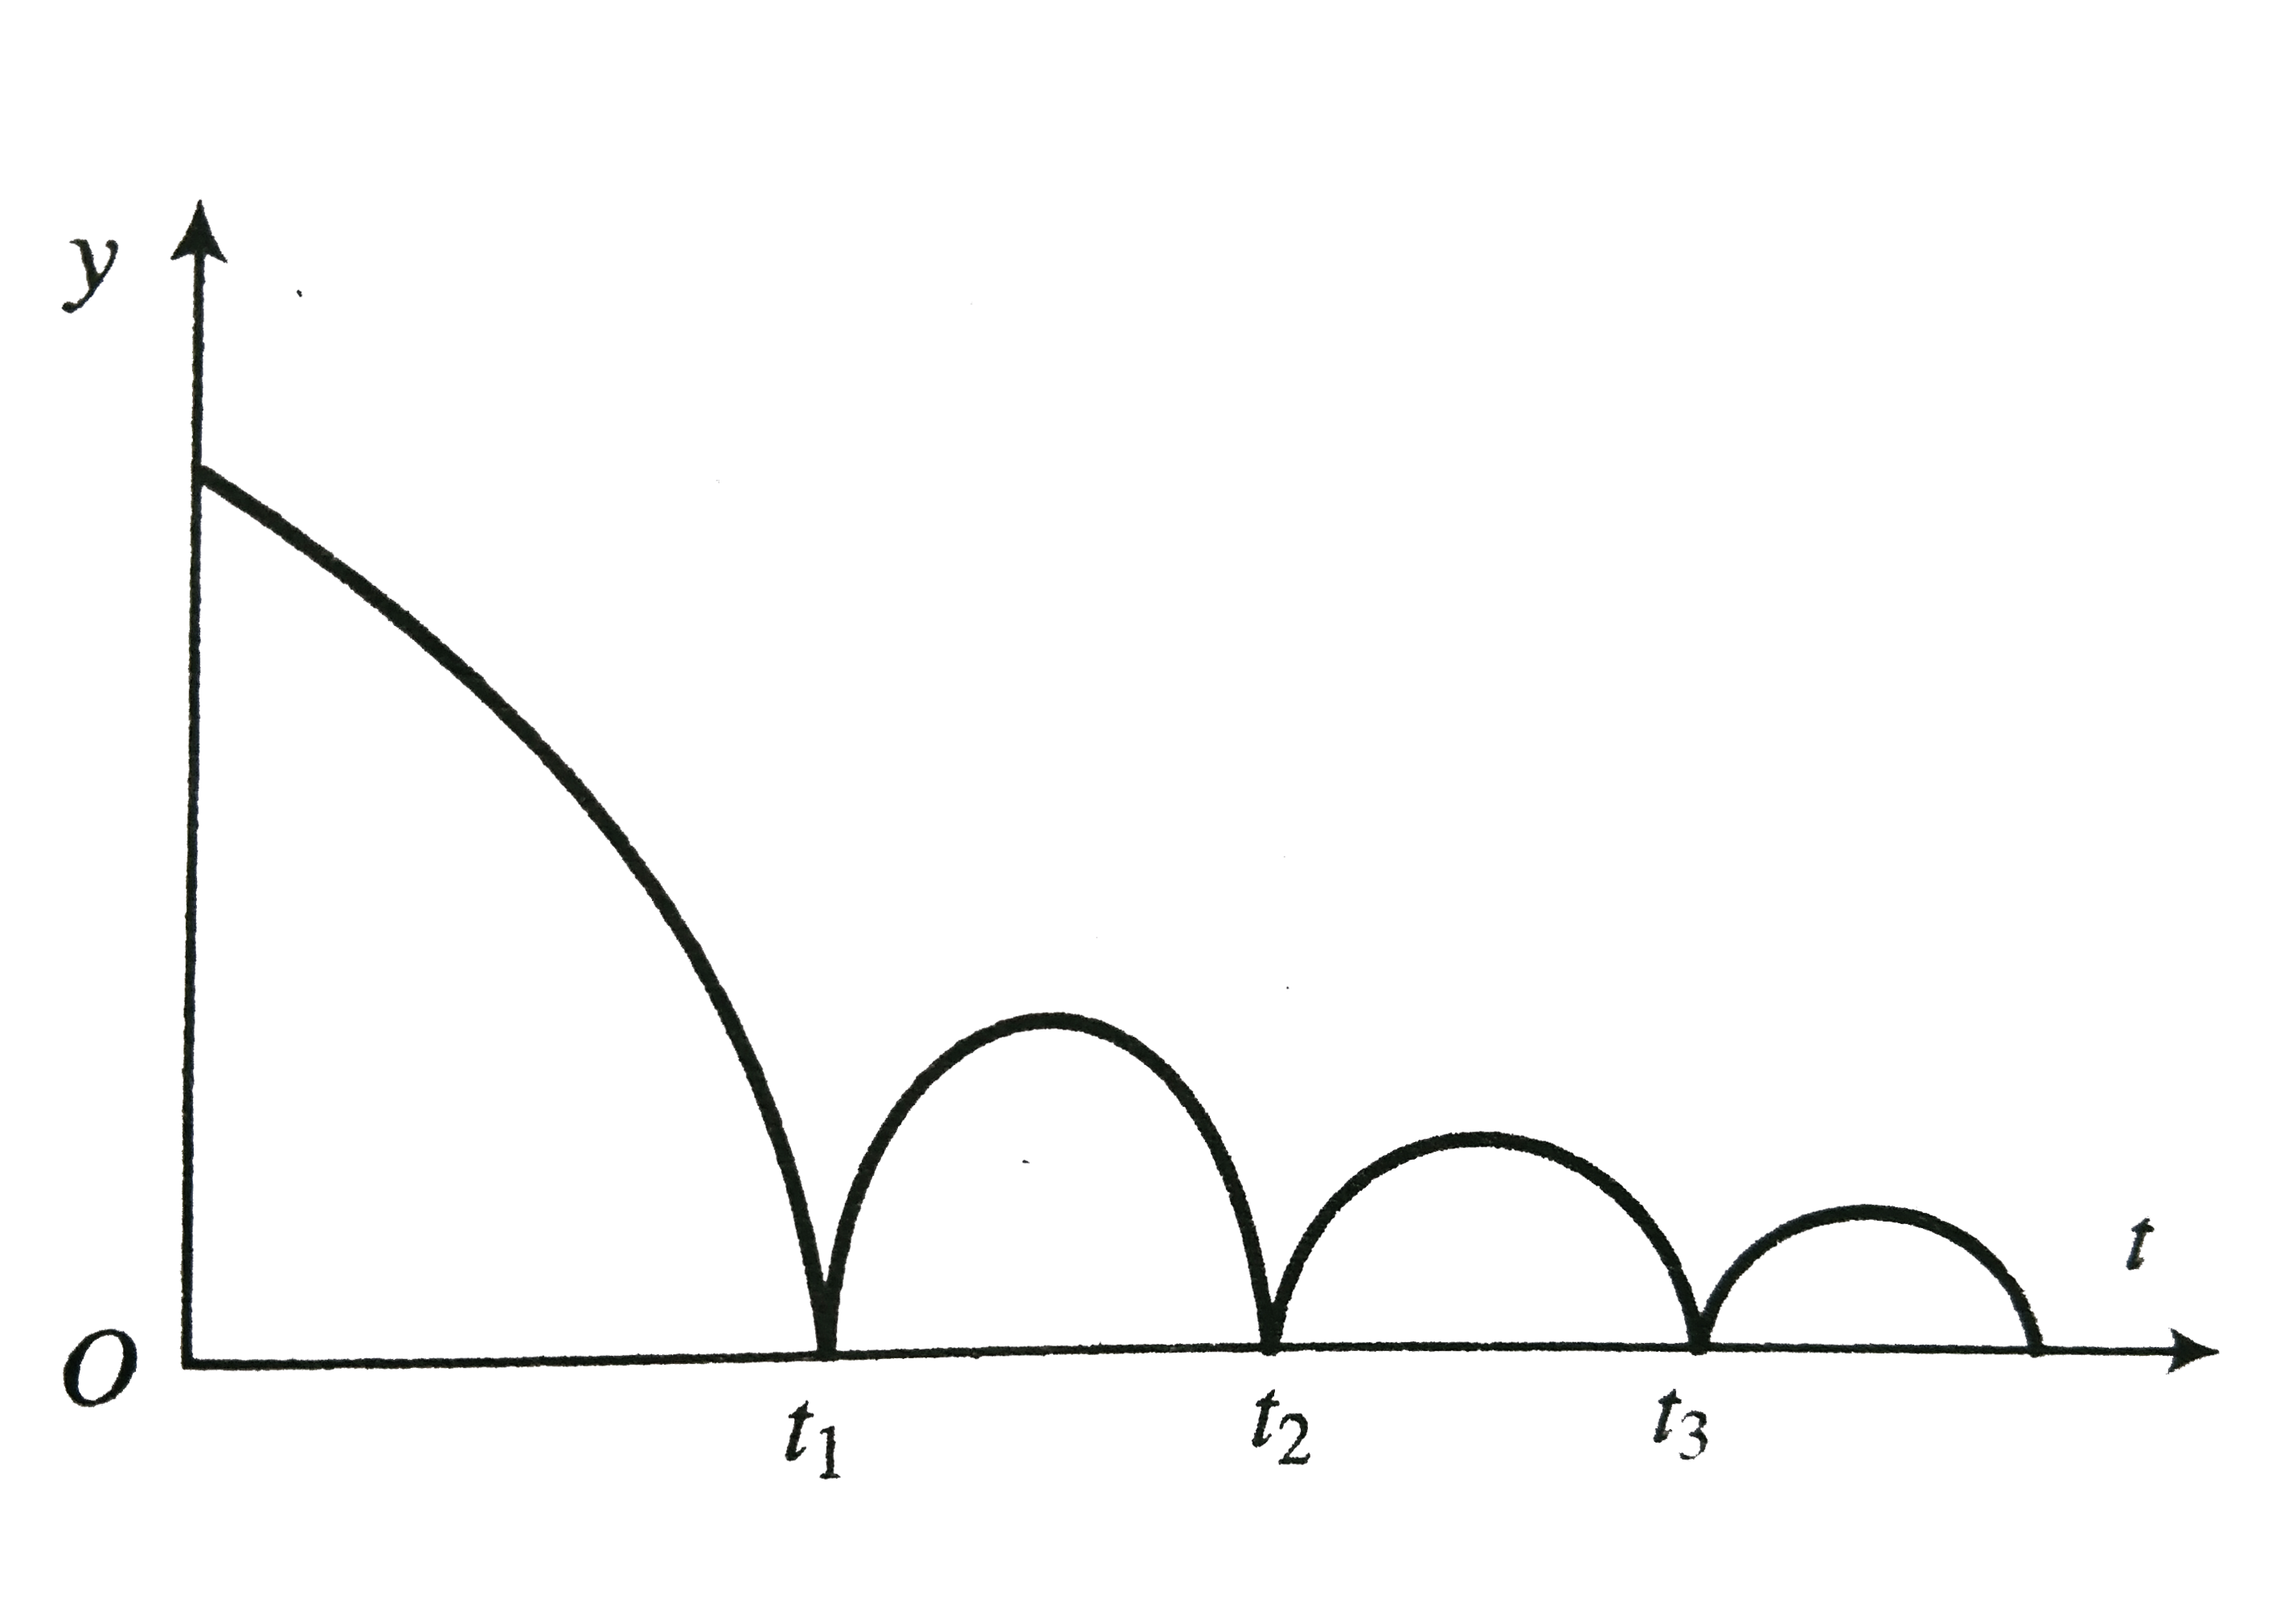 .
.
View SolutionThe acceleration versus time graph of a particle is shown in the figure. The respective `v-t` graph of the particle is .
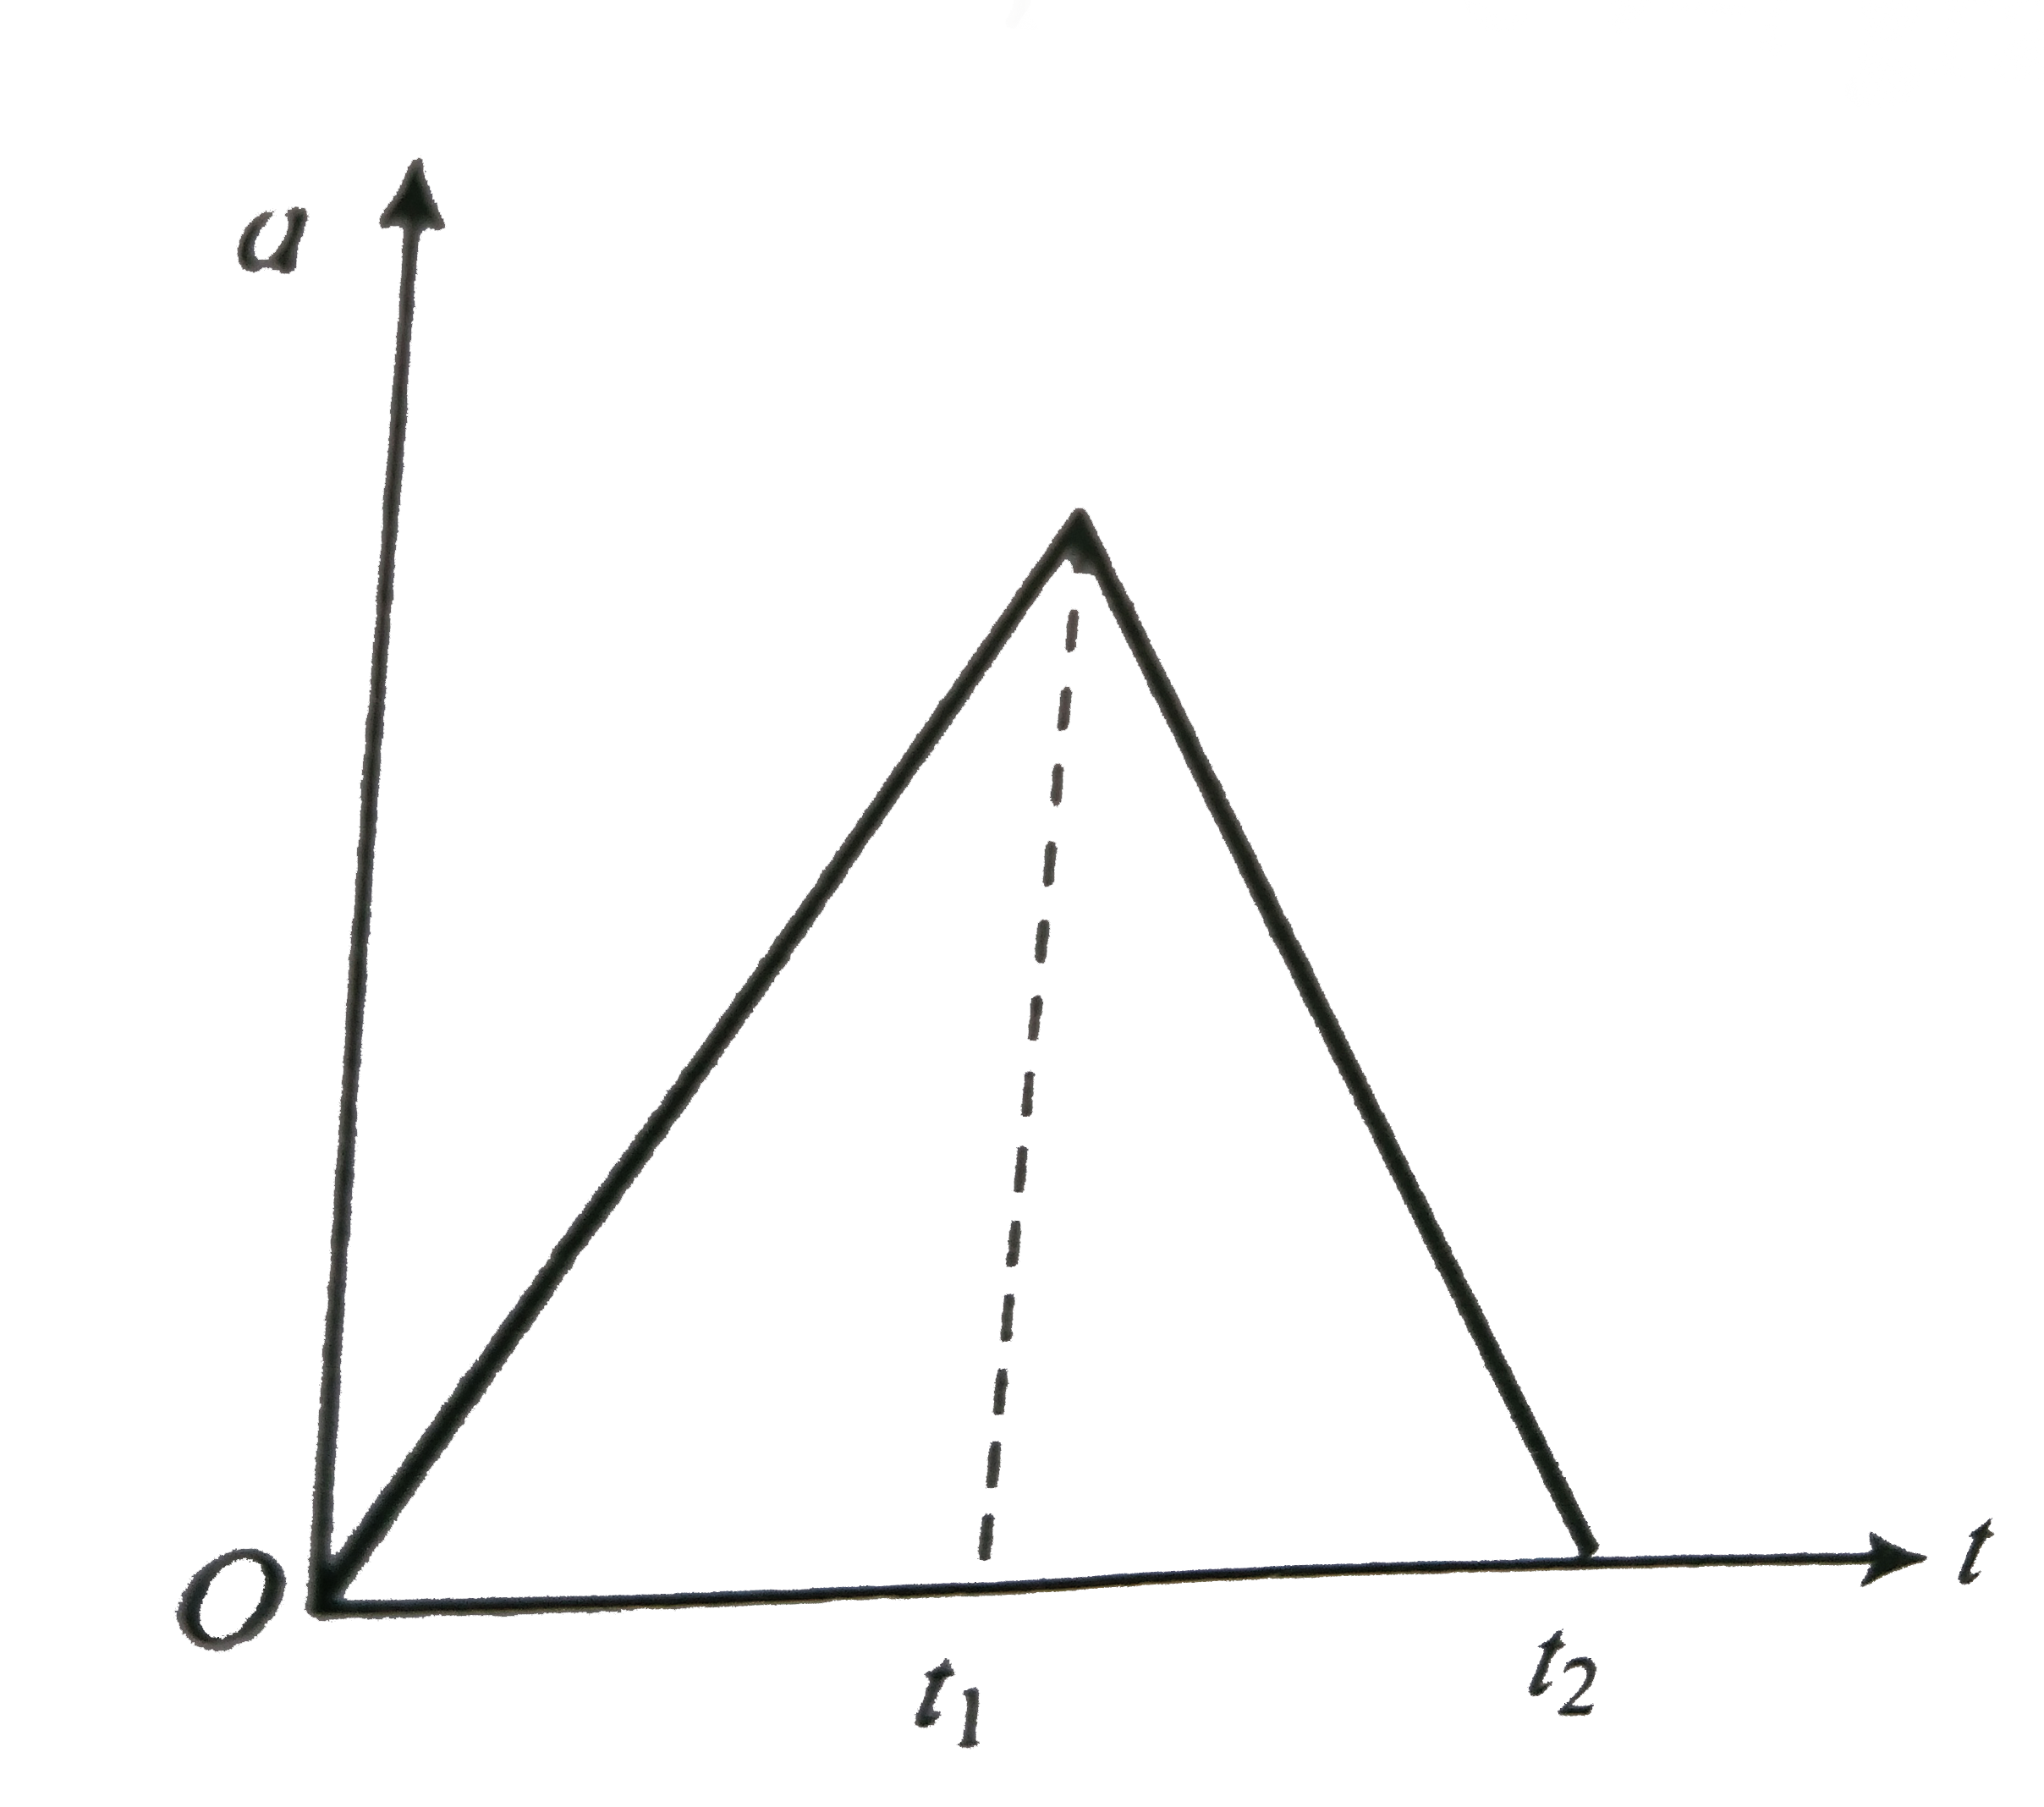 .
.
View SolutionThe displacement-time graph of a moving particle with constant acceleration is shown in. The velocity-time is given by
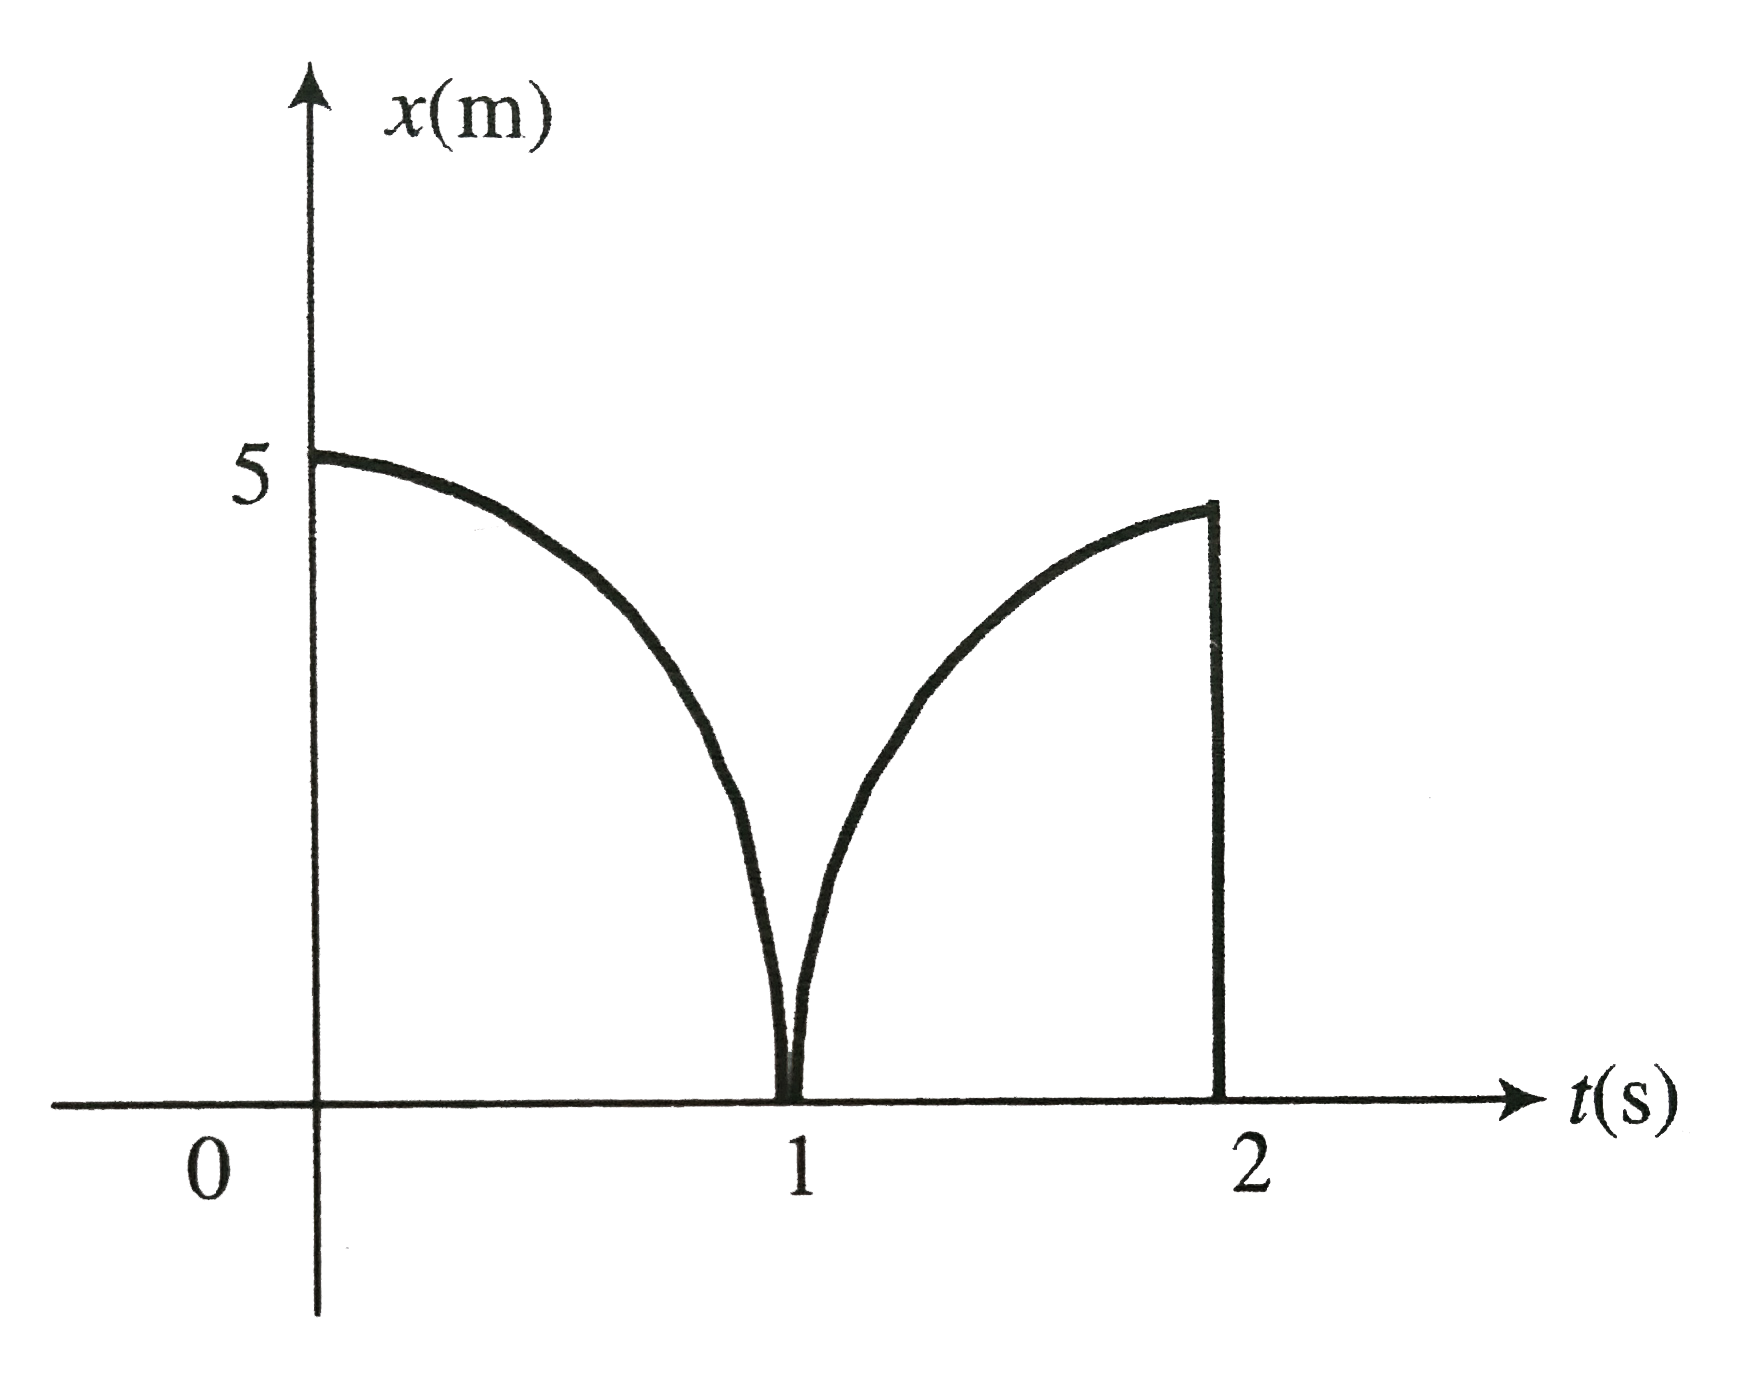 .
.
View SolutionTwo balls are dropped from the top of a hight tower with a time interval of `t_(0)`. Second , where `t_(0)` is smaller than the time taken by the first ball to reach the ground which is perfectly inelastic. The distance `S` between the two balls plotted against the time lapse `t` from the instant of dropping the second ball, is best tepresented by.
View SolutionThe acceleration versus time graph of a particle moving in a straight line is show in figure. The velocity-time graph of the particle would be
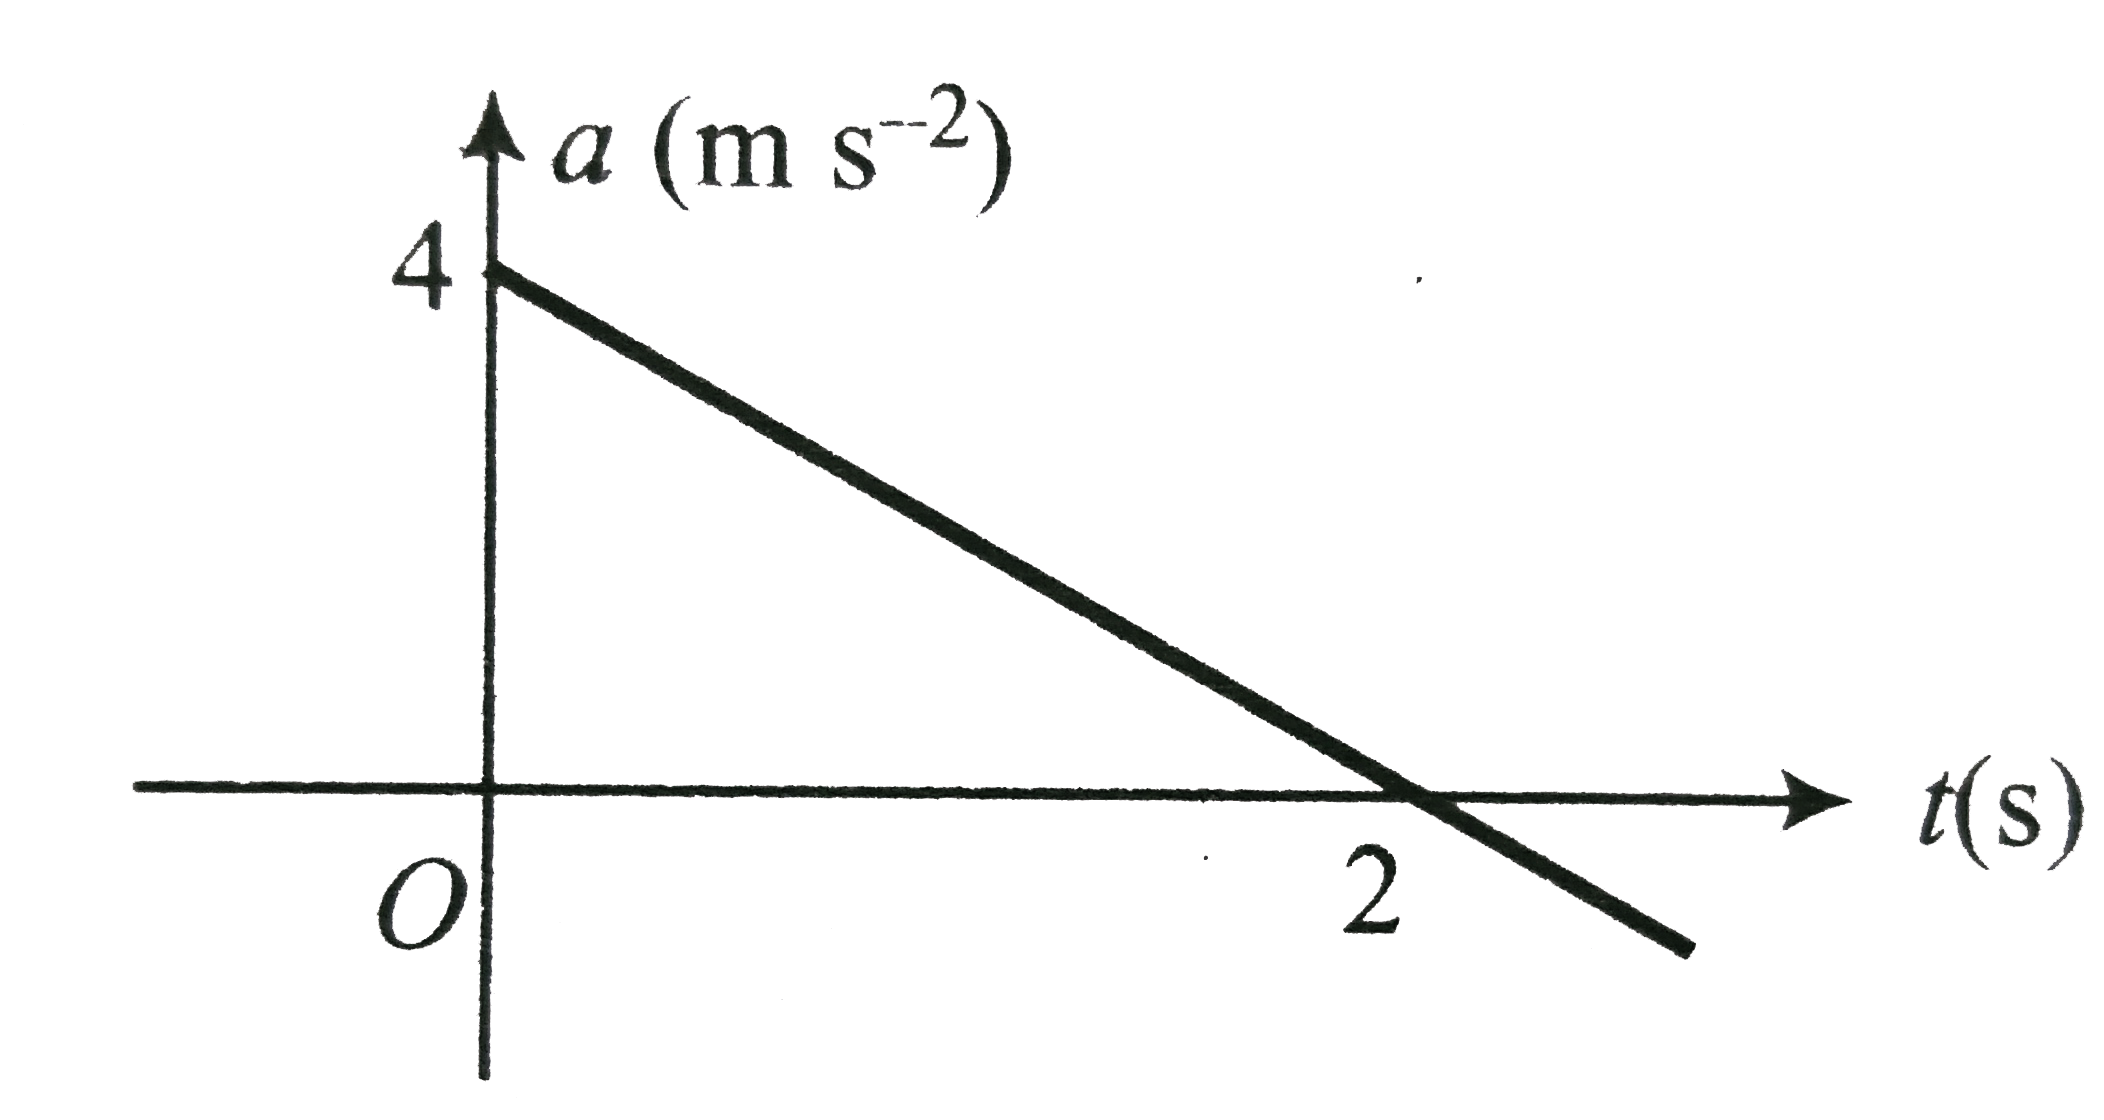 .
.
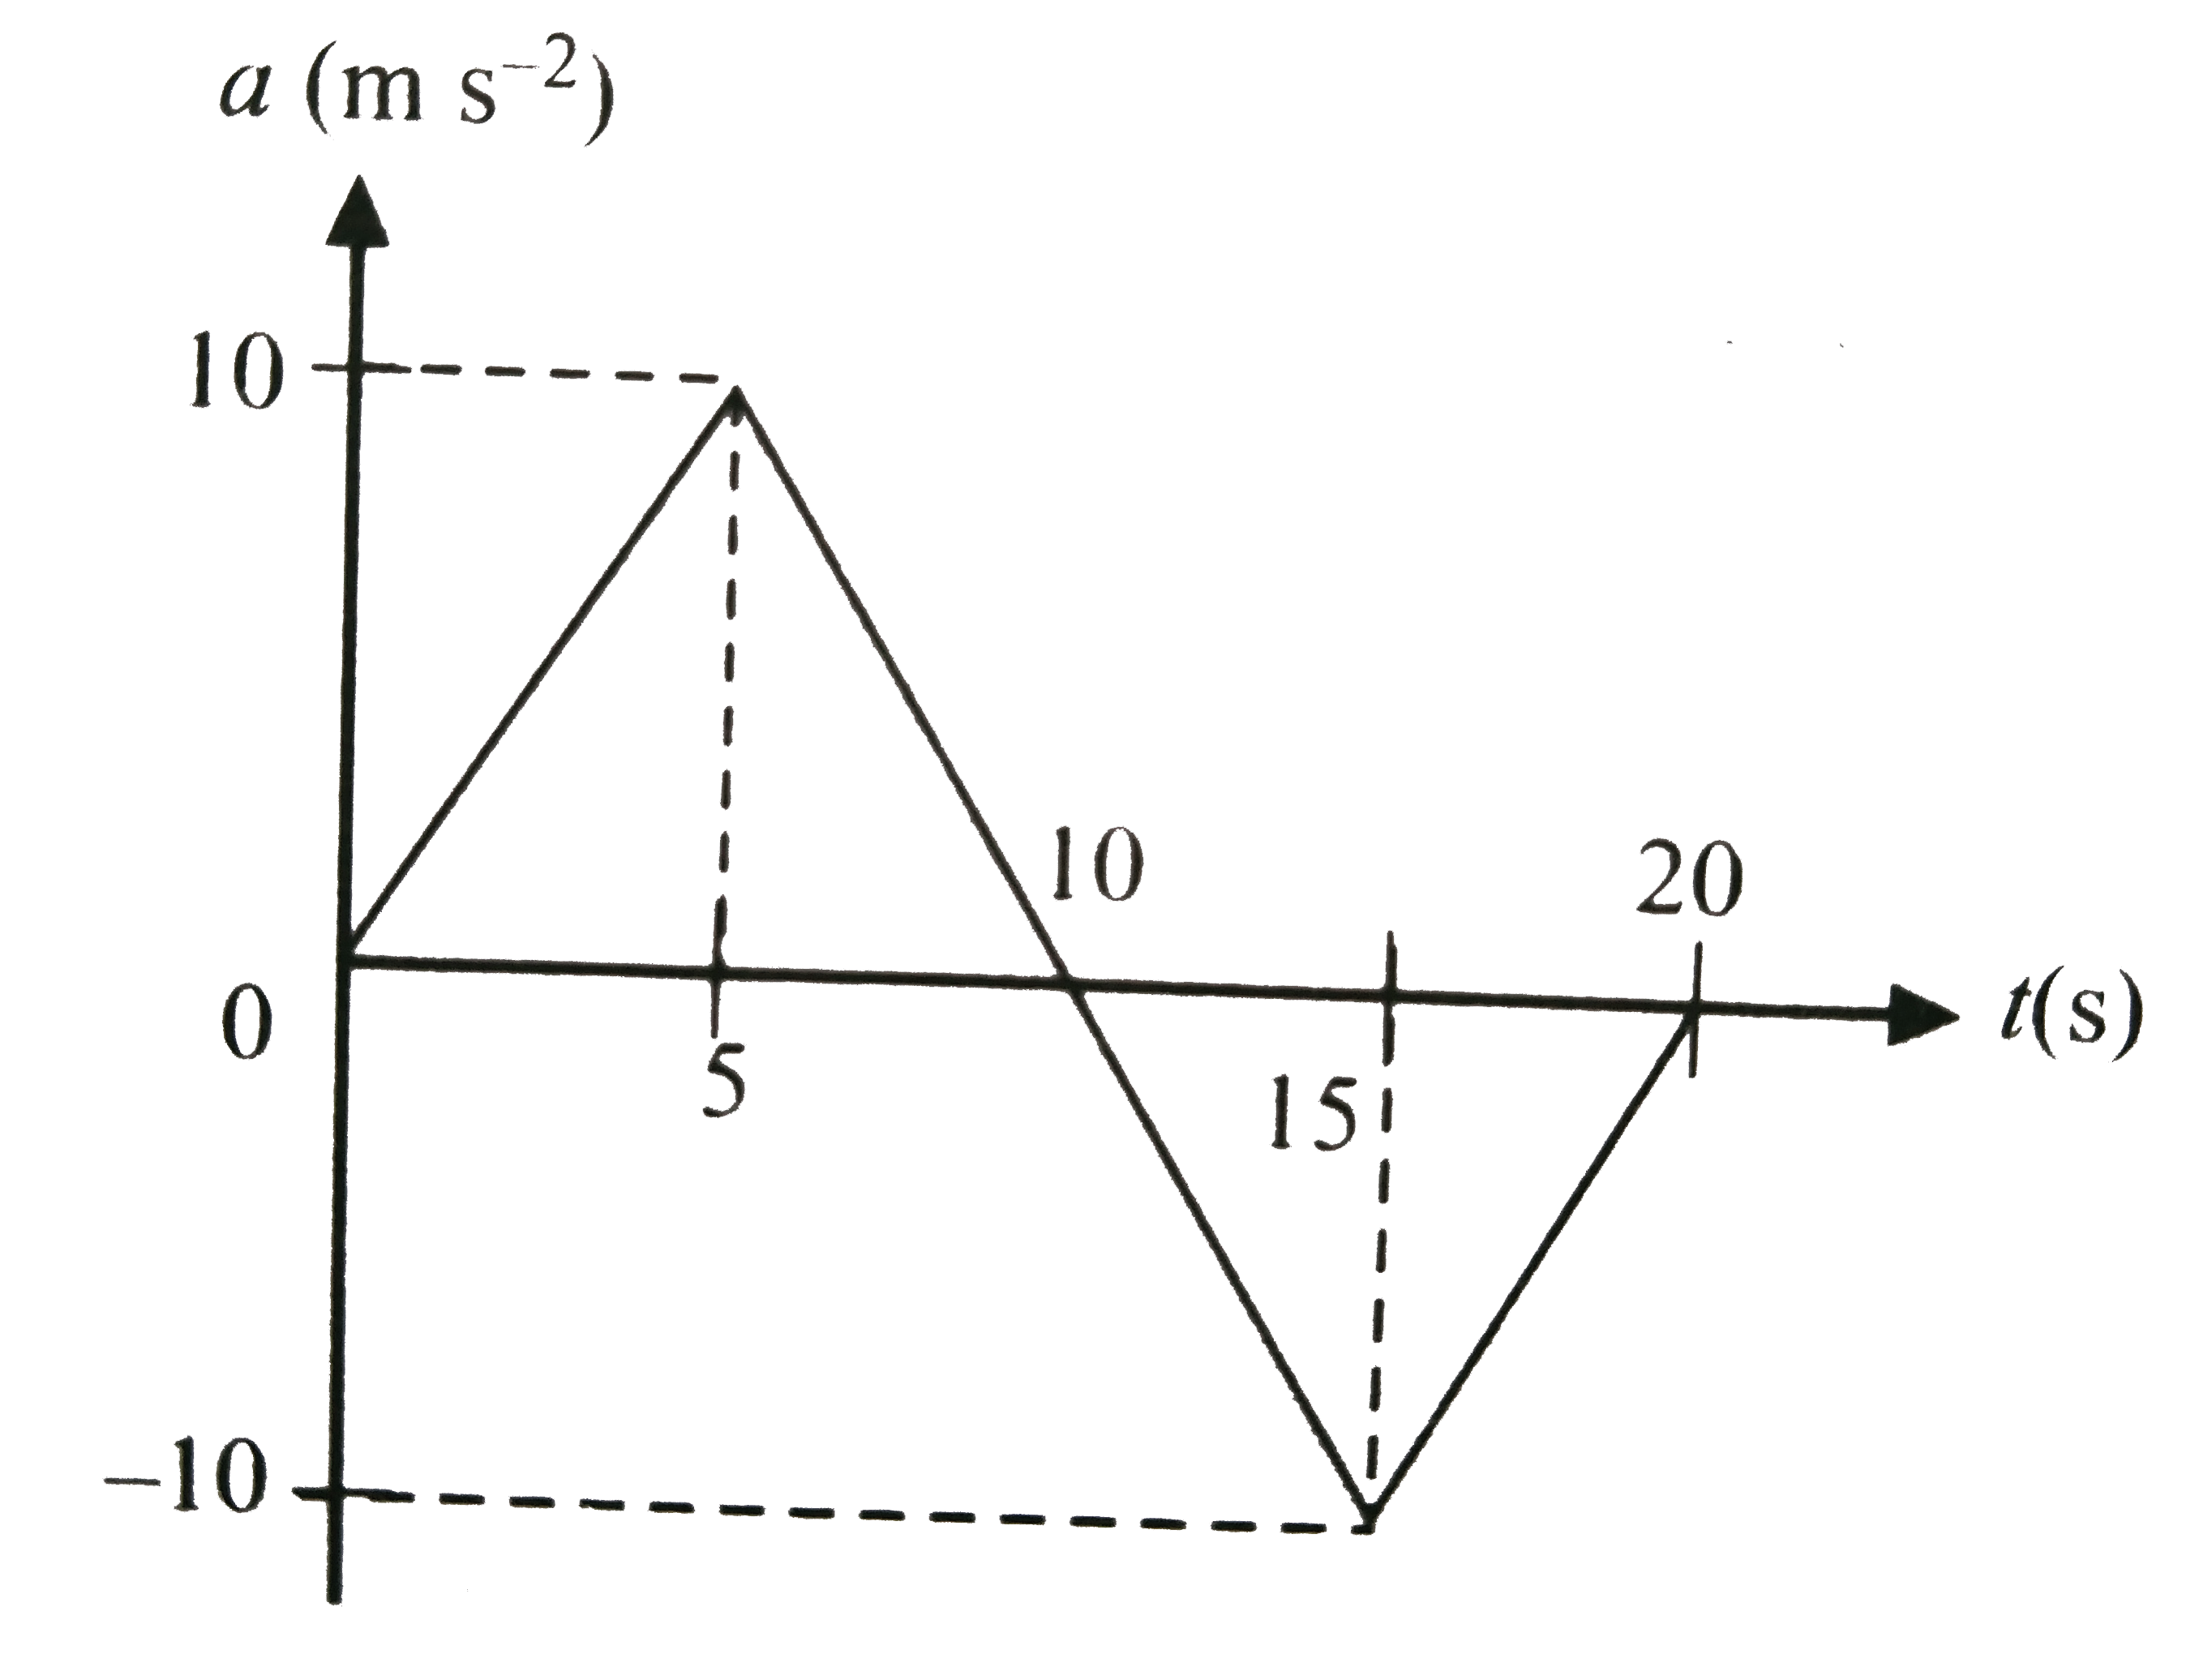
View SolutionThe acceleration-time graph of a particle moving along a straight line is as shown in. At what time the particle acquires its initial velocity?
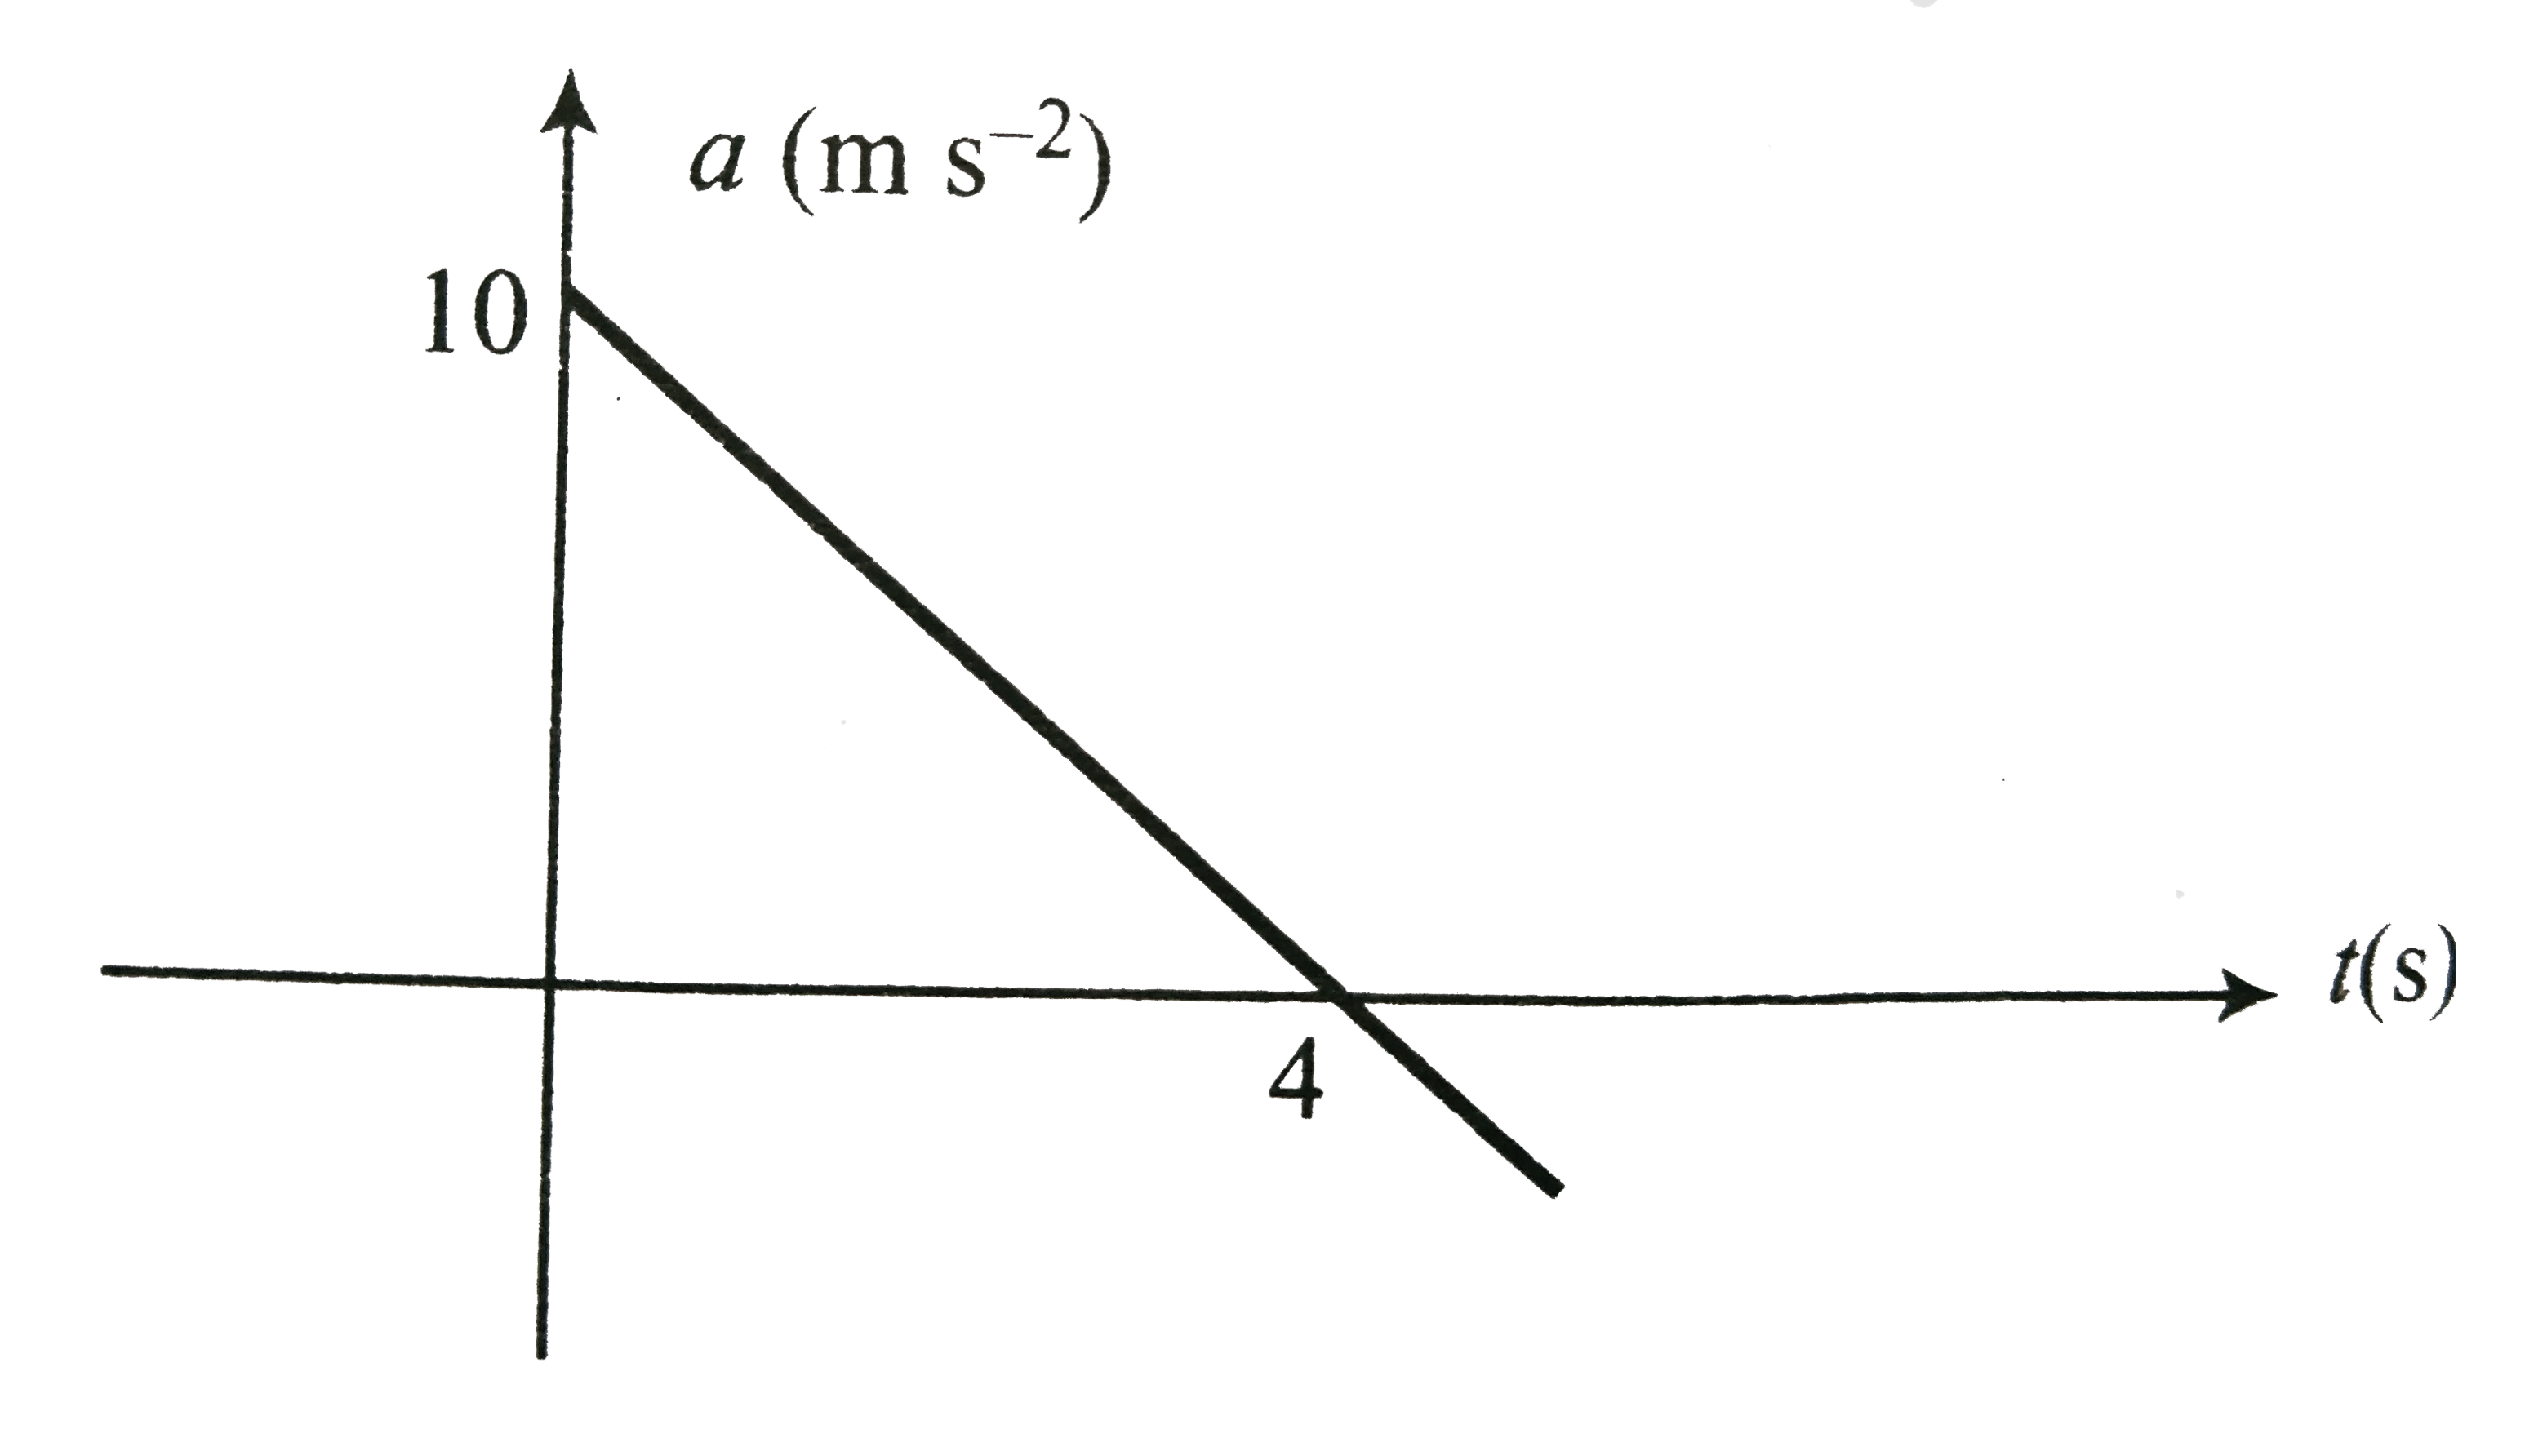 .
.
View SolutionPlot the acceleration-time graph of the welocity-time graph given in.
 .
.
View Solution
Graphical Concept questions and complete solutions for chapter KINEMATICS-1 of CENGAGE PHYSICS (HINGLISH) of Class 11