Complete Solutions to EXAMPLE of chapter DIAGRAMMATIC REPRESENTATION OF DATA of Class 11 book with complete answers and questions
| Class 11 | MATHS |
| Chapter | DIAGRAMMATIC REPRESENTATION OF DATA |
| CHHAYA PRAKASHINI | EXAMPLE |
| Number Of Questions | 11 |
| Academic Year | 2023-24 |
Represent the number of students in differents classes of a collage by bar diagram:
No. of students in Ist year class-600, no. of students in 2nd year class-540, no. of students in 3rd year class-325.
View SolutionAn urn contains 10 red and 8 white balls. One ball is drawn at random. Find the probability that the ball drawn is white.
View SolutionRepresent the number of inhabitains in five cities of a country by bar chart (horizontal bar diagram):

View SolutionA data of estimated income and expenditure of Government of India during 1955-61, is given below:

Represent the above information of data by grouped bar chart.
View SolutionThe number of students in university during 1995-98 is given below:

Represent the information cotained in the above table by component bar chart.
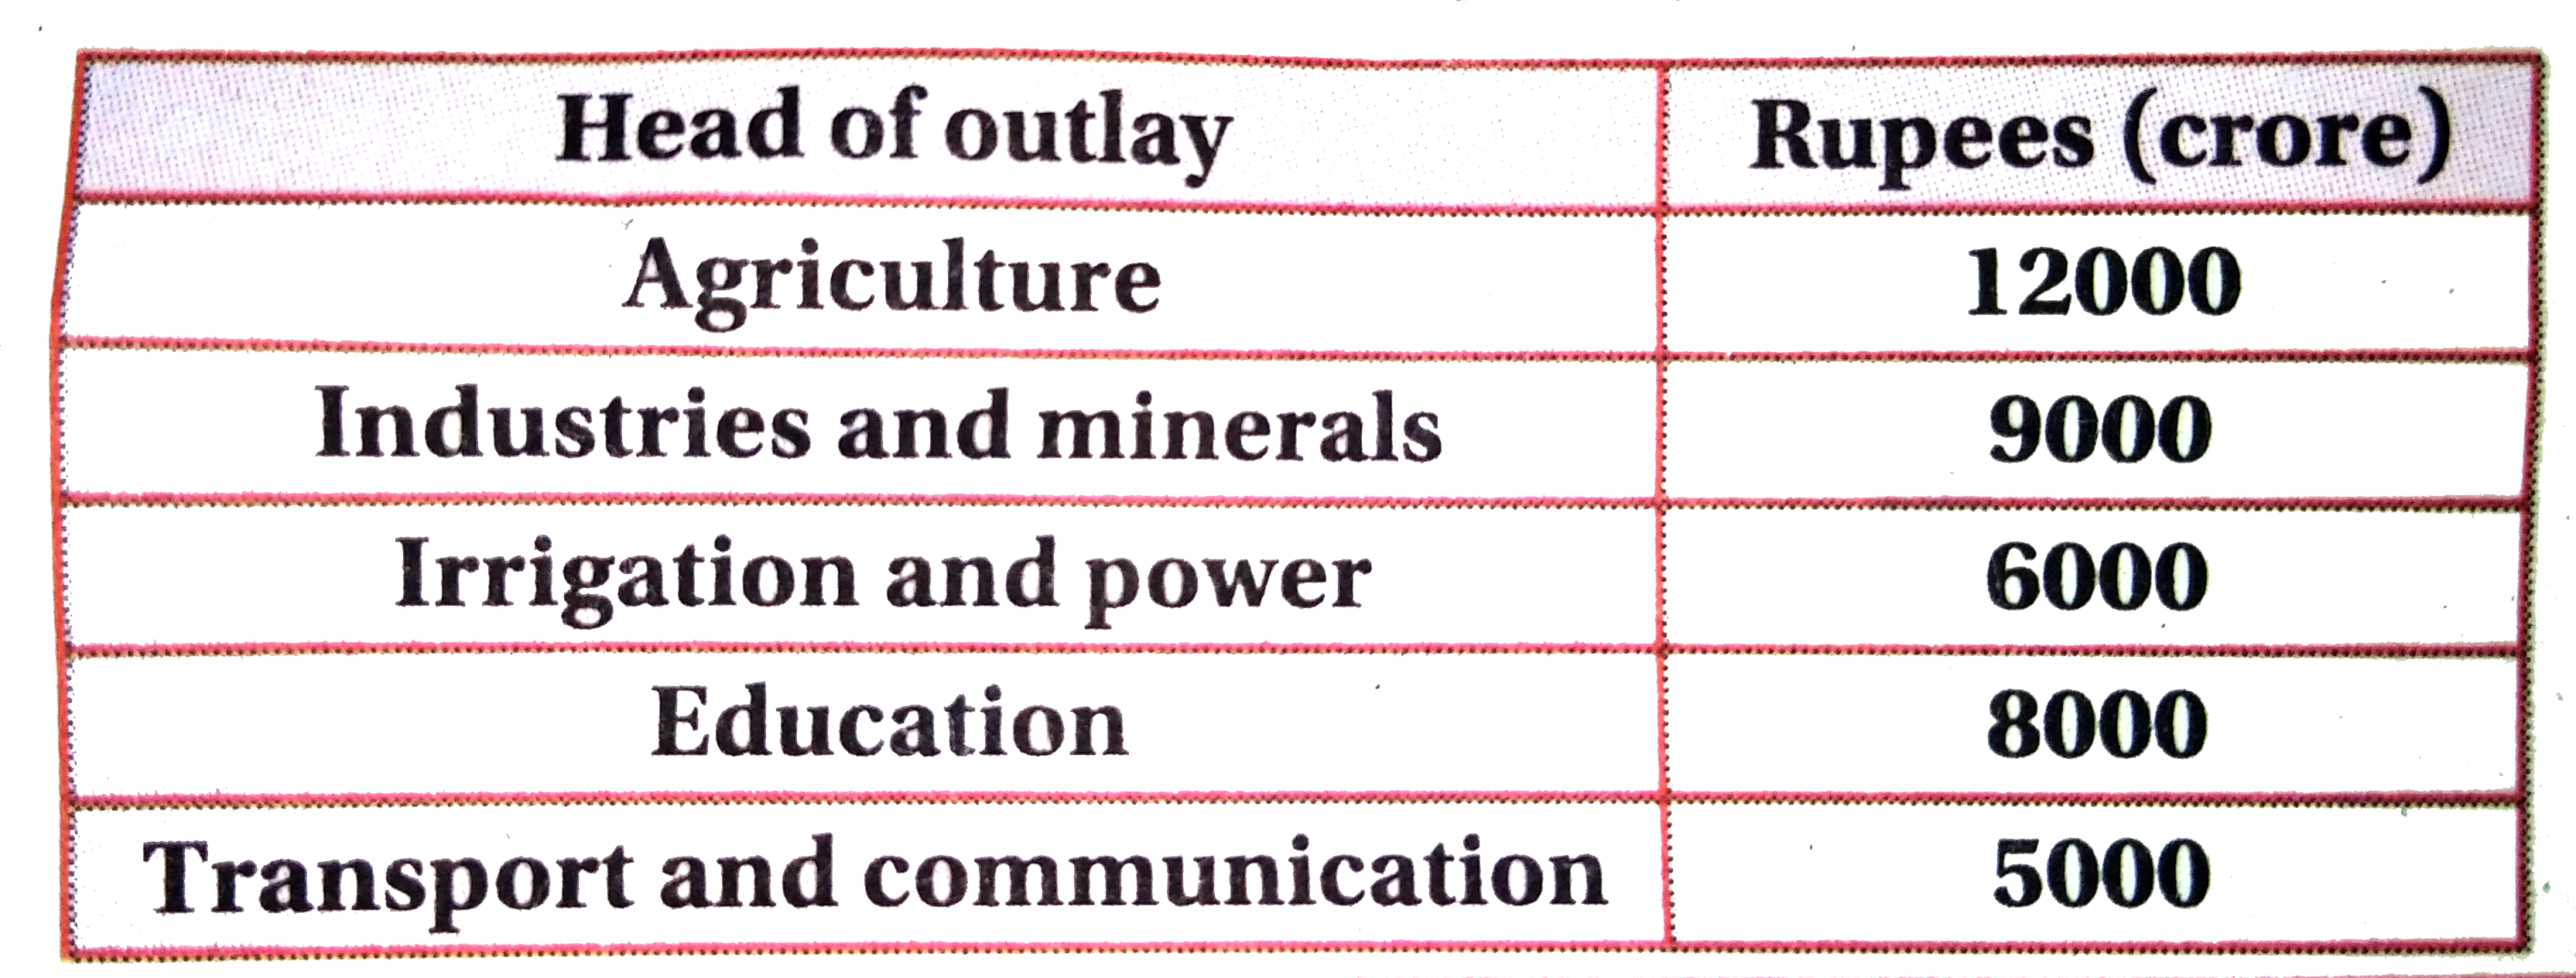
View SolutionRepresent the following data by a pie chart on proposed outlay during a Five-year plan of a Government:

View SolutionDraw a histogram of the following frequency distribution:
Frequency distribution of weights of 2000 students

View SolutionDraw a histogram of the following frequency distribution and hence find the no. of workers between the ages 19-32:

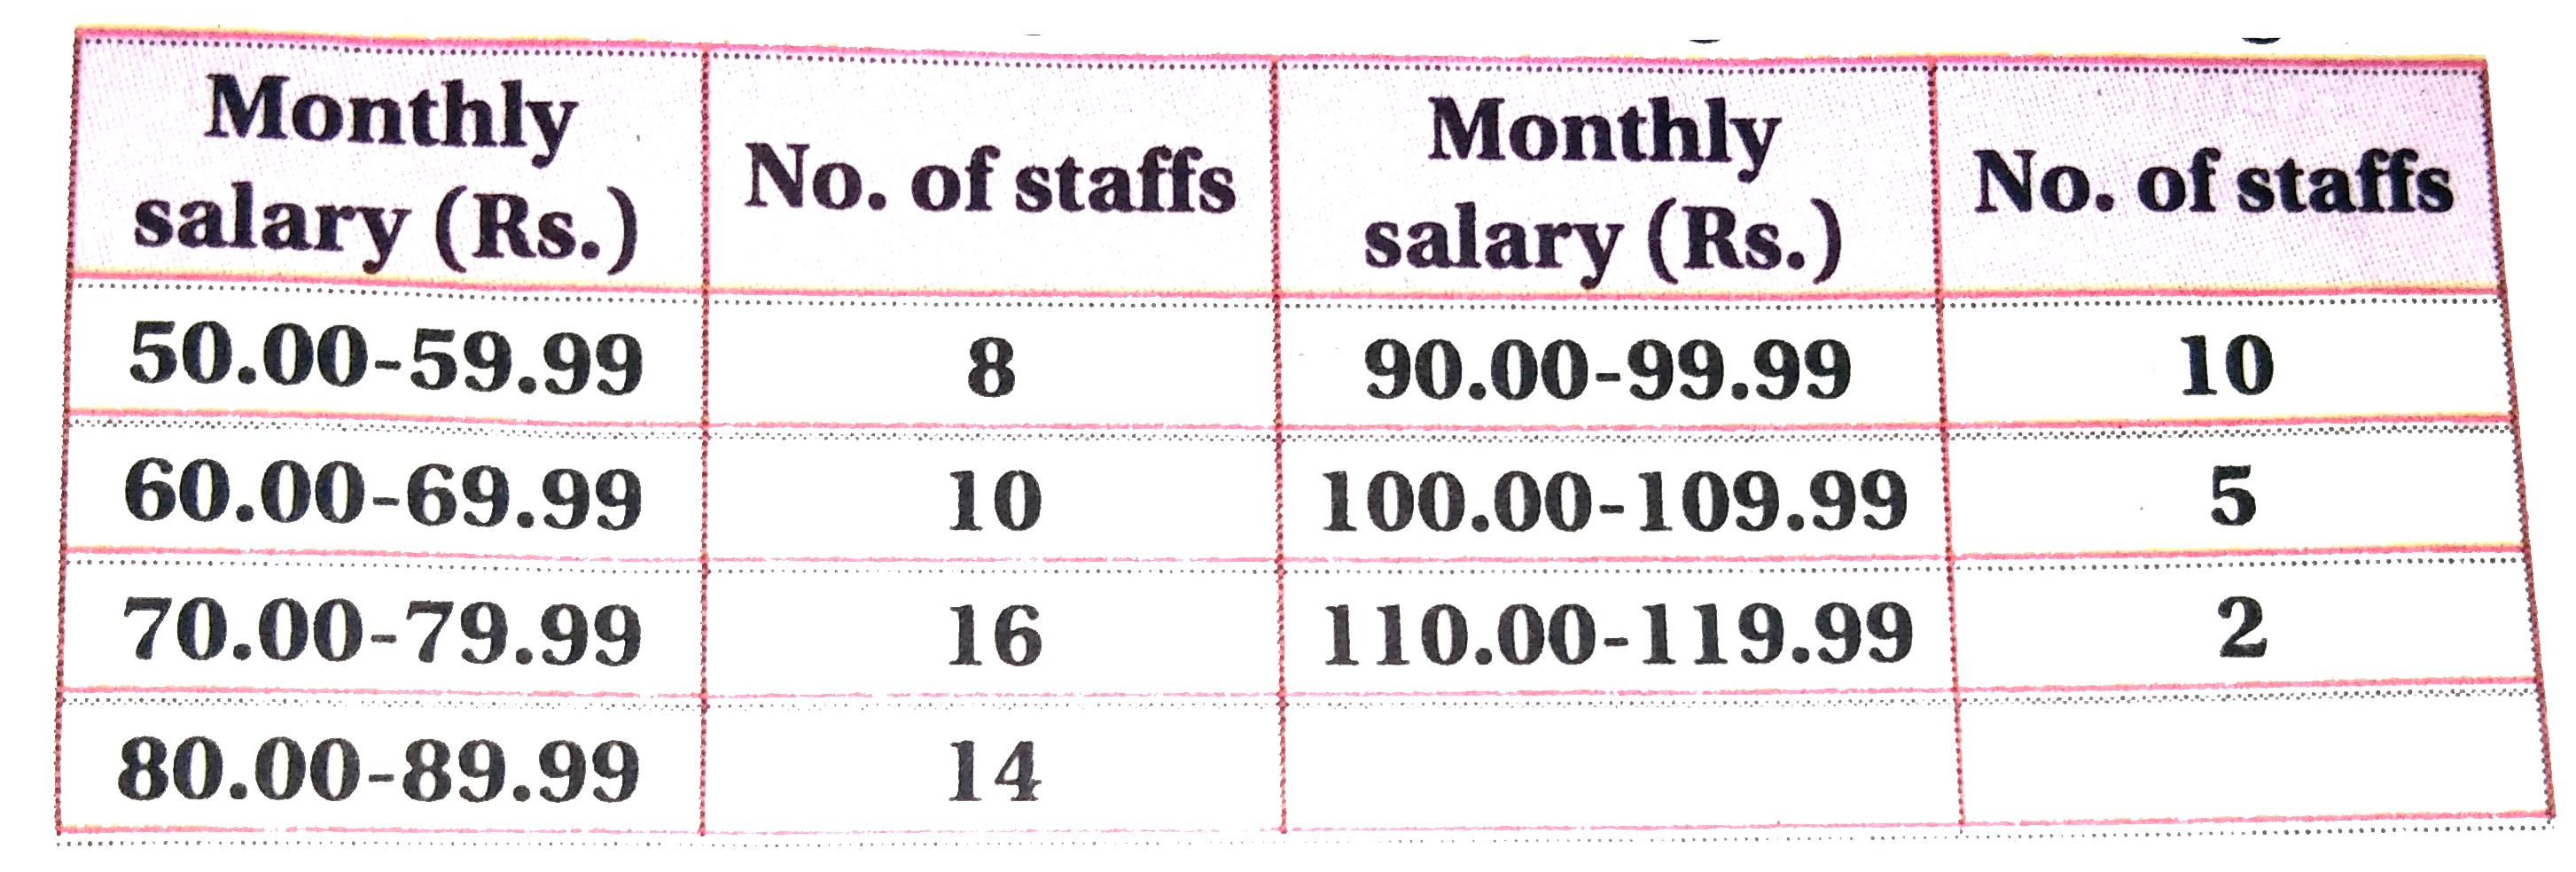
View SolutionGiven below is the frequency distribution showing showing no. of members in each following:

View SolutionDraw a frequency polygon representing the following data:

View SolutionDraw ogive (both ''less than'' and more than '' types) for the following distribution:

View Solution
EXAMPLE questions and complete solutions for chapter DIAGRAMMATIC REPRESENTATION OF DATA of CHHAYA MATHS (BENGALI ENGLISH) of Class 11