Complete Solutions to EXERCISE (Very short Answer Type Question) of chapter DIAGRAMMATIC REPRESENTATION OF DATA of Class 11 book with complete answers and questions
| Class 11 | MATHS |
| Chapter | DIAGRAMMATIC REPRESENTATION OF DATA |
| CHHAYA PRAKASHINI | EXERCISE (Very short Answer Type Question) |
| Number Of Questions | 7 |
| Academic Year | 2023-24 |
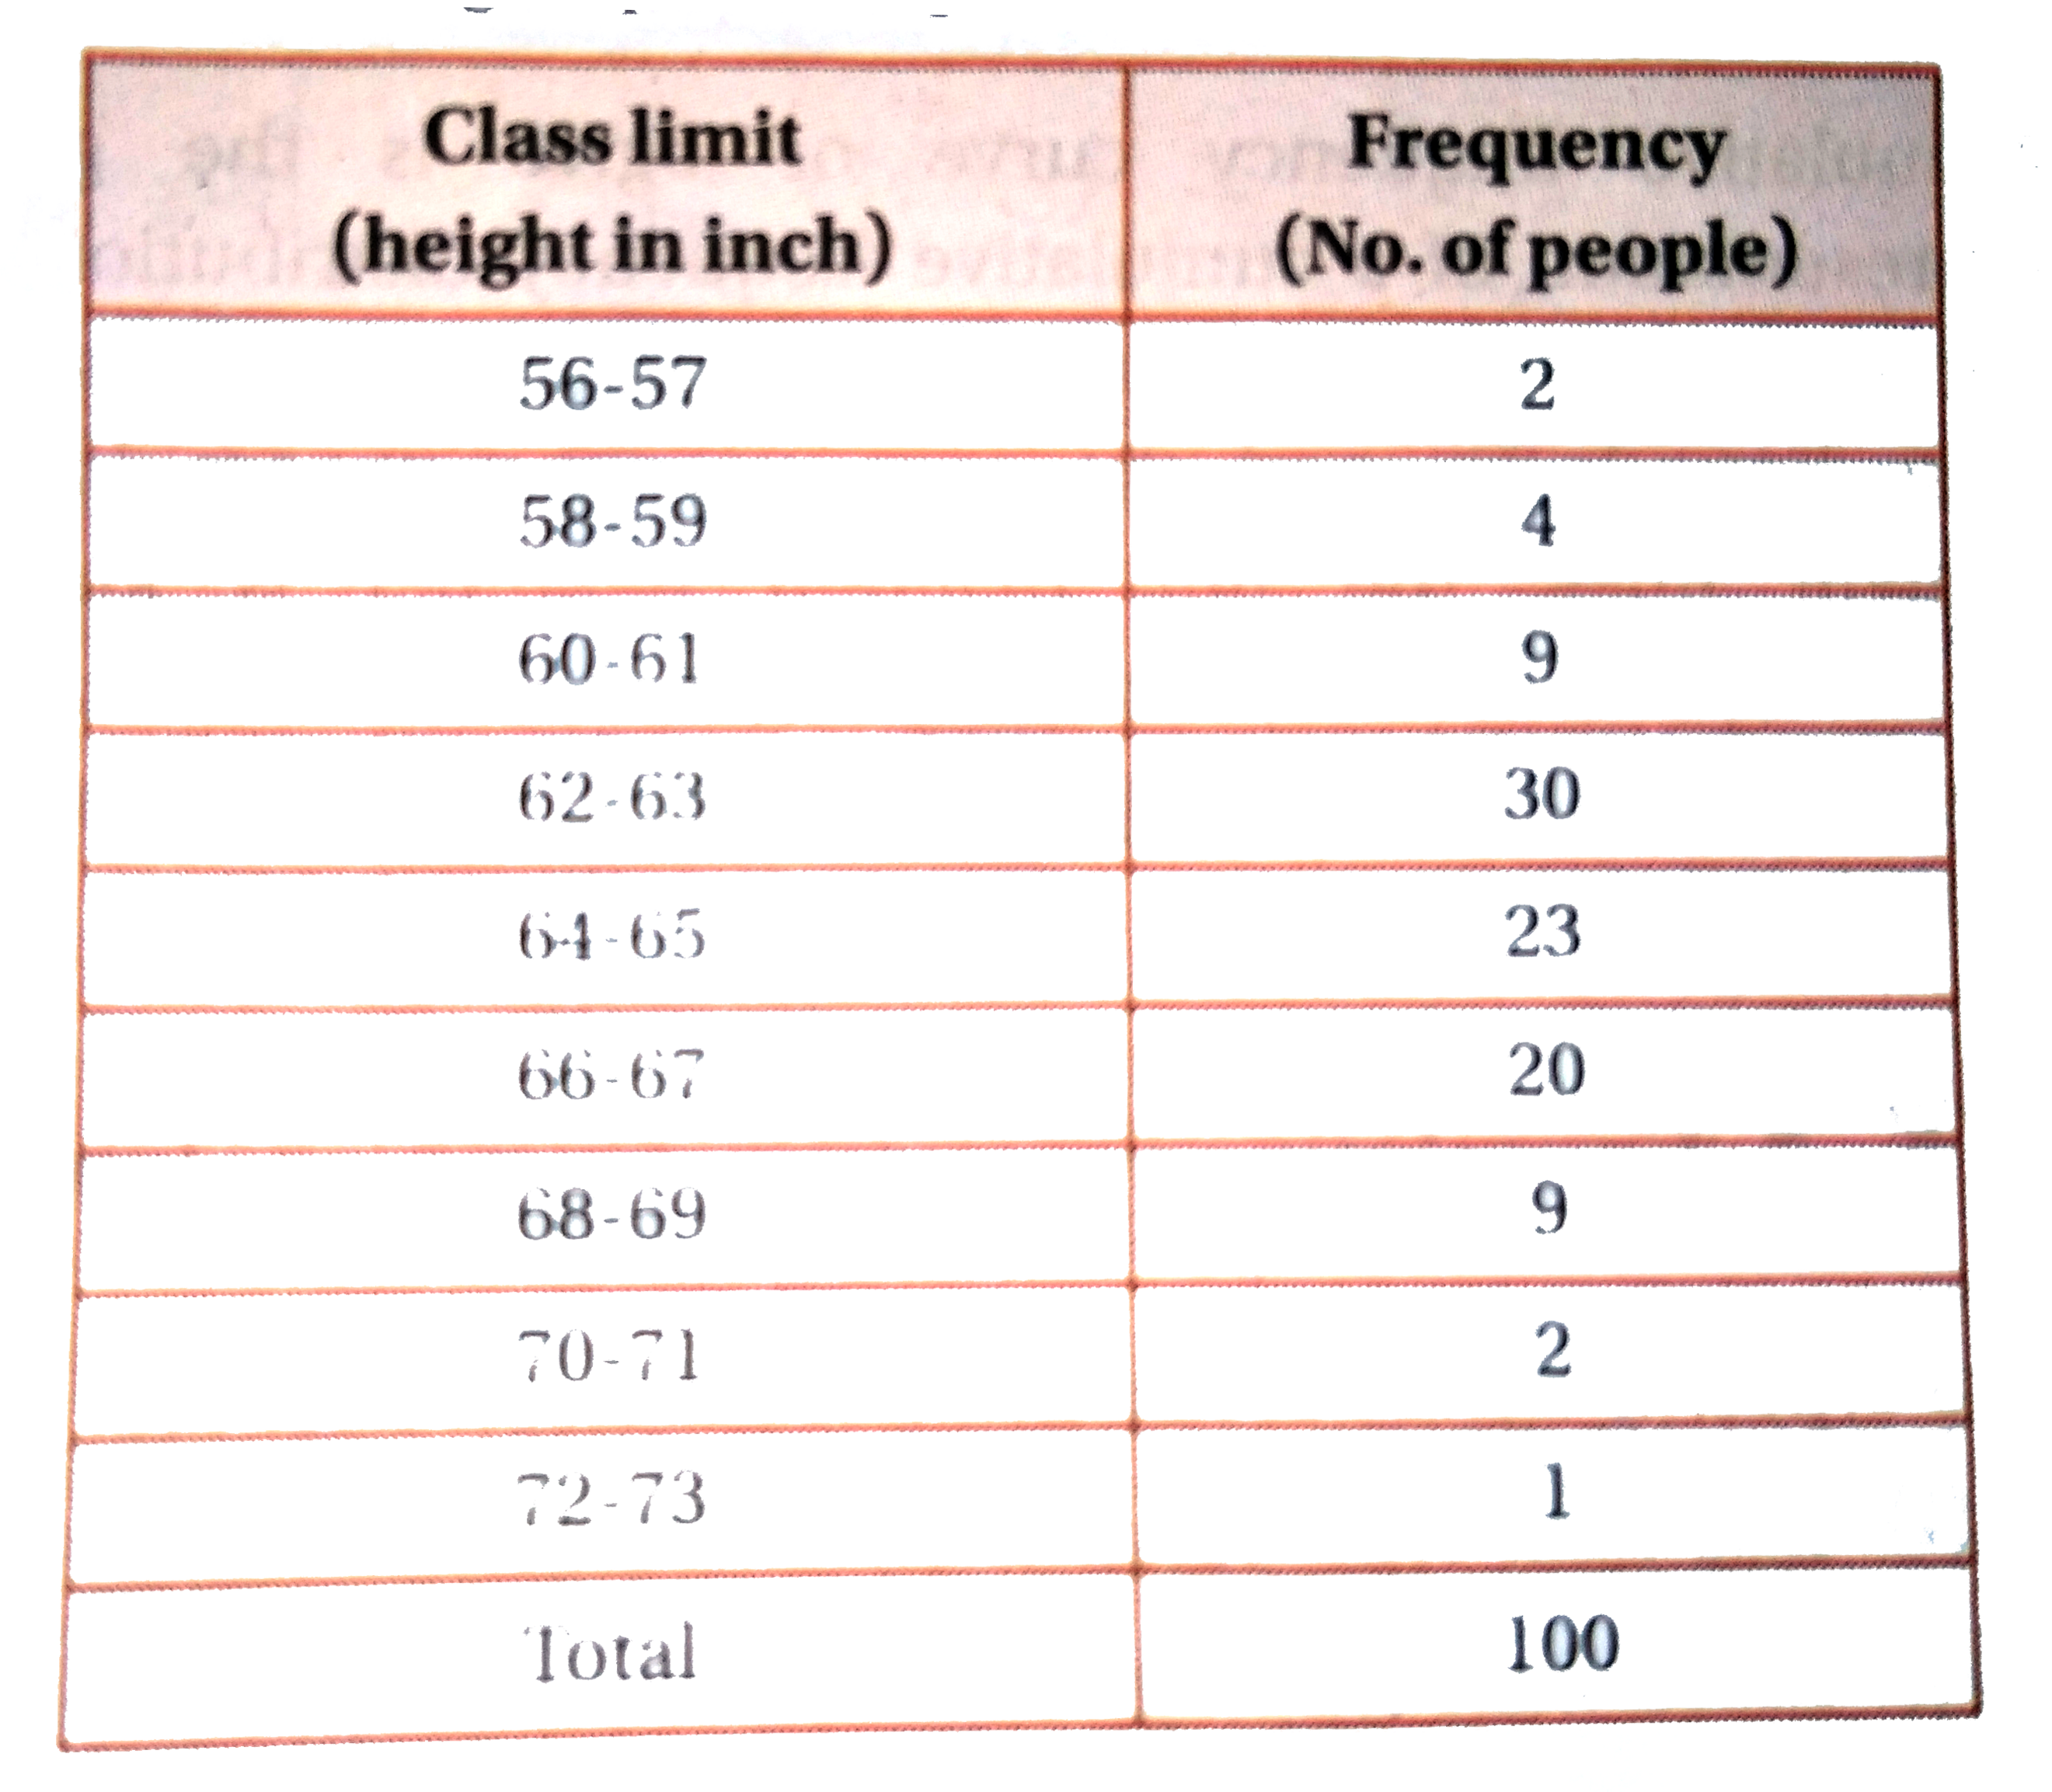
The following table gives the frequency distribution of heights in inches of a group of 100 peple:
 Draw a histogram for height distribution. Shade the portion of the histogram which will represent the total number of people whose heights lie between 60.5 and 66.5 inches.
View SolutionDraw a hsitpgram of the following frequency distribution:

View SolutionFrequency distribution of daily expenditure of 100 familes is given below:


Draw histrogram of the above frequency distribution.
View SolutionDraw a histrogram and frequency polygon of the following frequency distribution.

View SolutionAn urn contains 10 red and 8 white balls. One ball is drawn at random. Find the probability that the ball drawn is white.
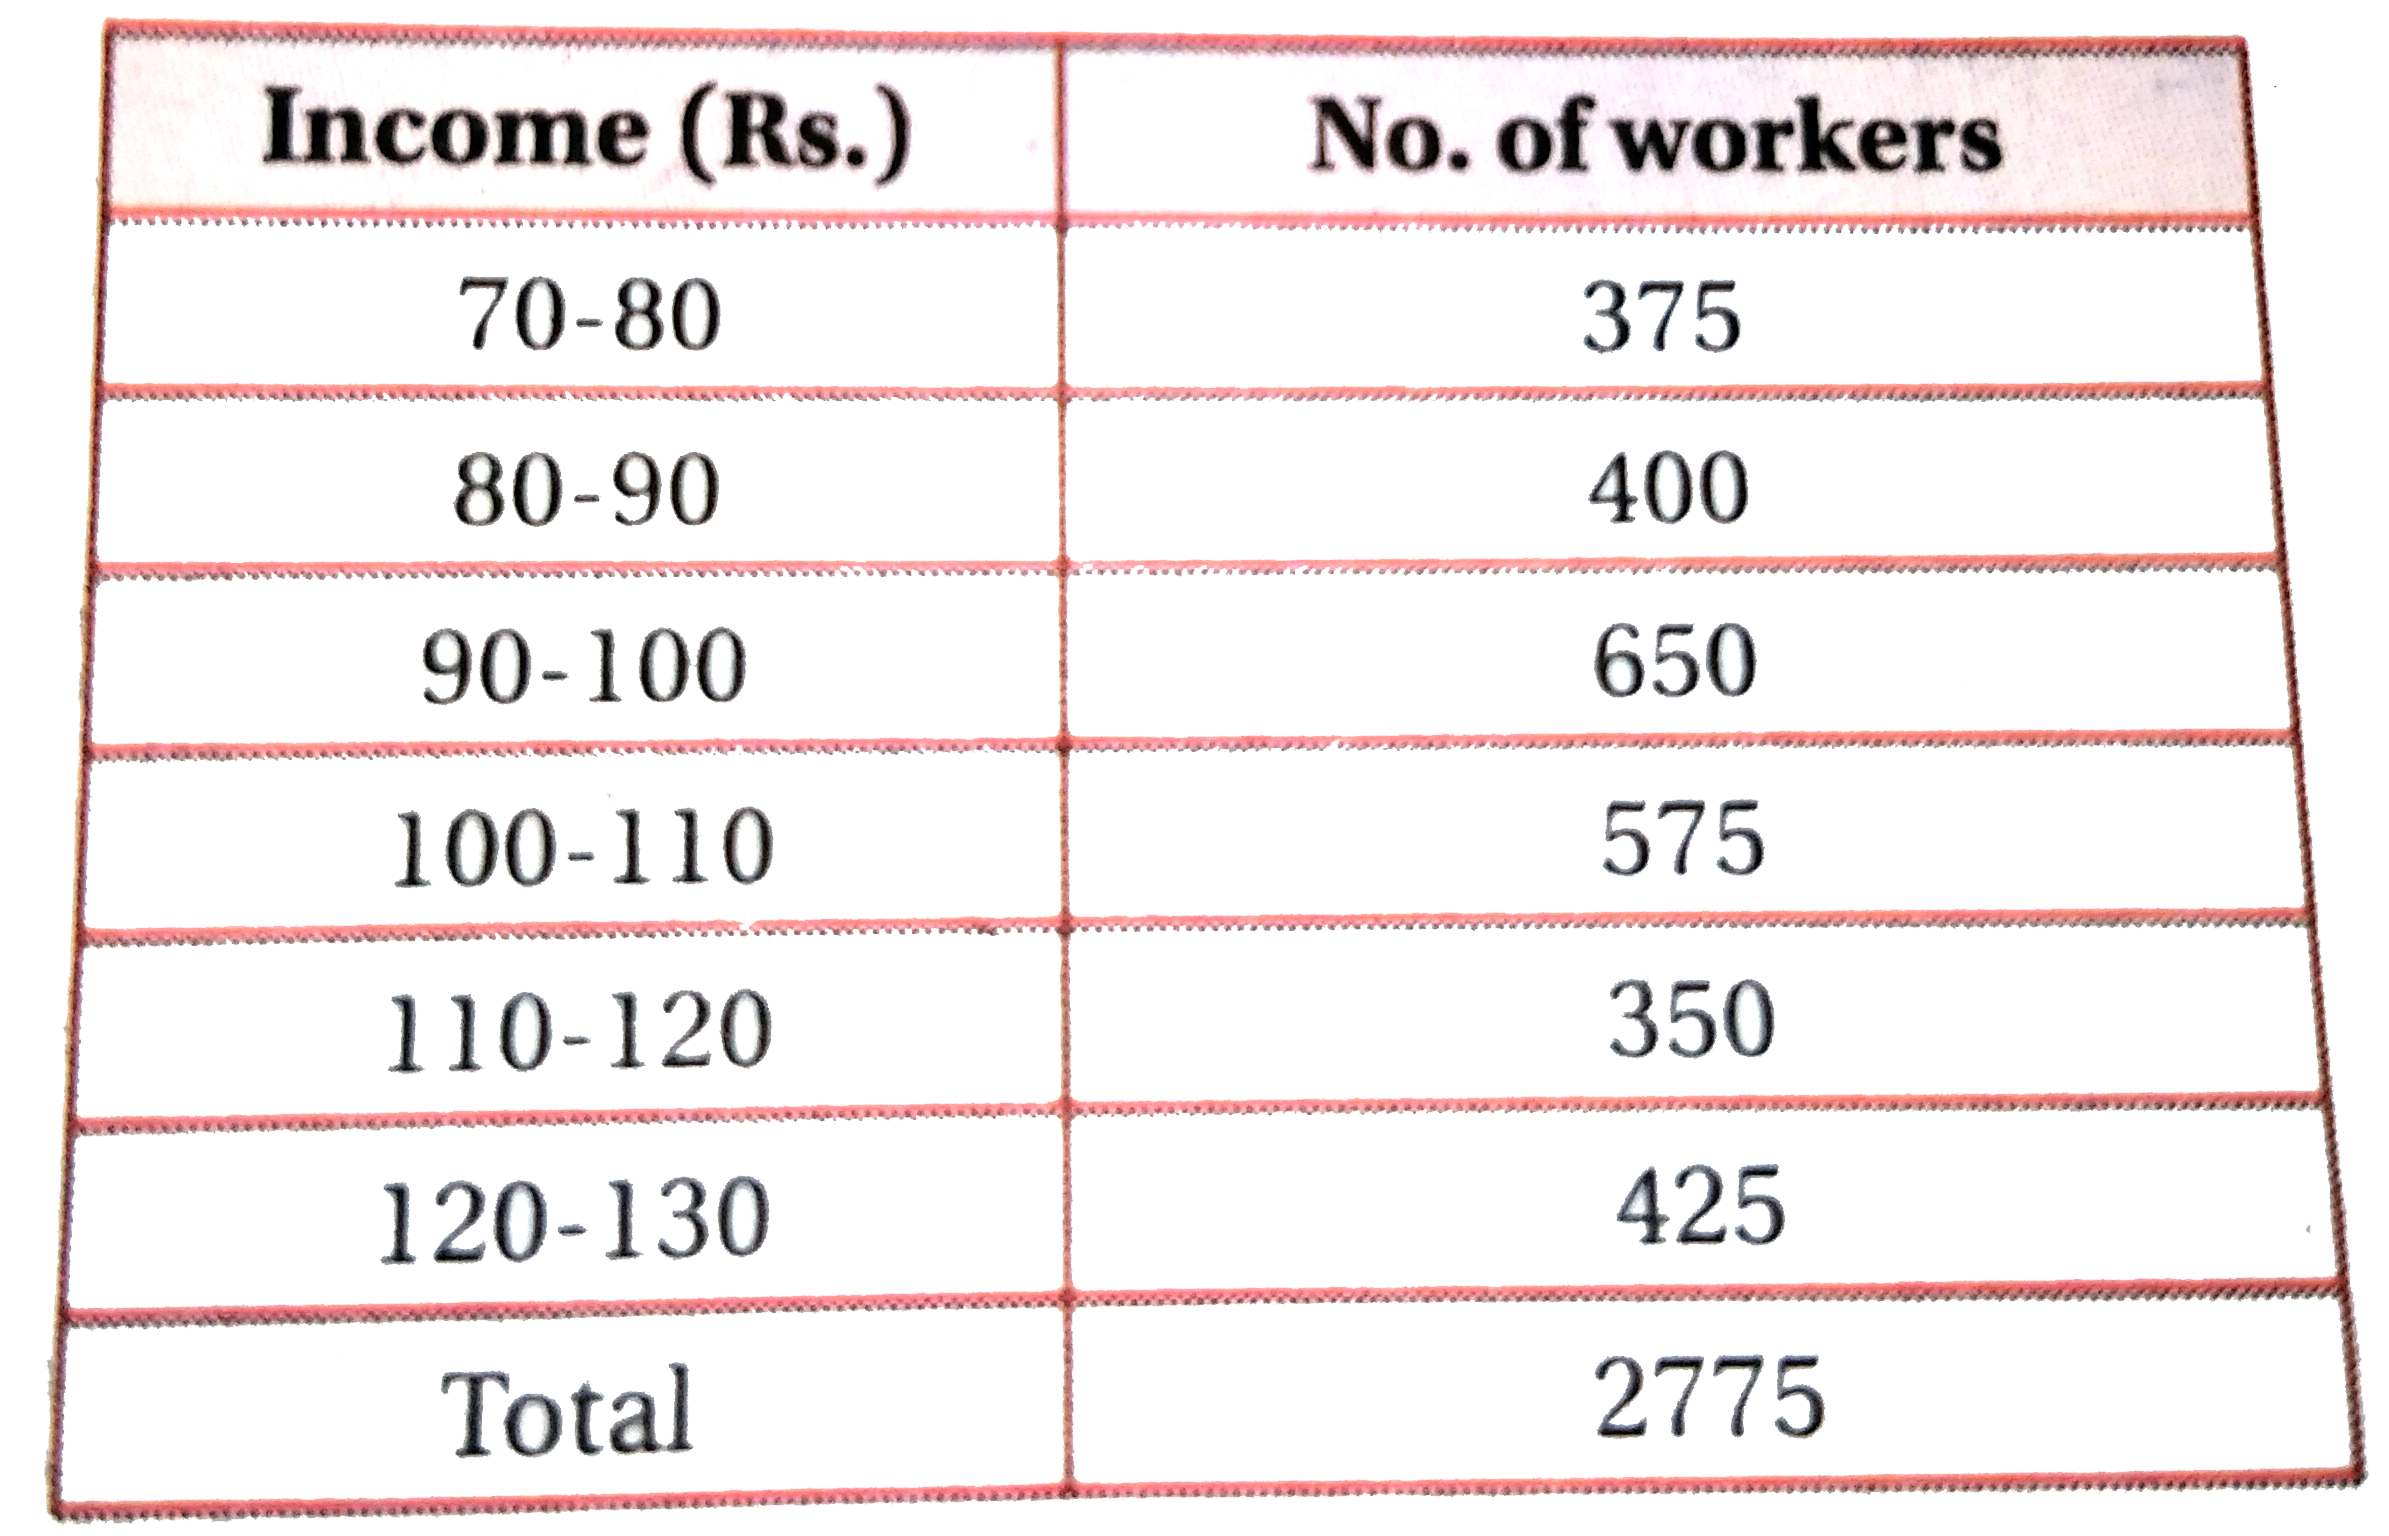
View SolutionDraw ogives (both ''less than'' and ''more than'') for the following distribution:

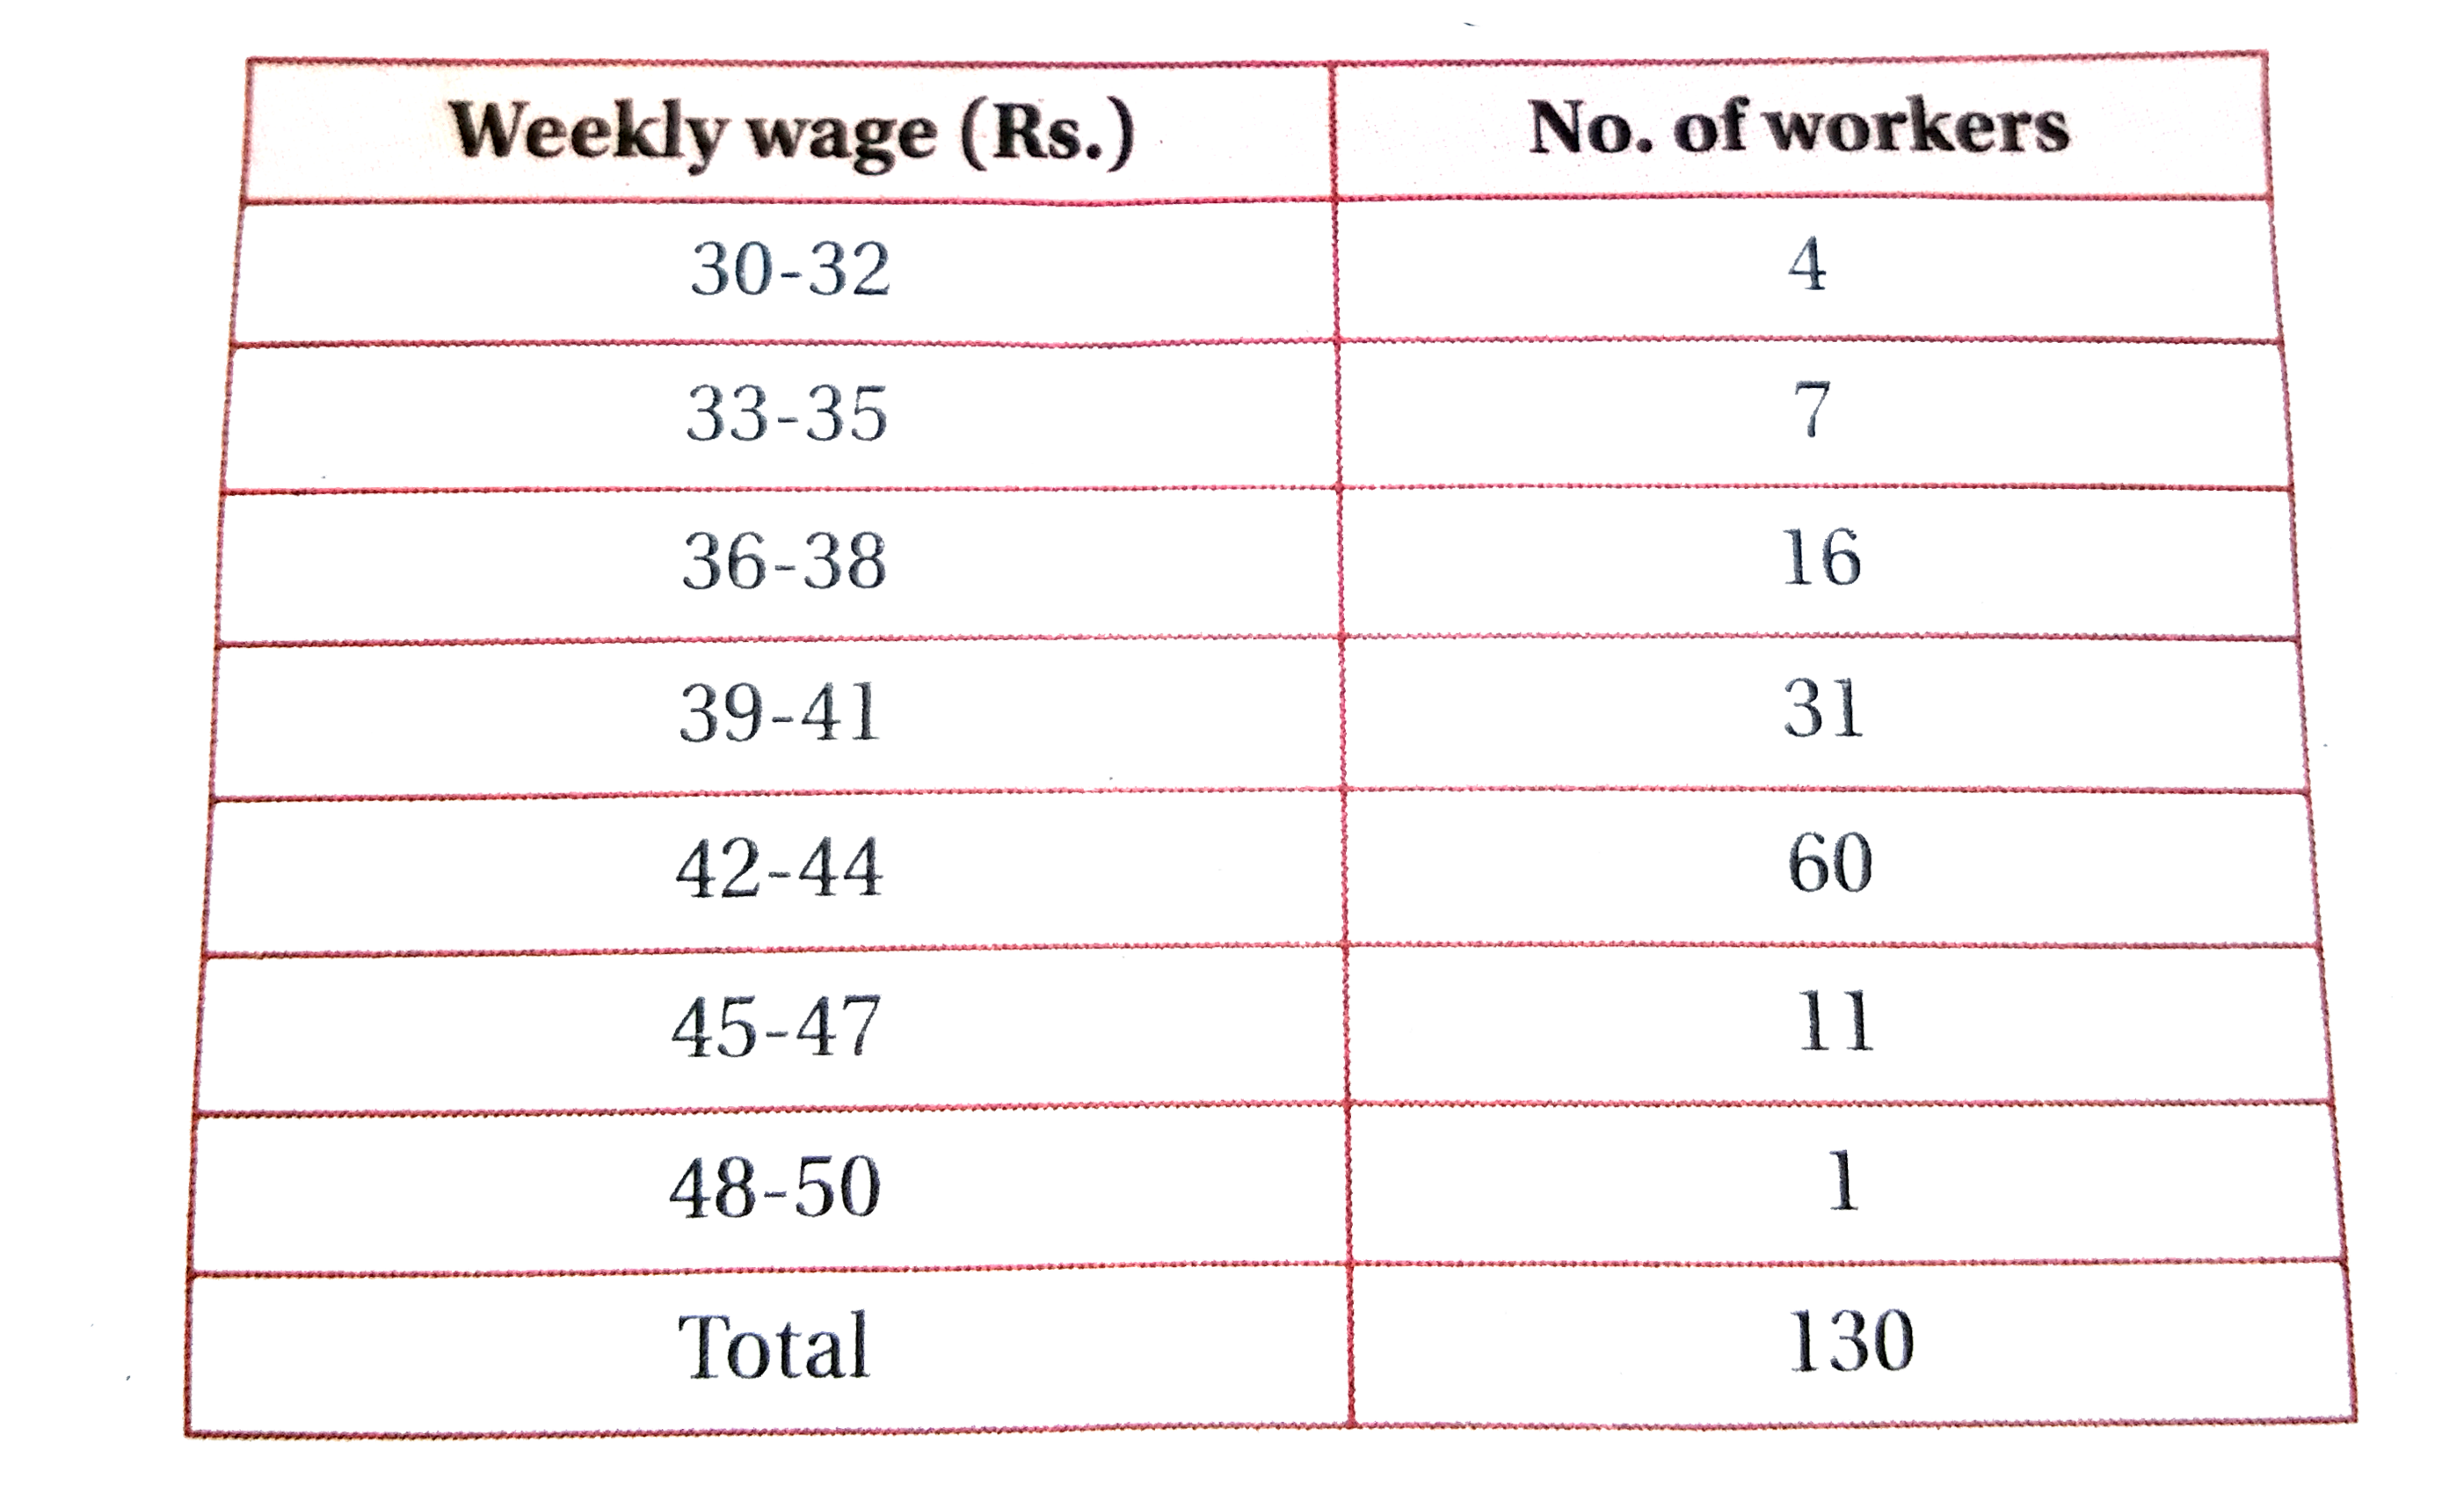
View SolutionDraw ogives of both types for the following distribution:

View Solution
EXERCISE (Very short Answer Type Question) questions and complete solutions for chapter DIAGRAMMATIC REPRESENTATION OF DATA of CHHAYA MATHS (BENGALI ENGLISH) of Class 11