Complete Solutions to EXERCISE (Long Answer Type Question) of chapter DIAGRAMMATIC REPRESENTATION OF DATA of Class 11 book with complete answers and questions
| Class 11 | MATHS |
| Chapter | DIAGRAMMATIC REPRESENTATION OF DATA |
| CHHAYA PRAKASHINI | EXERCISE (Long Answer Type Question) |
| Number Of Questions | 13 |
| Academic Year | 2023-24 |
A car manufacting company produces the following number of a cars in the first six months of the year 2005. Represent the data by a chart.

View SolutionThe amount of rainfall in the third week of july,2000 in Chennai is given below. Represent the stistical data by a bar chart.

View SolutionMarks obtained in different subjects of a student are given in the following table. Represents the data by a bar diagram.

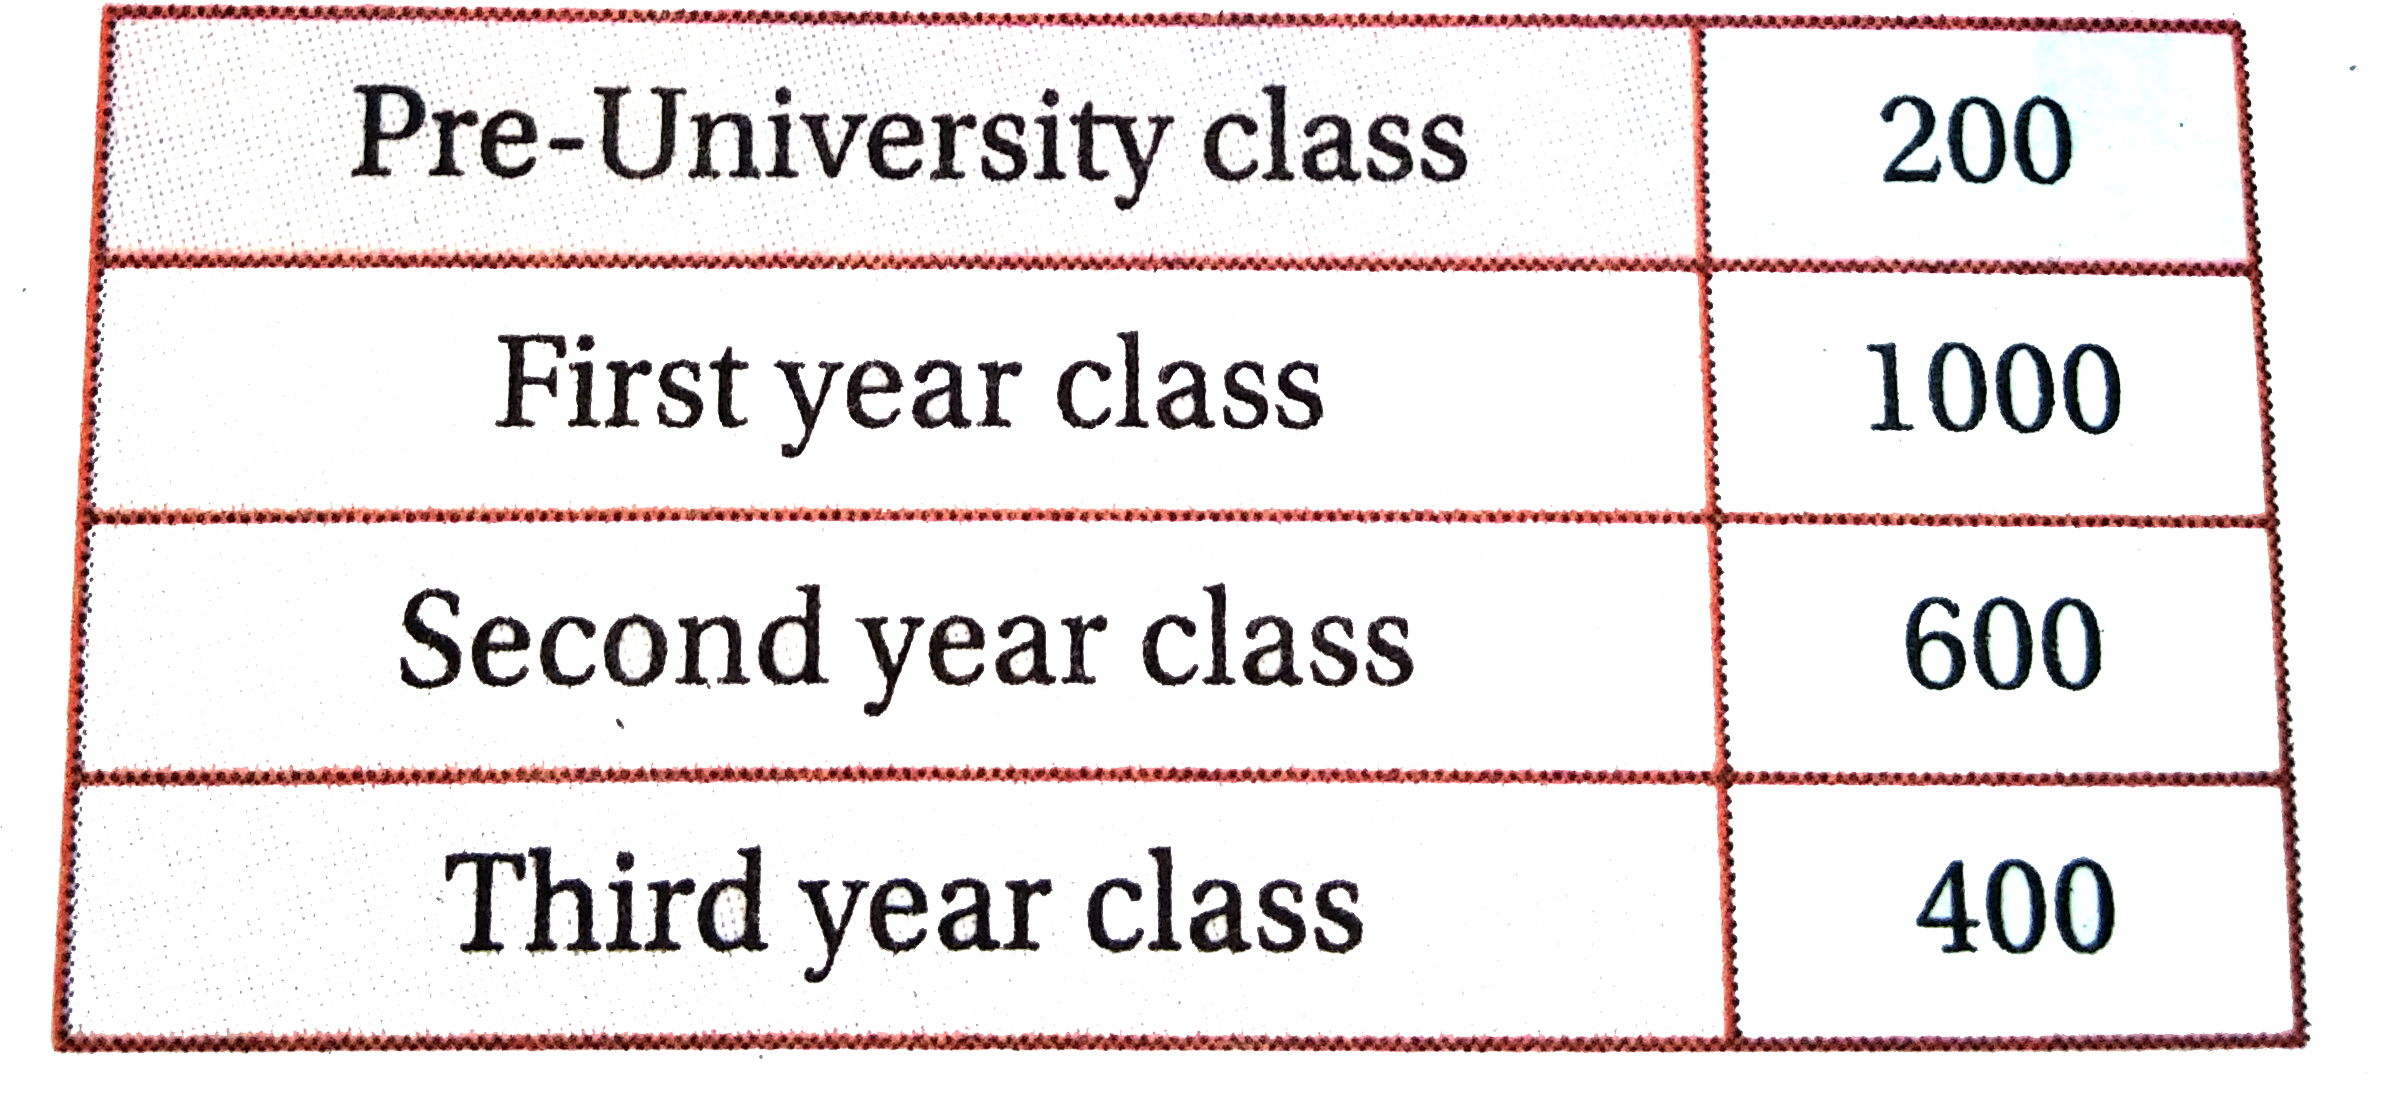
View SolutionDraw a bar chart for the number of students in a colleage:

View SolutionDraw a horizontal bar diagram of the following table:

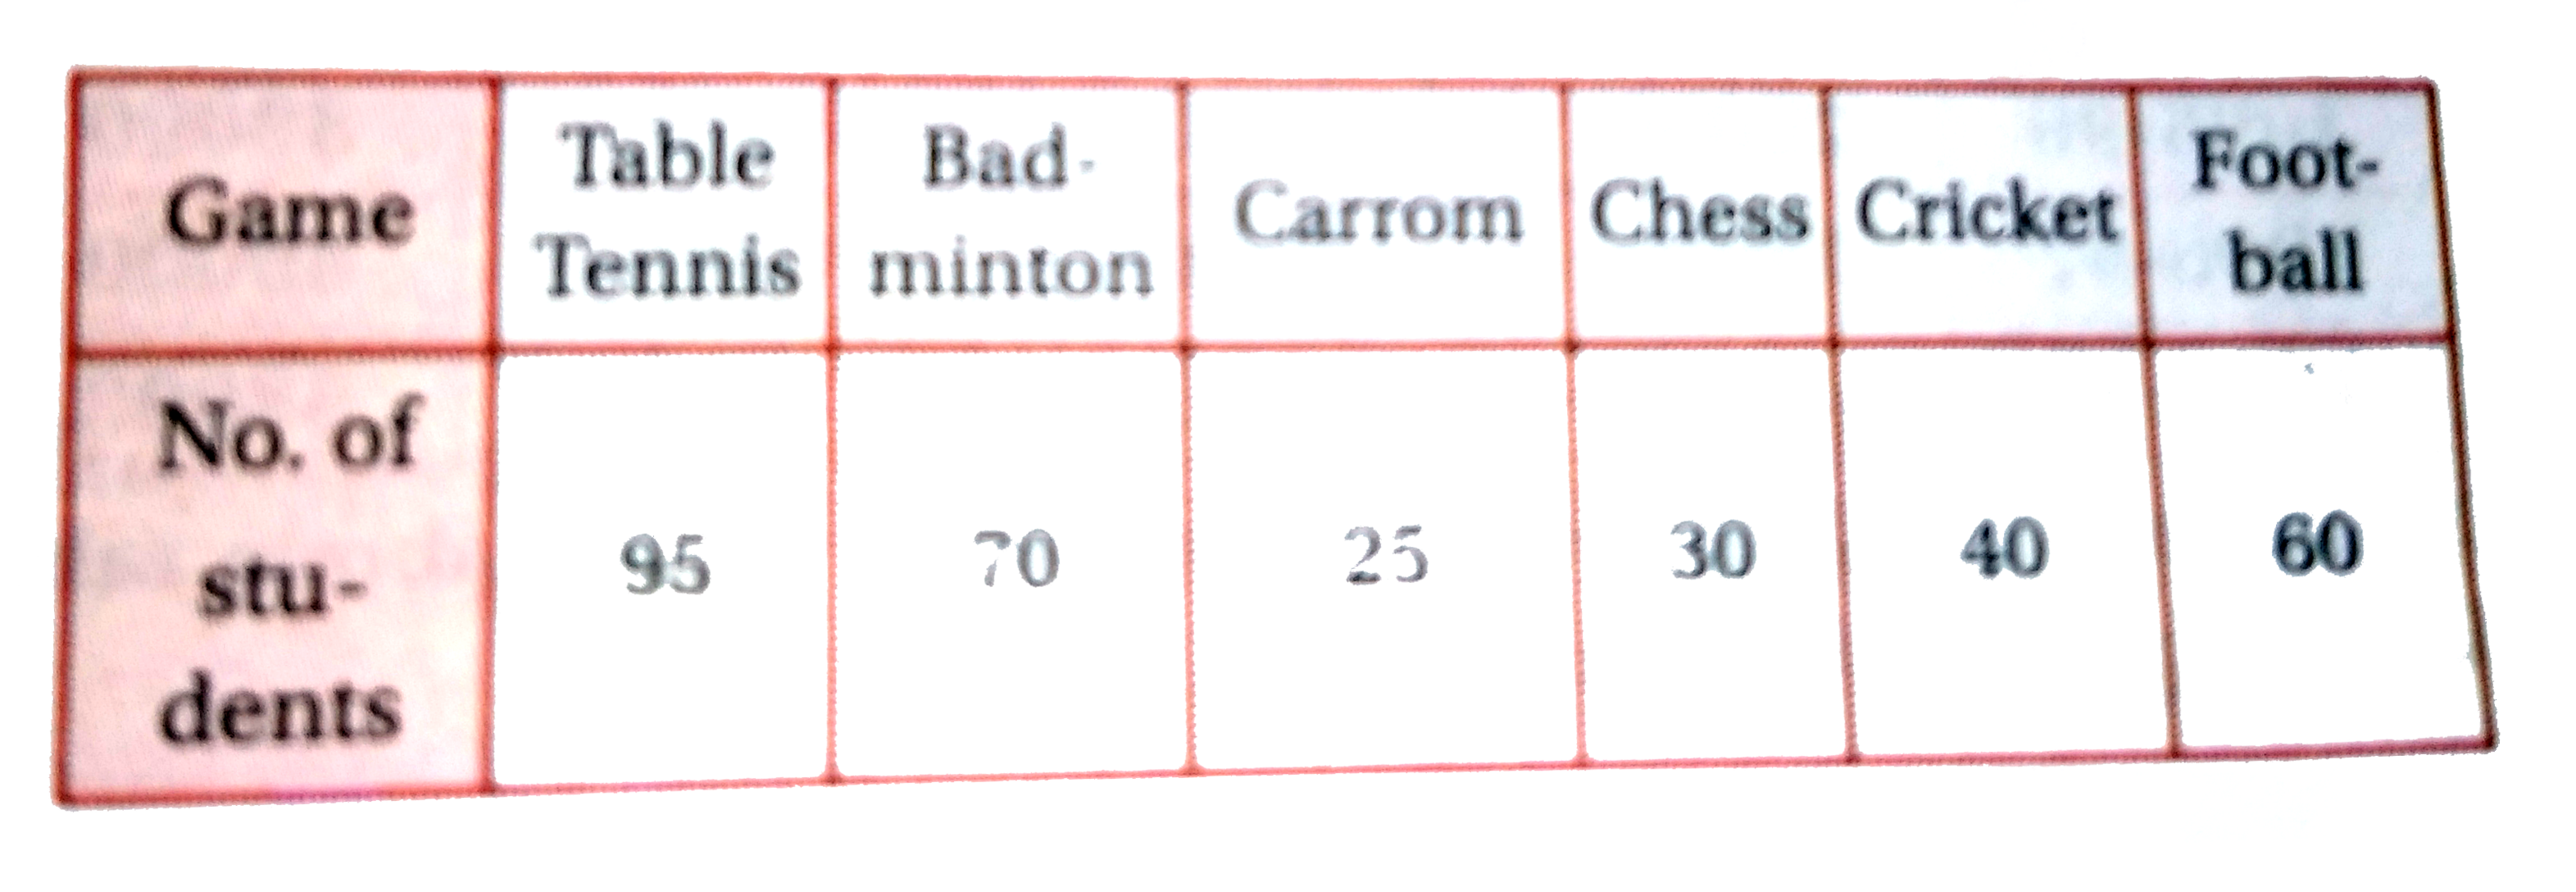
View SolutionIn a school the number of students participating in different games is given below. Represent the staristical data by a bar chart.

View SolutionThe profits & loss of a particular firm during the years 1989-1993 are given in the following table:

Represent the above statistical data by a bar diagram.
View SolutionRepresent the following table by a multiple bar chart:

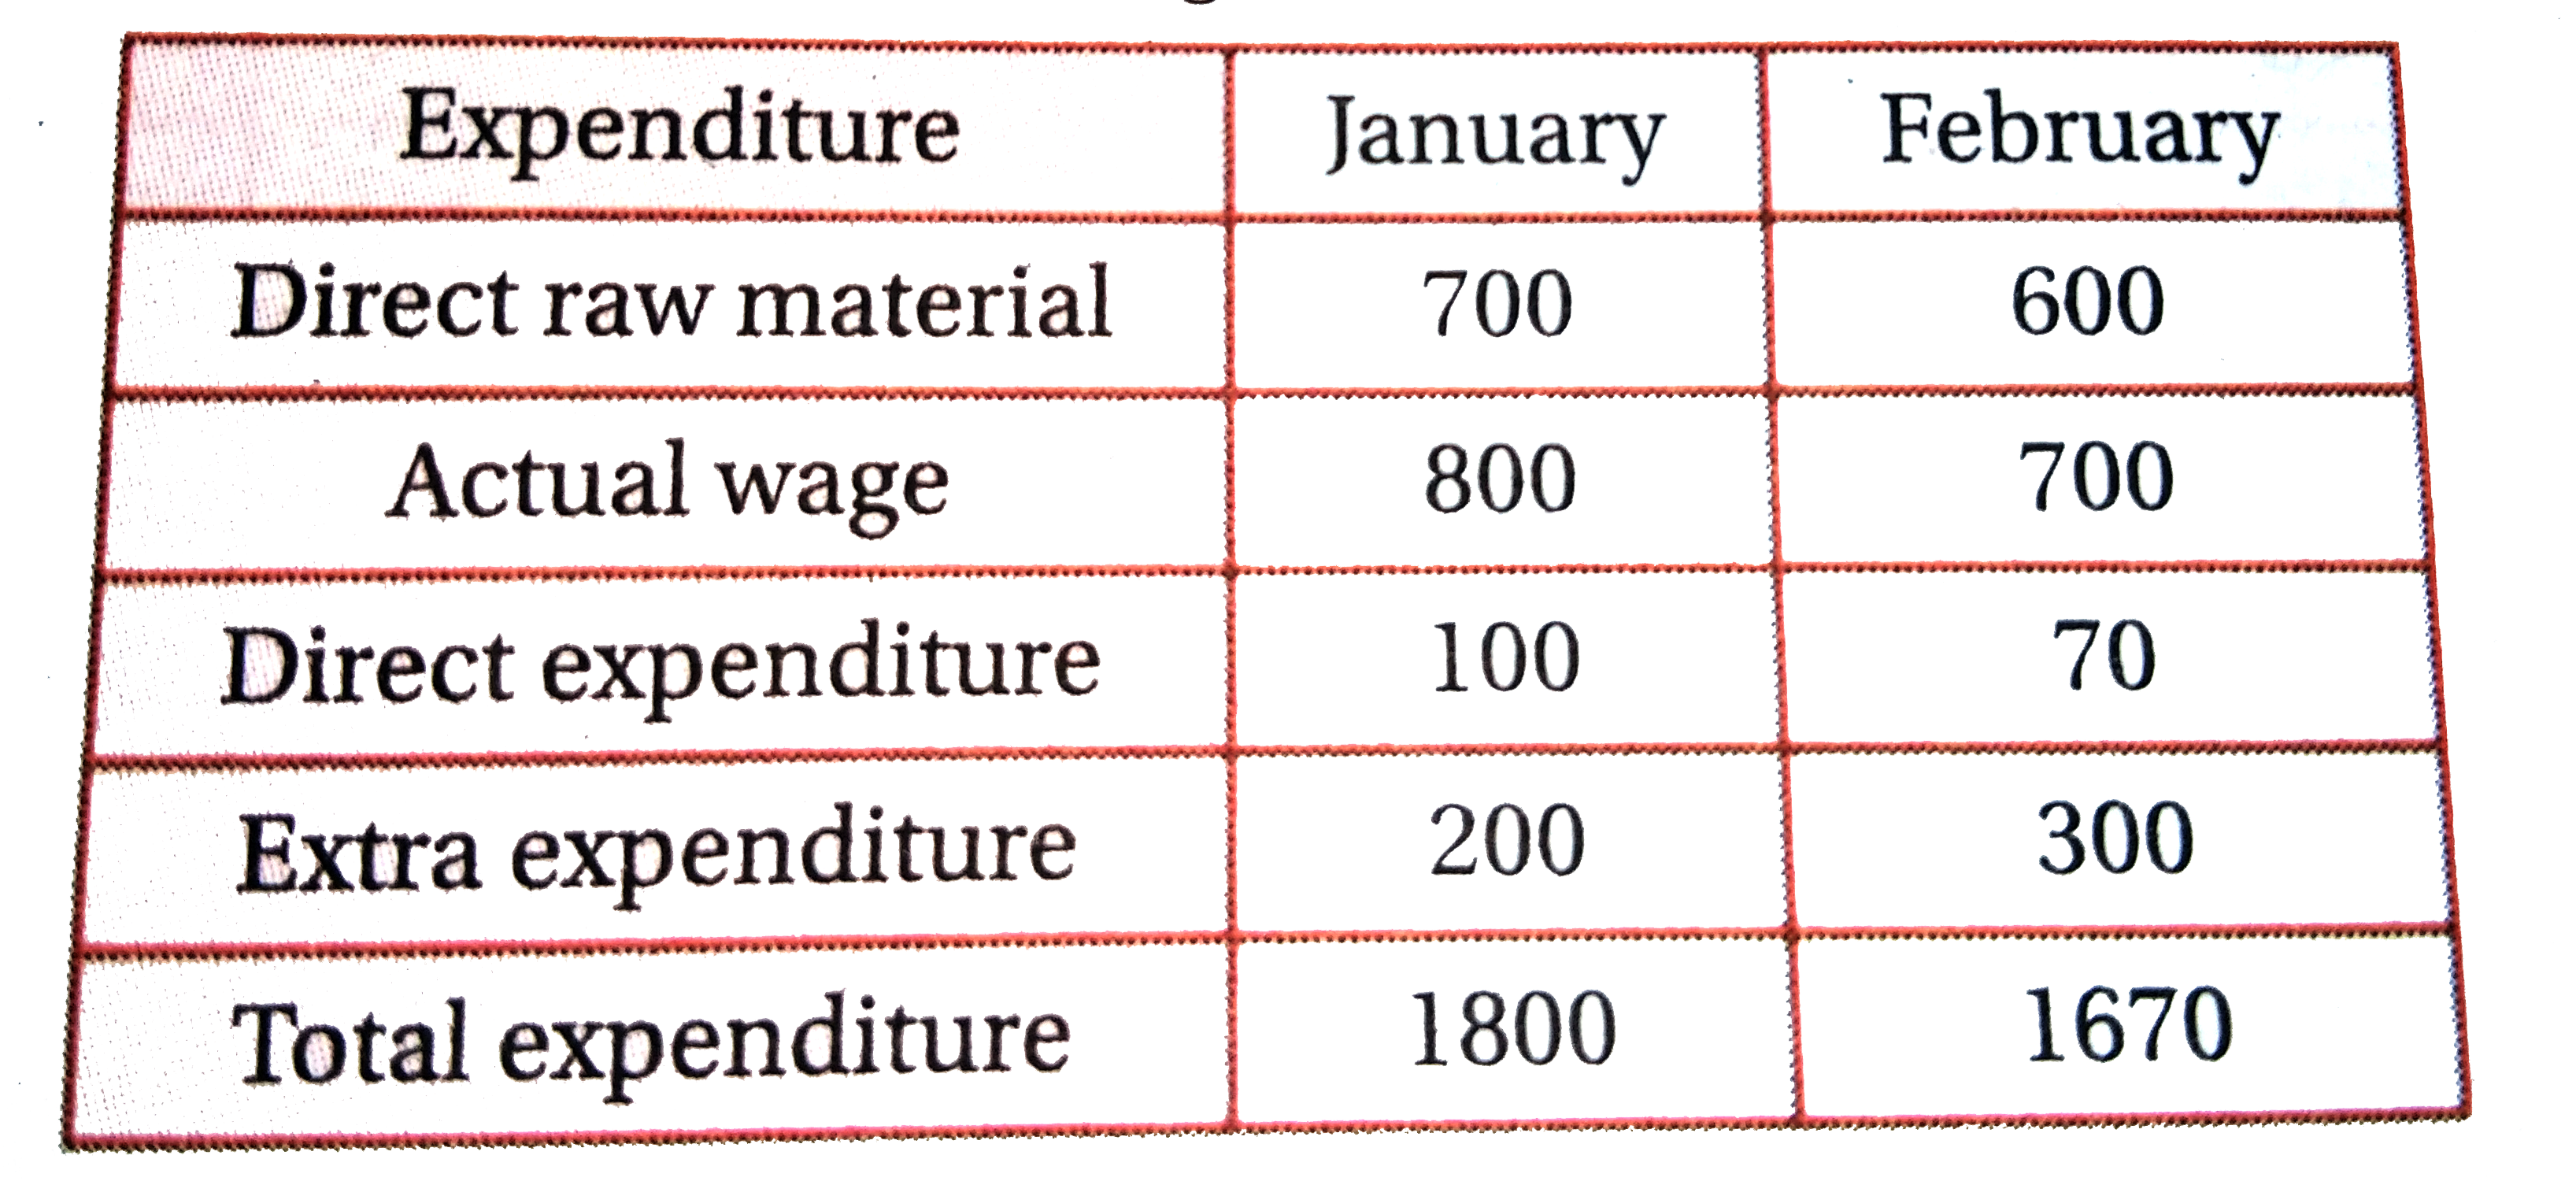
View SolutionTotal expenditure (in Rs.) and its proportionate expenditures of two different months are given below:

Draw a component bar chart showing total expendicular and its proportionate expenditures.
View SolutionDaily production expenditure of a factory is given below:

Represent tha data by a chart.
View SolutionAn urn contains 10 red and 8 white balls. One ball is drawn at random. Find the probability that the ball drawn is white.
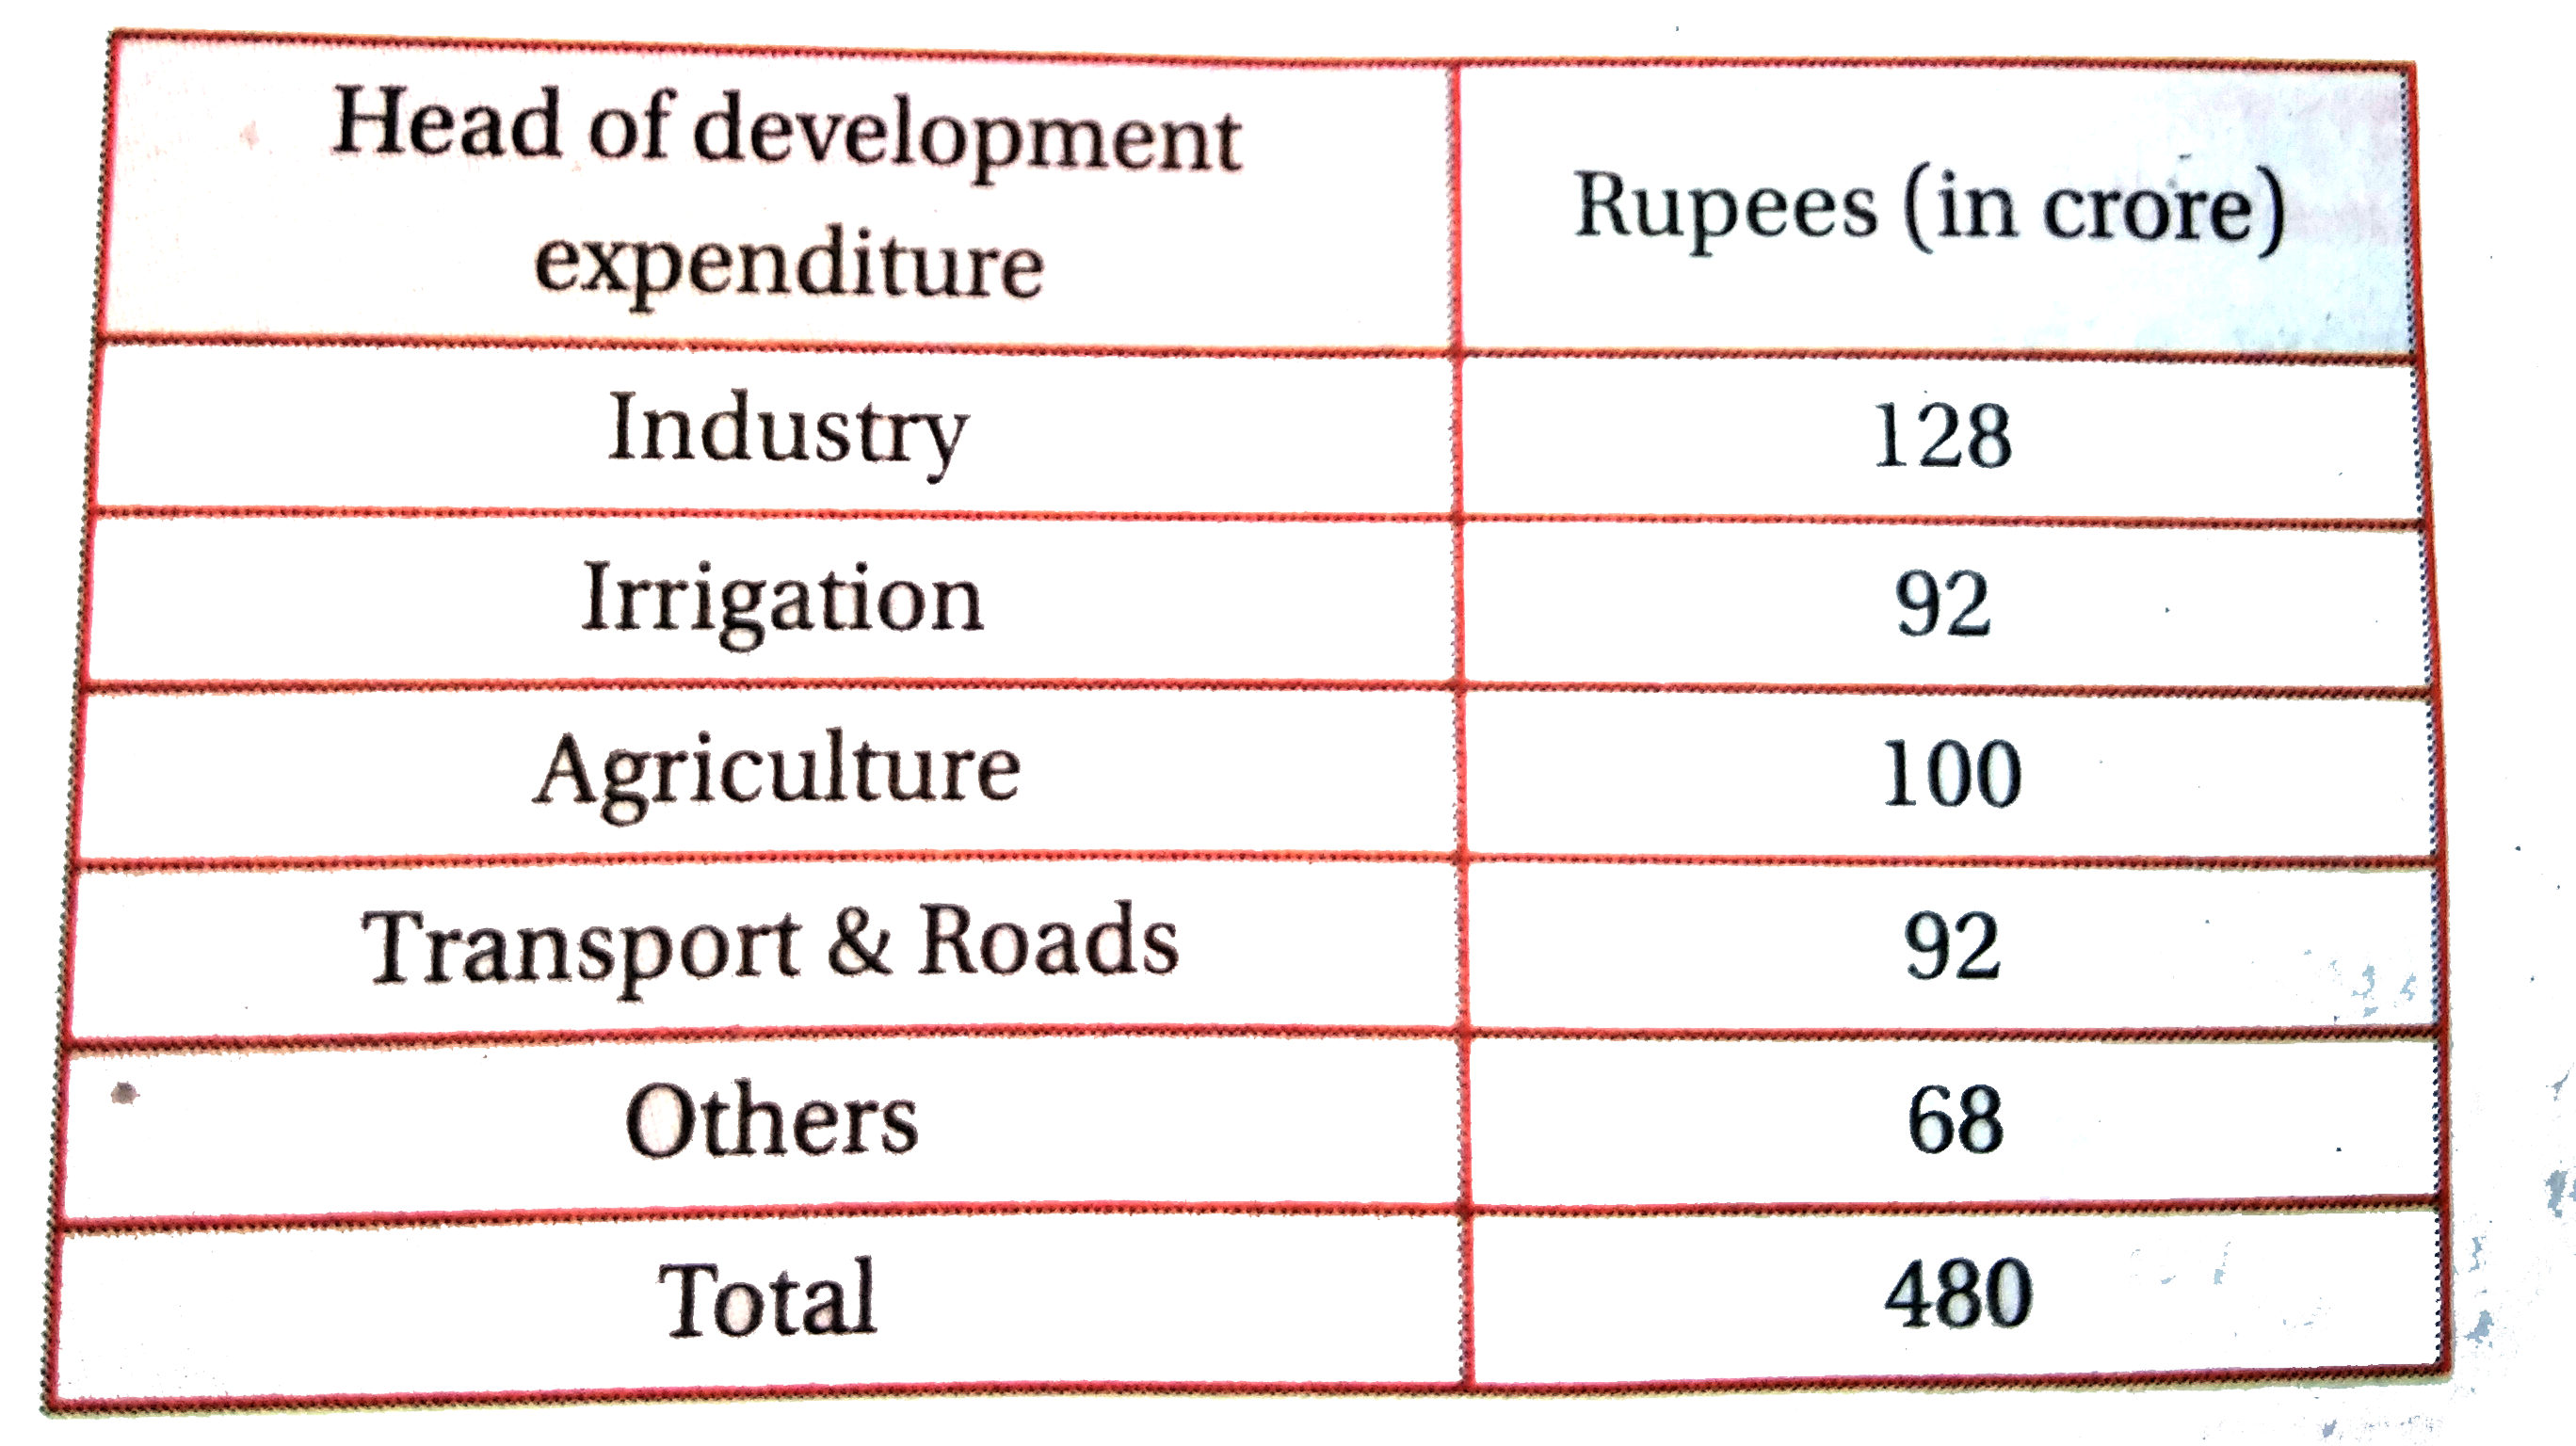
View SolutionDraw a pie diagram to present the following data on proposed outlay during second Five-year Plan of a certain state of India:

View SolutionAn urn contains 10 red and 8 white balls. One ball is drawn at random. Find the probability that the ball drawn is white.
View Solution
EXERCISE (Long Answer Type Question) questions and complete solutions for chapter DIAGRAMMATIC REPRESENTATION OF DATA of CHHAYA MATHS (BENGALI ENGLISH) of Class 11