Complete Solutions to NCERT Questions of chapter ARITHMETIC LINE-GRAPHS OR TIME SERIES GRAPHS of Class 11 book with complete answers and questions
| Class 11 | ECONOMICS |
| Chapter | ARITHMETIC LINE-GRAPHS OR TIME SERIES GRAPHS |
| TARUN JAIN & VK OHRI | NCERT Questions |
| Number Of Questions | 2 |
| Academic Year | 2023-24 |
Data represented through arithmetic line graph help in understanding:
(i) long term trend (ii) cyclicity in data
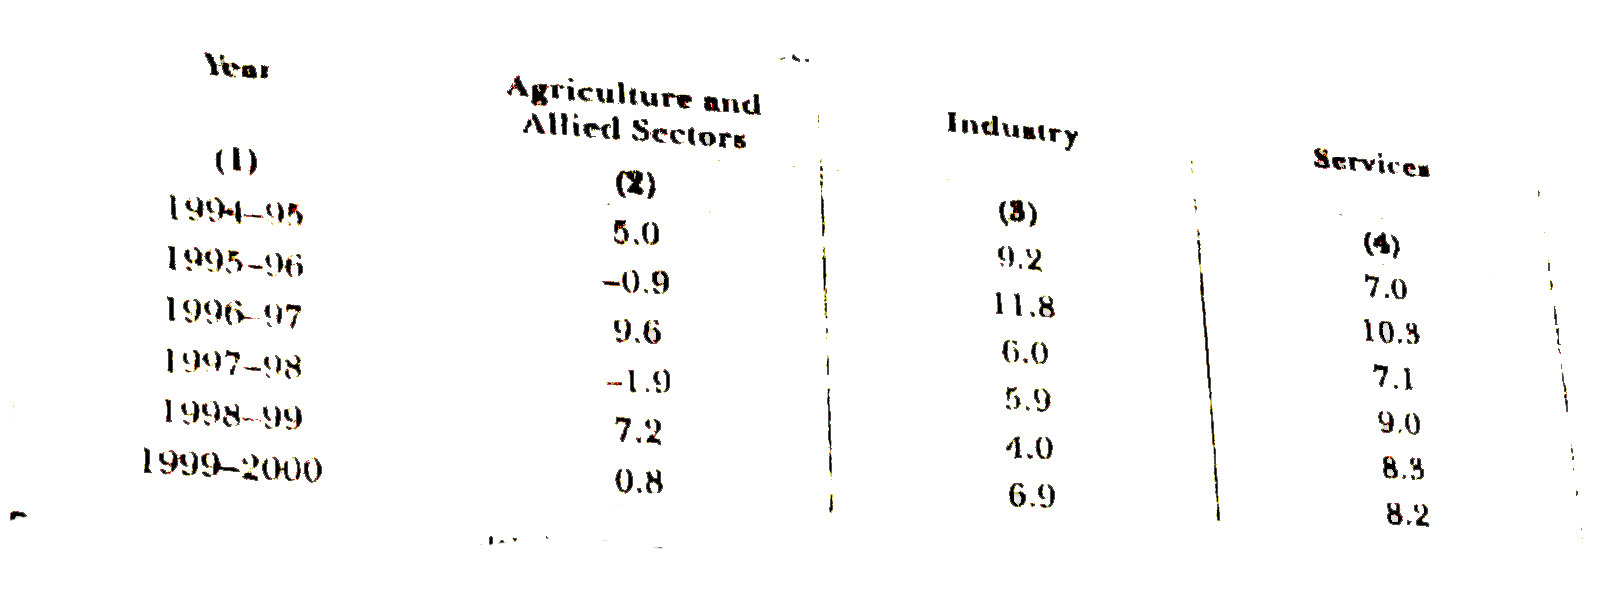
(iii) seasonality in data (iv) all of the aboveView SolutionThe following table shows the estimated sectoral real growth rates (percentage change over the previous year) in GDP at factor cost.

Represent the data as multiple time series graph.15:06View Solution
NCERT Questions questions and complete solutions for chapter ARITHMETIC LINE-GRAPHS OR TIME SERIES GRAPHS of VK GLOBAL PUBLICATION ECONOMICS (HINGLISH) of Class 11
