Complete Solutions to Essential Practicals of chapter ARITHMETIC LINE-GRAPHS OR TIME SERIES GRAPHS of Class 11 book with complete answers and questions
| Class 11 | ECONOMICS |
| Chapter | ARITHMETIC LINE-GRAPHS OR TIME SERIES GRAPHS |
| TARUN JAIN & VK OHRI | Essential Practicals |
| Number Of Questions | 4 |
| Academic Year | 2023-24 |
Plot the annual profits of a firm on a time series graph:
`{:("Year",2013,2014,2015,2016,2017,2018),("Profit ('000 Rs.)",60,72,75,65,80,95):}`
View SolutionPlot the following hypothetical figures on time series graphs:
`{:("Year","Imports(Rs. thousand crore)","Exports (Rs. thousand crore)"),(2013-14," "123," "106),(2014-15," "178," "140),(2015-16," "215," "159),(2016-17," "231," "203),(2017-18," "245," "209):}`
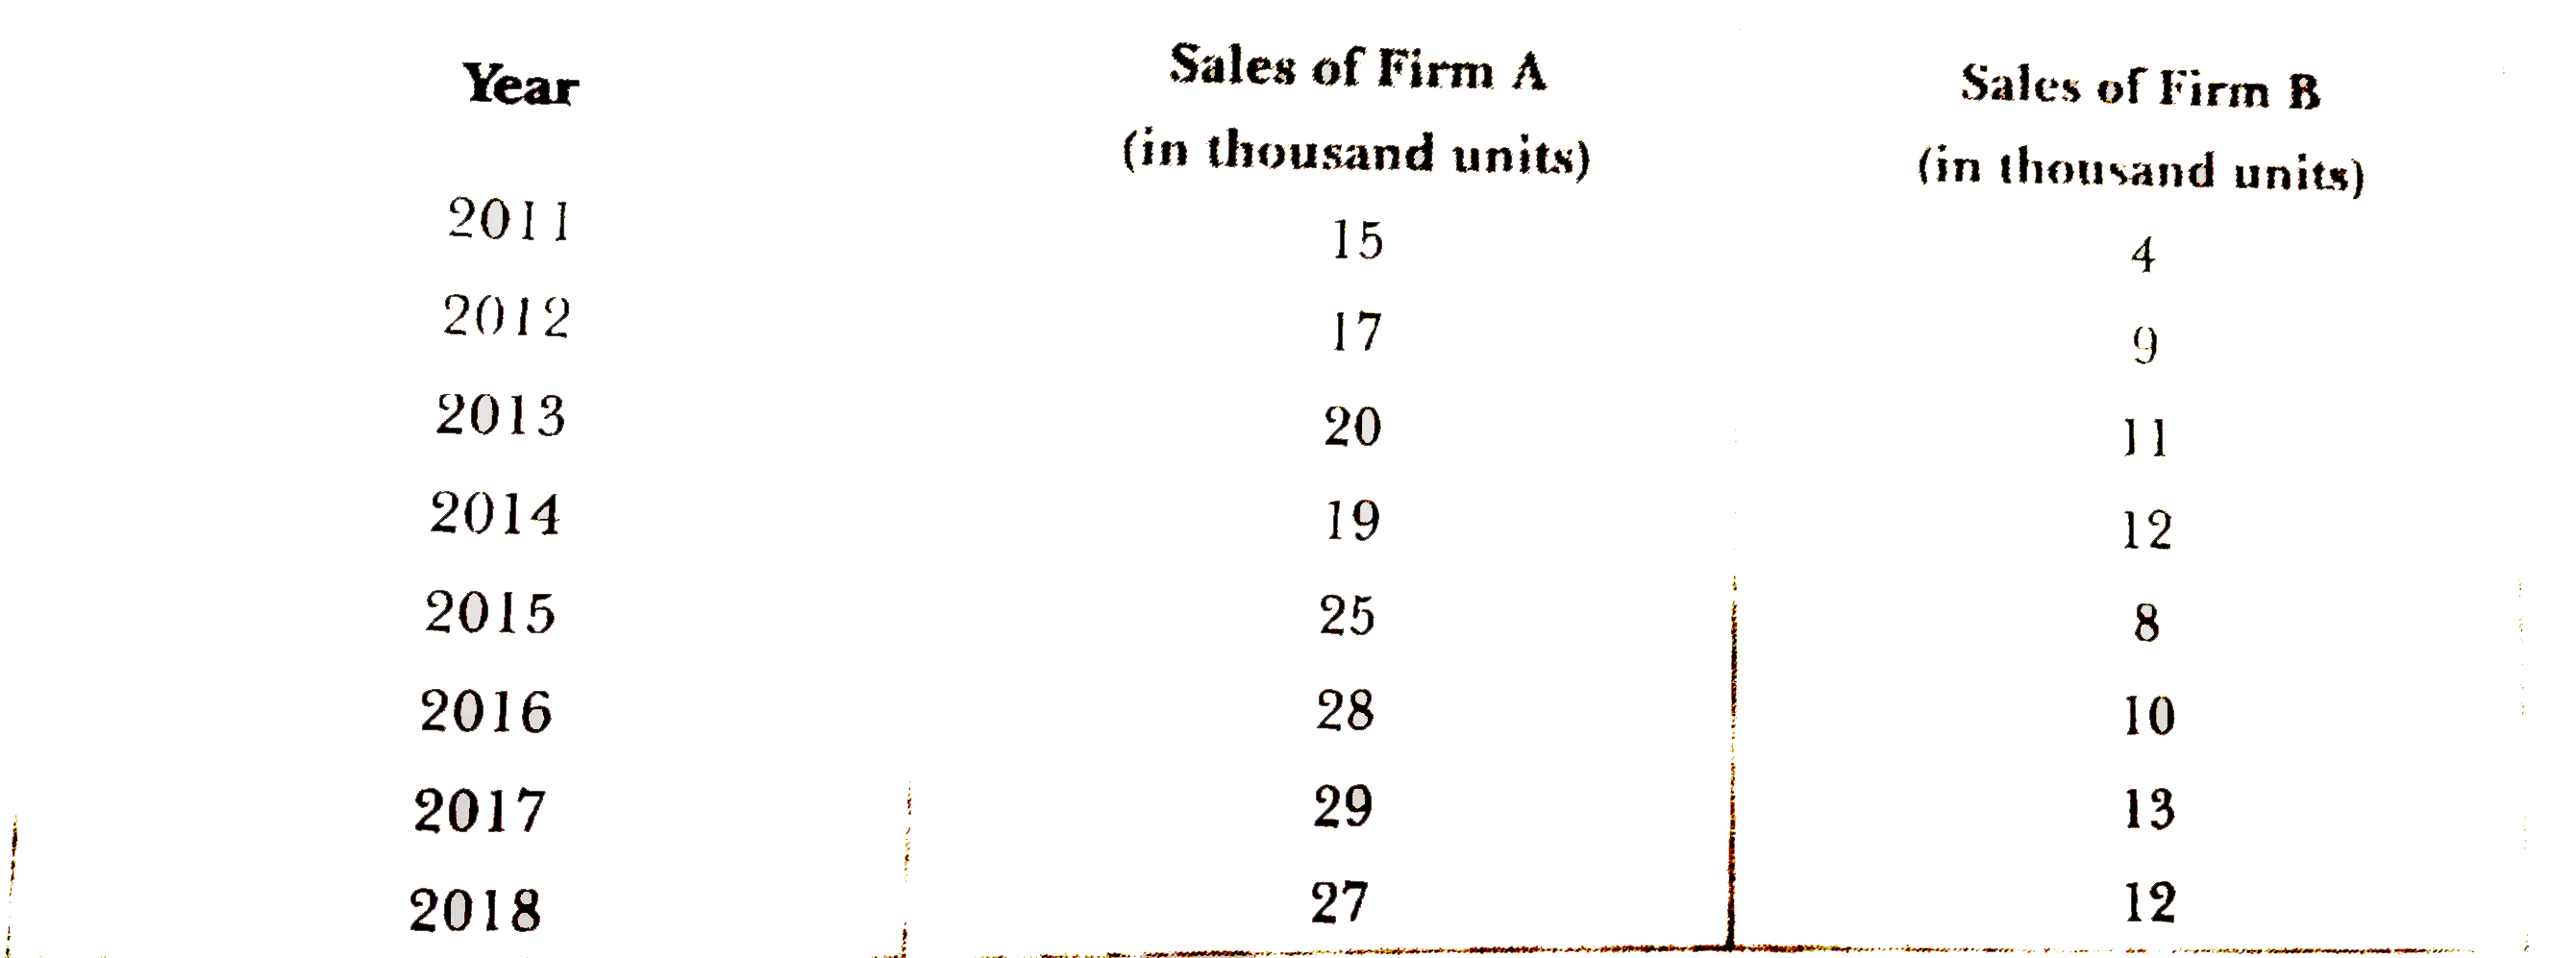
View SolutionThe following are the figures of sales of two firms A and B for the years 2011-2018. Present the dats graphically.

View SolutionThe following are the sales figures of TVs of Firm A, during 2013, 2018:
`{:("Year",2013,2014,2015,2016,2017,2018),("Sale (in thousand units)","2,155","2,201","2,190","2,250","2,095","2,170"):}`
View Solution
Essential Practicals questions and complete solutions for chapter ARITHMETIC LINE-GRAPHS OR TIME SERIES GRAPHS of VK GLOBAL PUBLICATION ECONOMICS (HINGLISH) of Class 11