Complete Solutions to Very Short Answer Type of chapter STATISTICS of Class 7 book with complete answers and questions
| Class 7 | MATHS |
| Chapter | STATISTICS |
| PEARSON IIT JEE FOUNDATION | Very Short Answer Type |
| Number Of Questions | 37 |
| Academic Year | 2023-24 |
If the range of a data is 9 and its highest value is 81, then its least value is
View SolutionThe mean of the observation 7, 8, 9, 11 and 15 is 10.
View SolutionThe median of the data 13, 12, 10, 8, 4, 6, and 15 is 10.
View Solutionthe mode of the data 8, 4, 5, 3, 6, 7, 7, 8, 4, 6, 8, 9 and 9 is 7.
View SolutionFor an unbiased coin, the probability of getting tail is 1/2.
View SolutionThe mean of 20, 40, 35, 42, and 45 is ____.
View SolutionIn a pie chart, the central angle for a component value of 240, when the total value is 720, is ______.
View SolutionIn a bar graph, the height of a bar is 5.2 cm. If 1 cm=80 units, then the value represented by the bar is _______ units.
View Solutionthe range of the data 13, 18, 20, 15, 12, 17, 9, 14, 11, and 16 is ________.
View SolutionIf the sum of 10 observations is 95, then their mean is ______.
View SolutionIn a pictograph, if 1 picture = 80 cars, then 240 cars is equal to ______ pictures.
View Solutionthe median of the data 13, 12, 14, 13, 15, 16, 18, is _______.
View SolutionIf a dice is rooled, then the probability of getting a prime number is _______.
View SolutionWhen an unbiased coin is tossed, the probability of getting a head is ______.
View SolutionThe maximum value of the probability of an event is ______.
View SolutionThe measures of central tendency are _______.
View SolutionThe middle value of a data, when it is arranged in ascending or descending, is called _____.
View SolutionIf a dics is thrown, then the probability of getting an even number is _______.
View SolutionThe mode of a data is _______.
View SolutionThe central angle of a component in a pie chart is _______.
View SolutionThe graphs drawn generally for representing a data are _______.
View SolutionWhen a dice is thrown, the outcomes are ______.
View Solution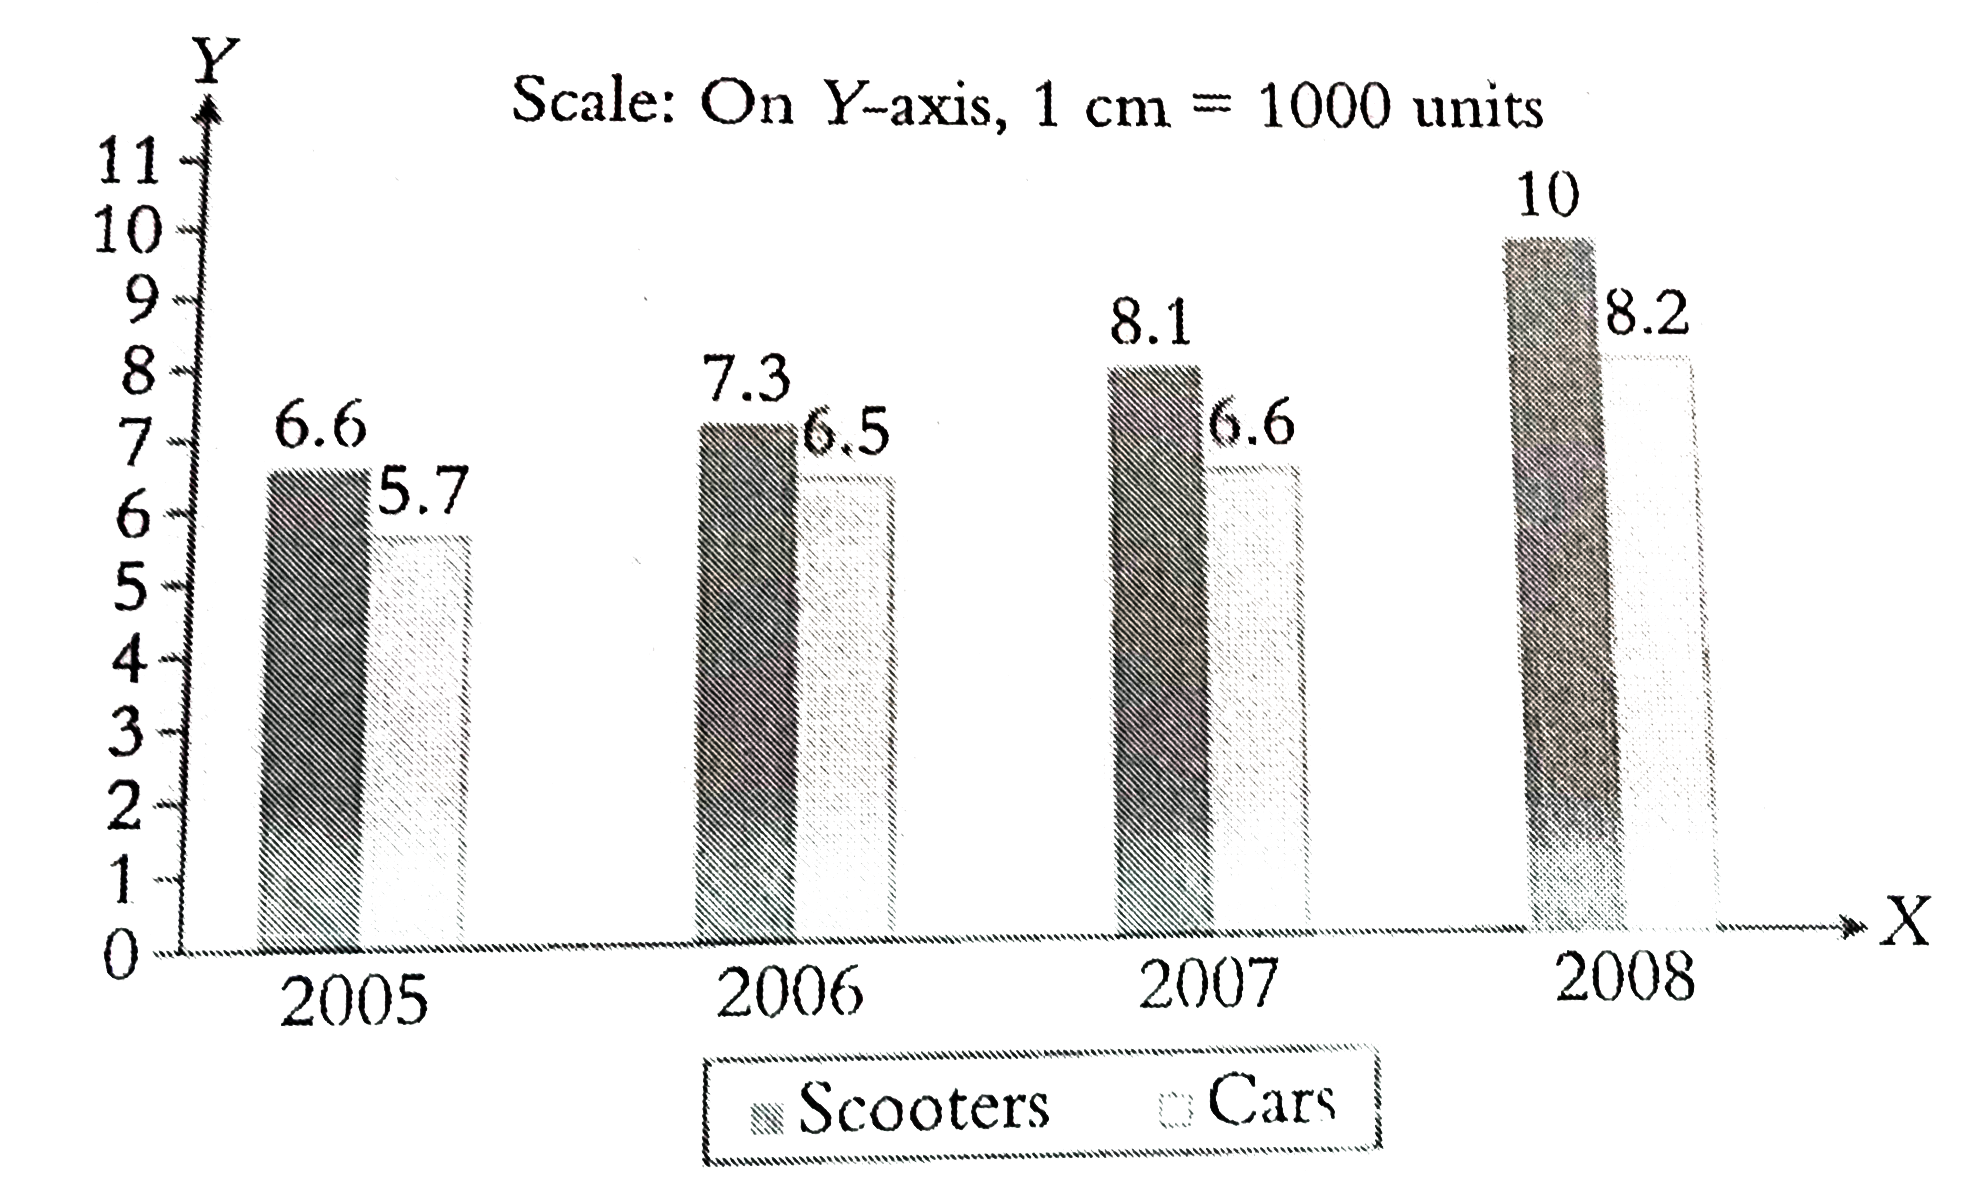
In which year is the difference between the sales of the scooters and the sales of cars the least ?
View Solution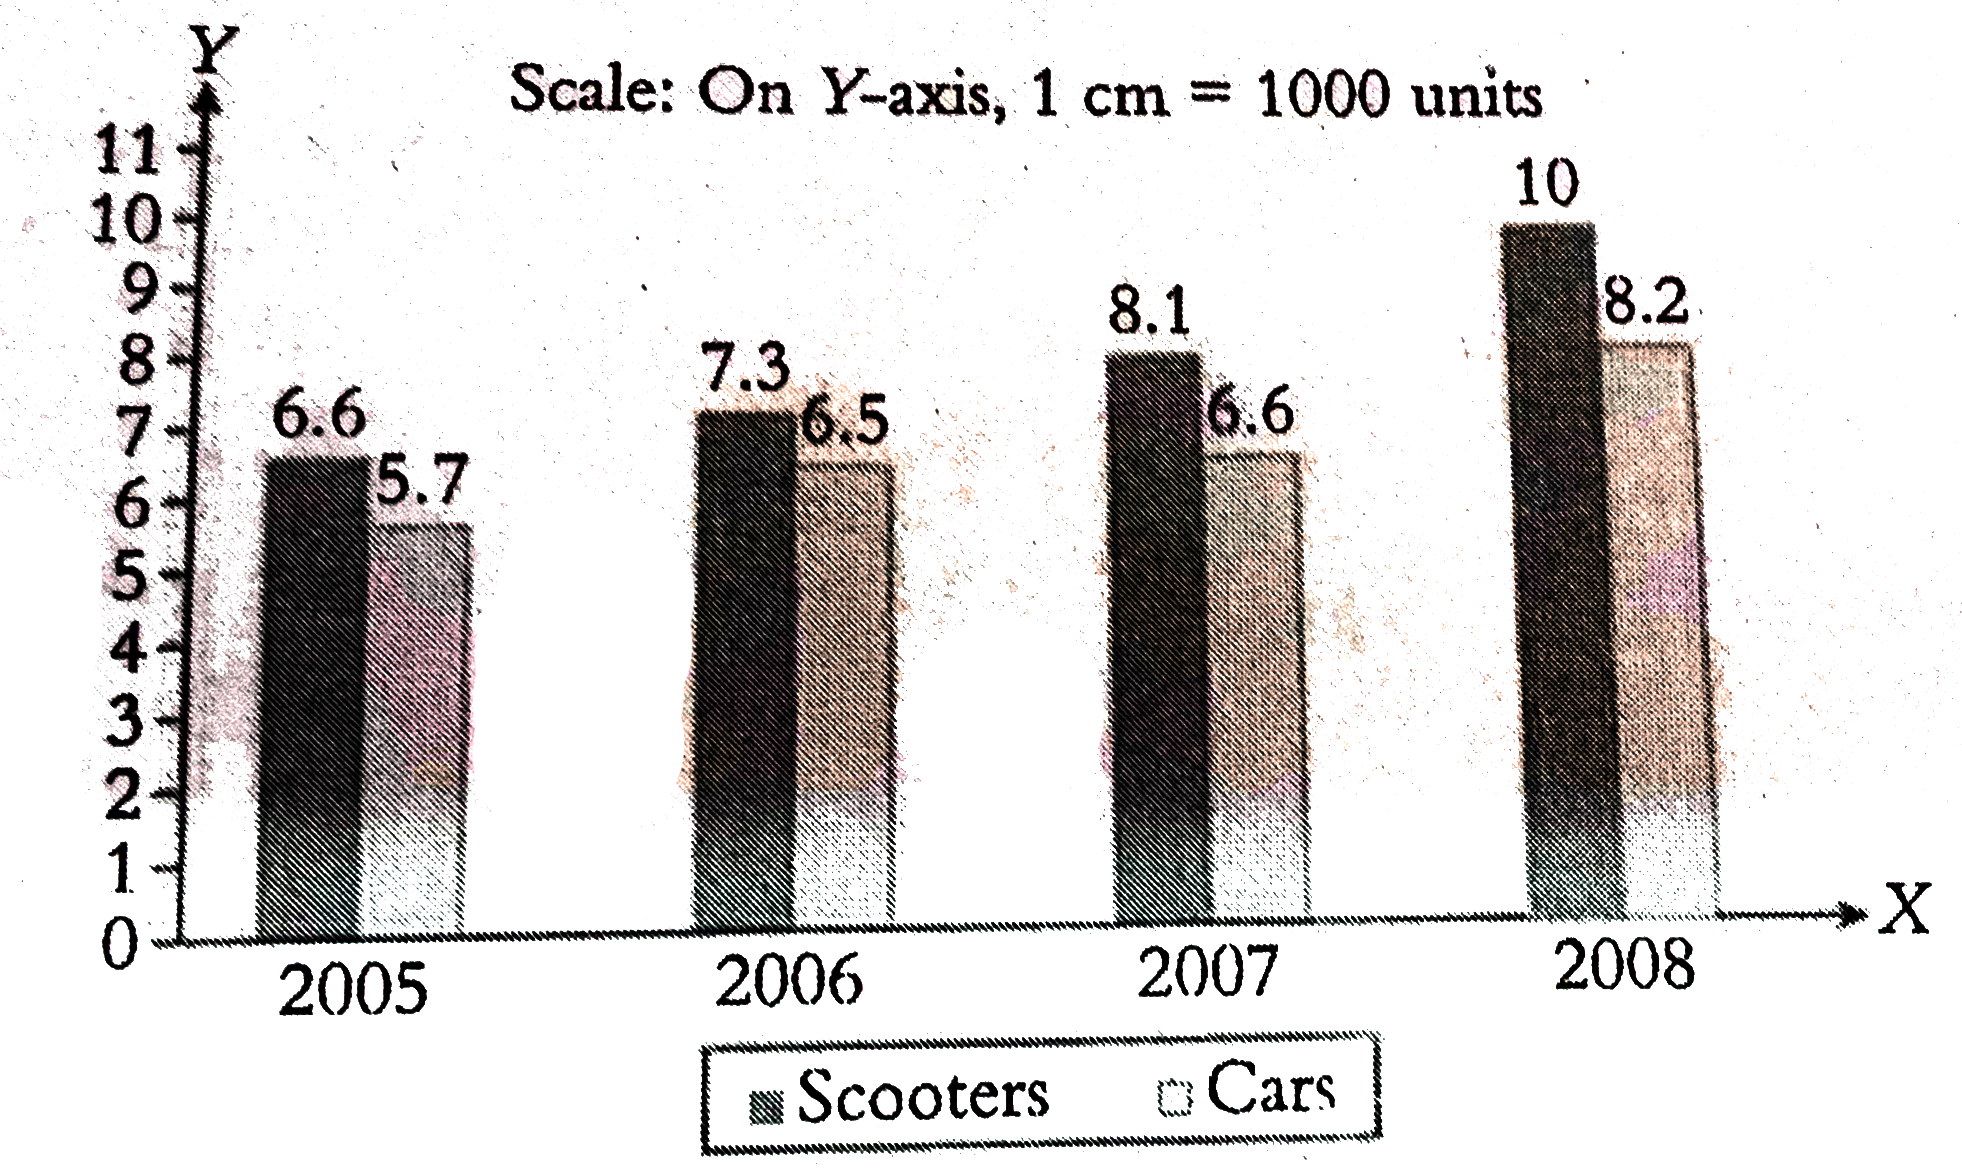
Total number of vehicles (scooters and cars) sold in the year 2005 and 2006 is ______.
View Solution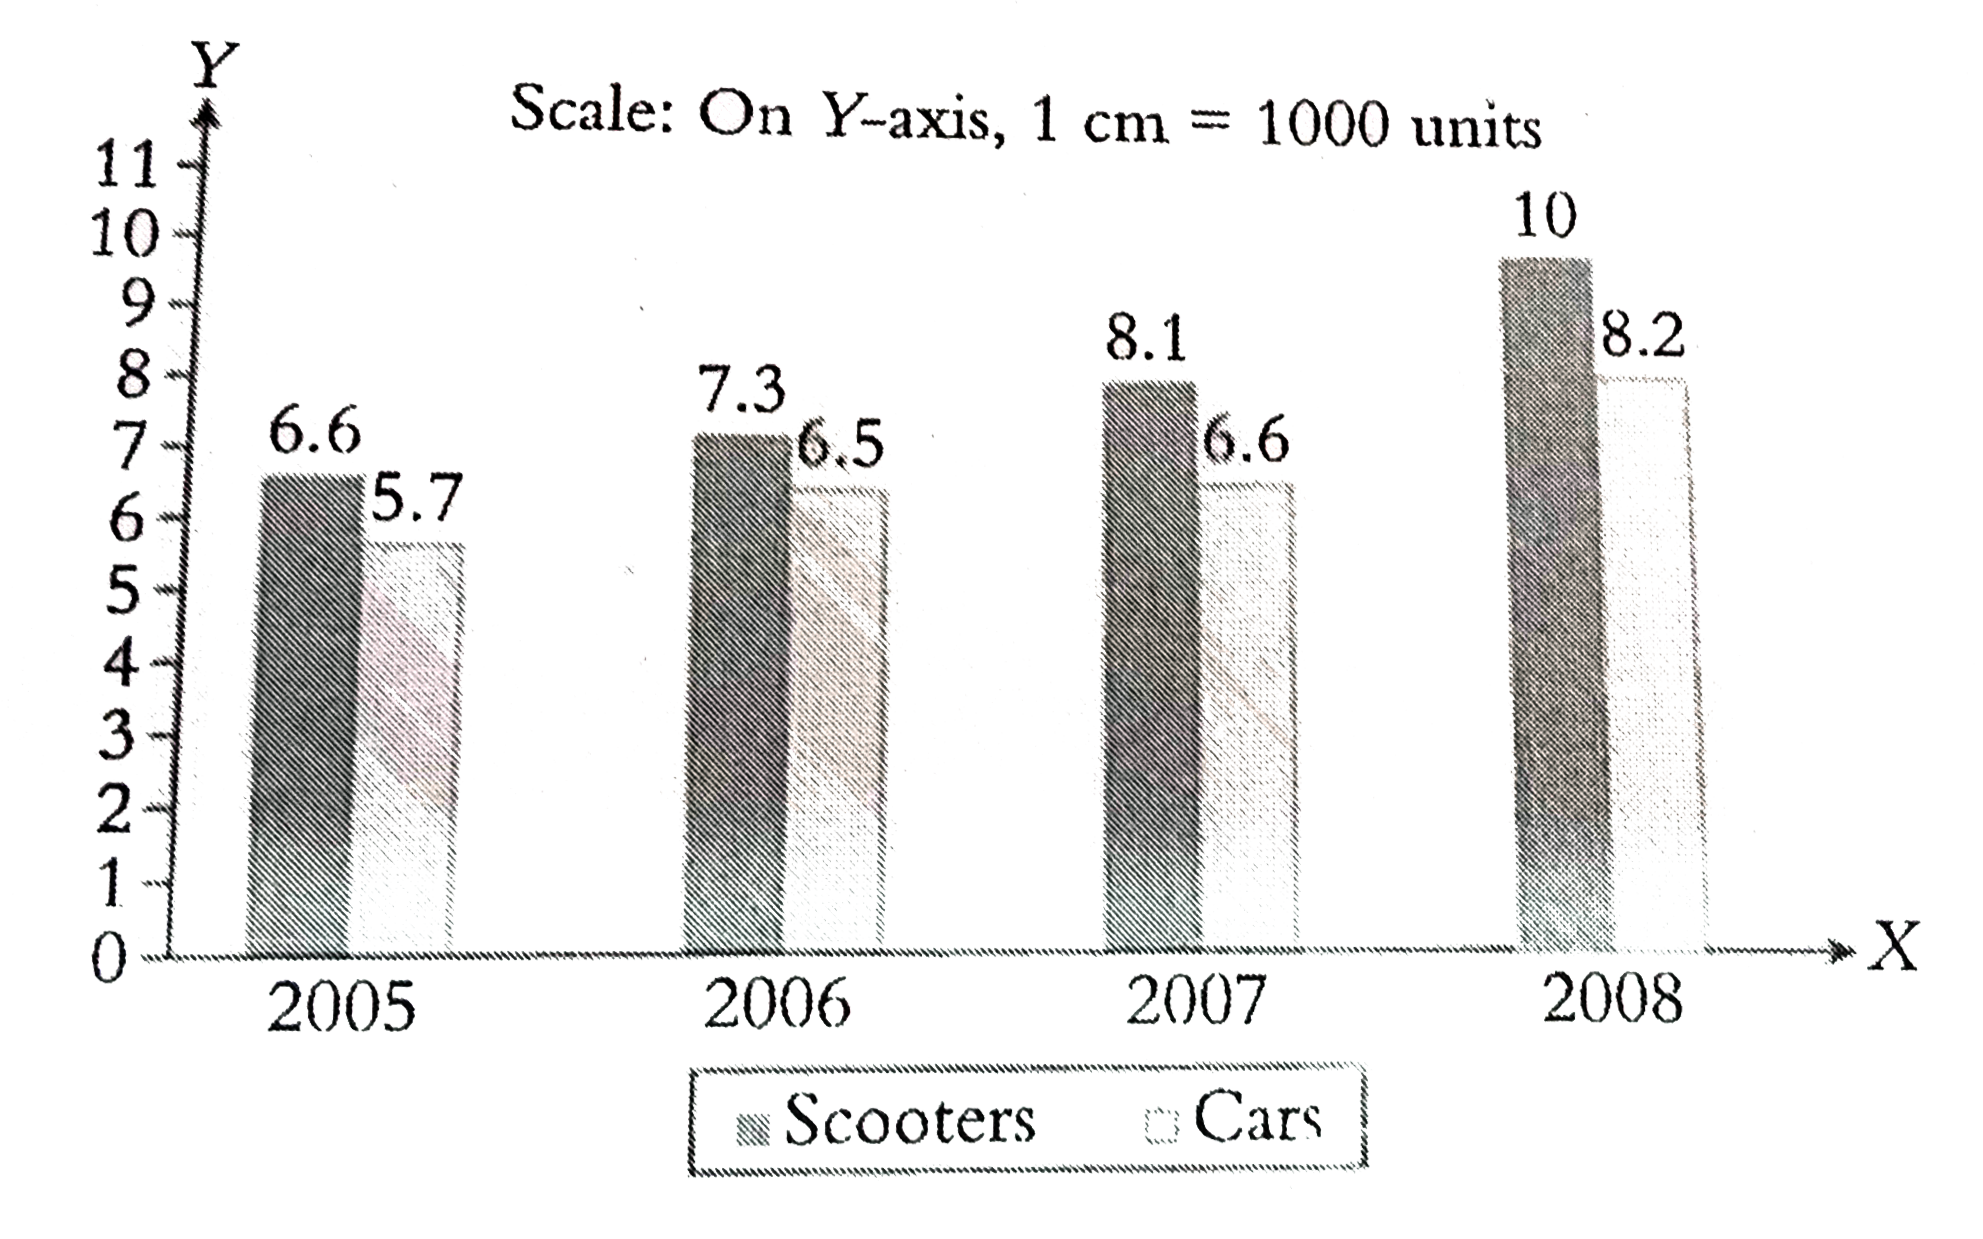
Find the maximum difference between sales of scooters and that of cars, in ant year, in the given period.
View Solution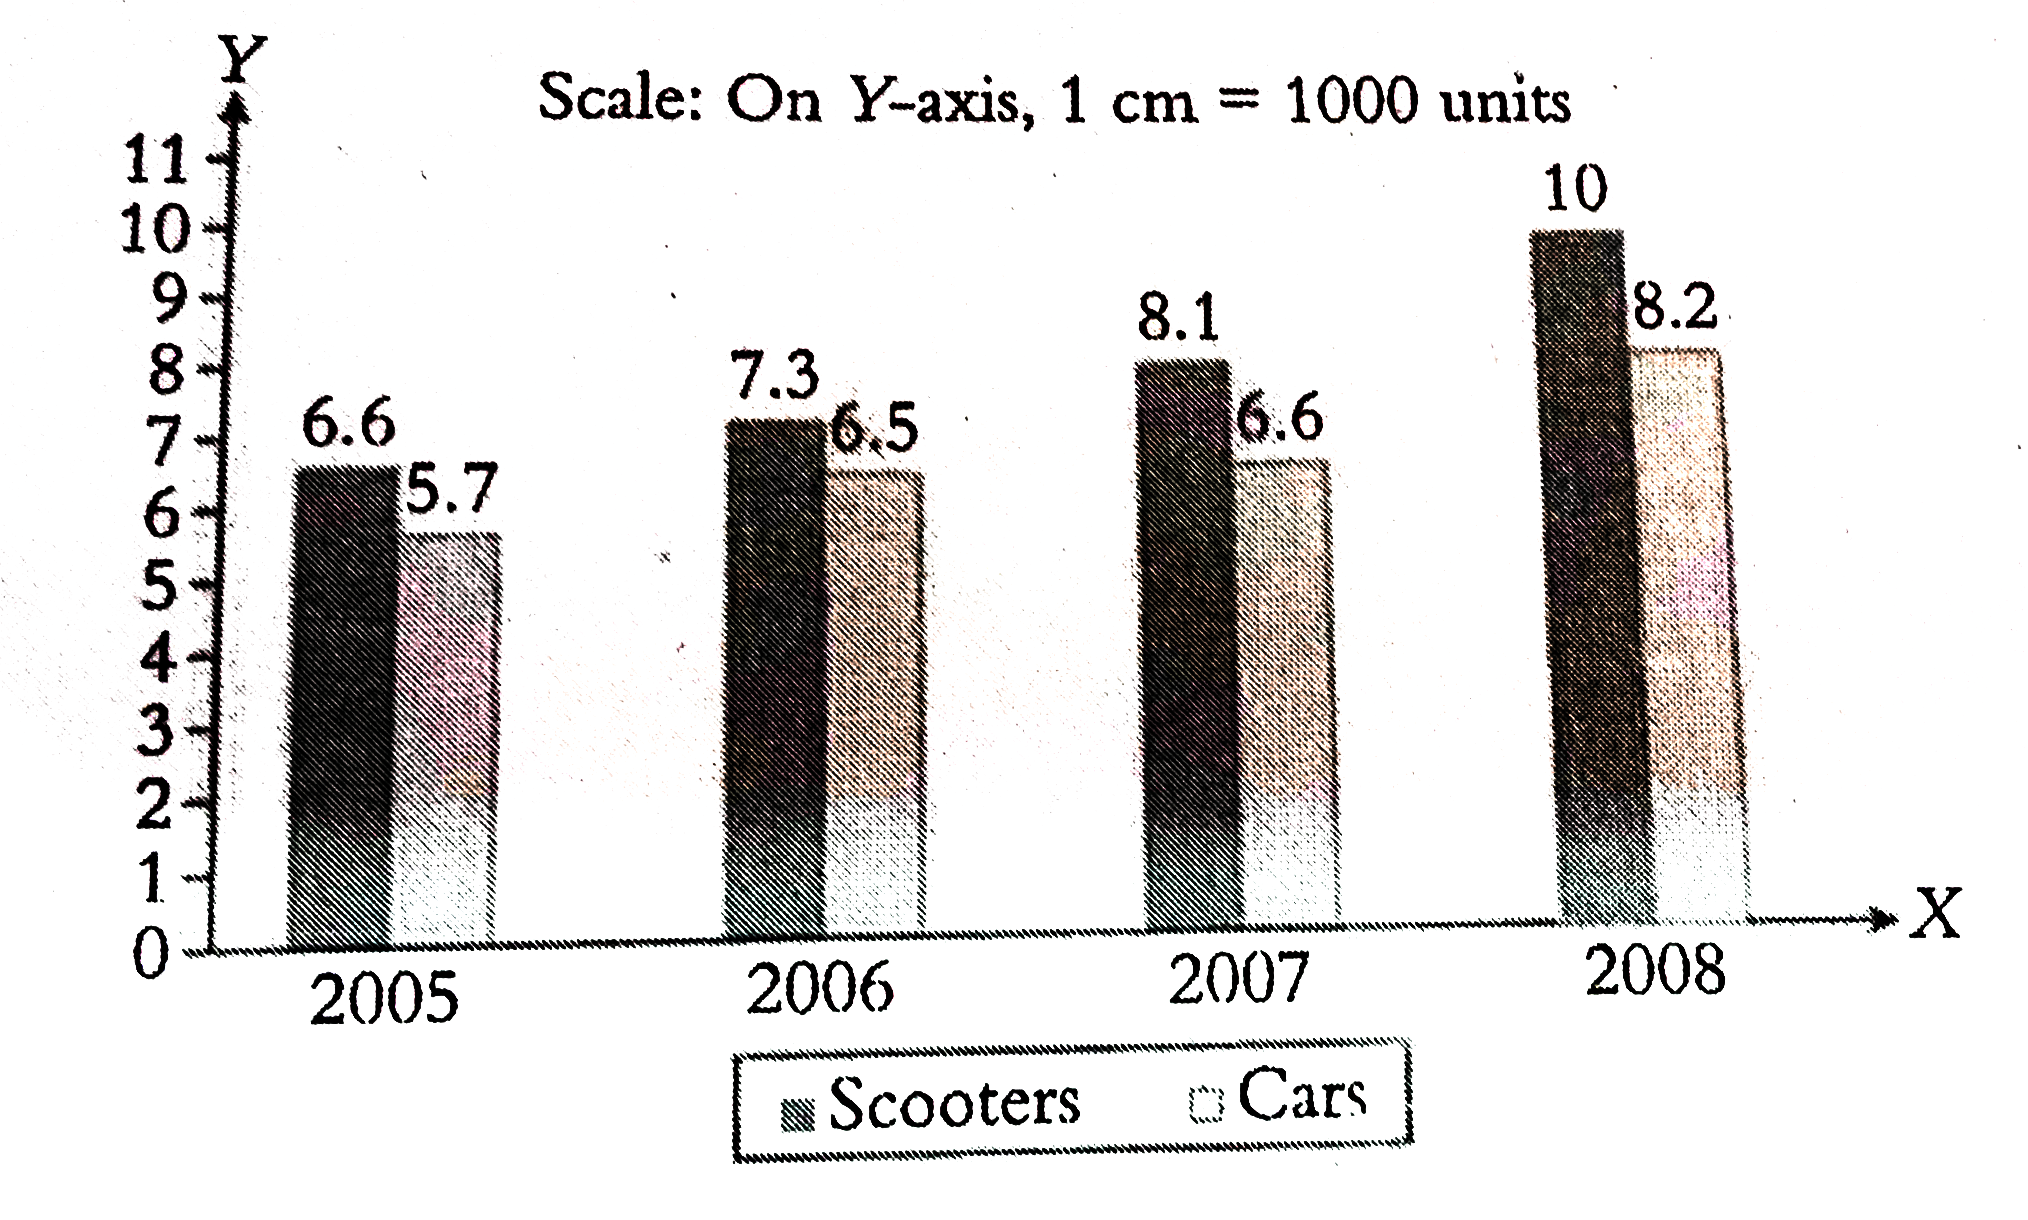
Find the total number of scooters sold in the four years.
View Solution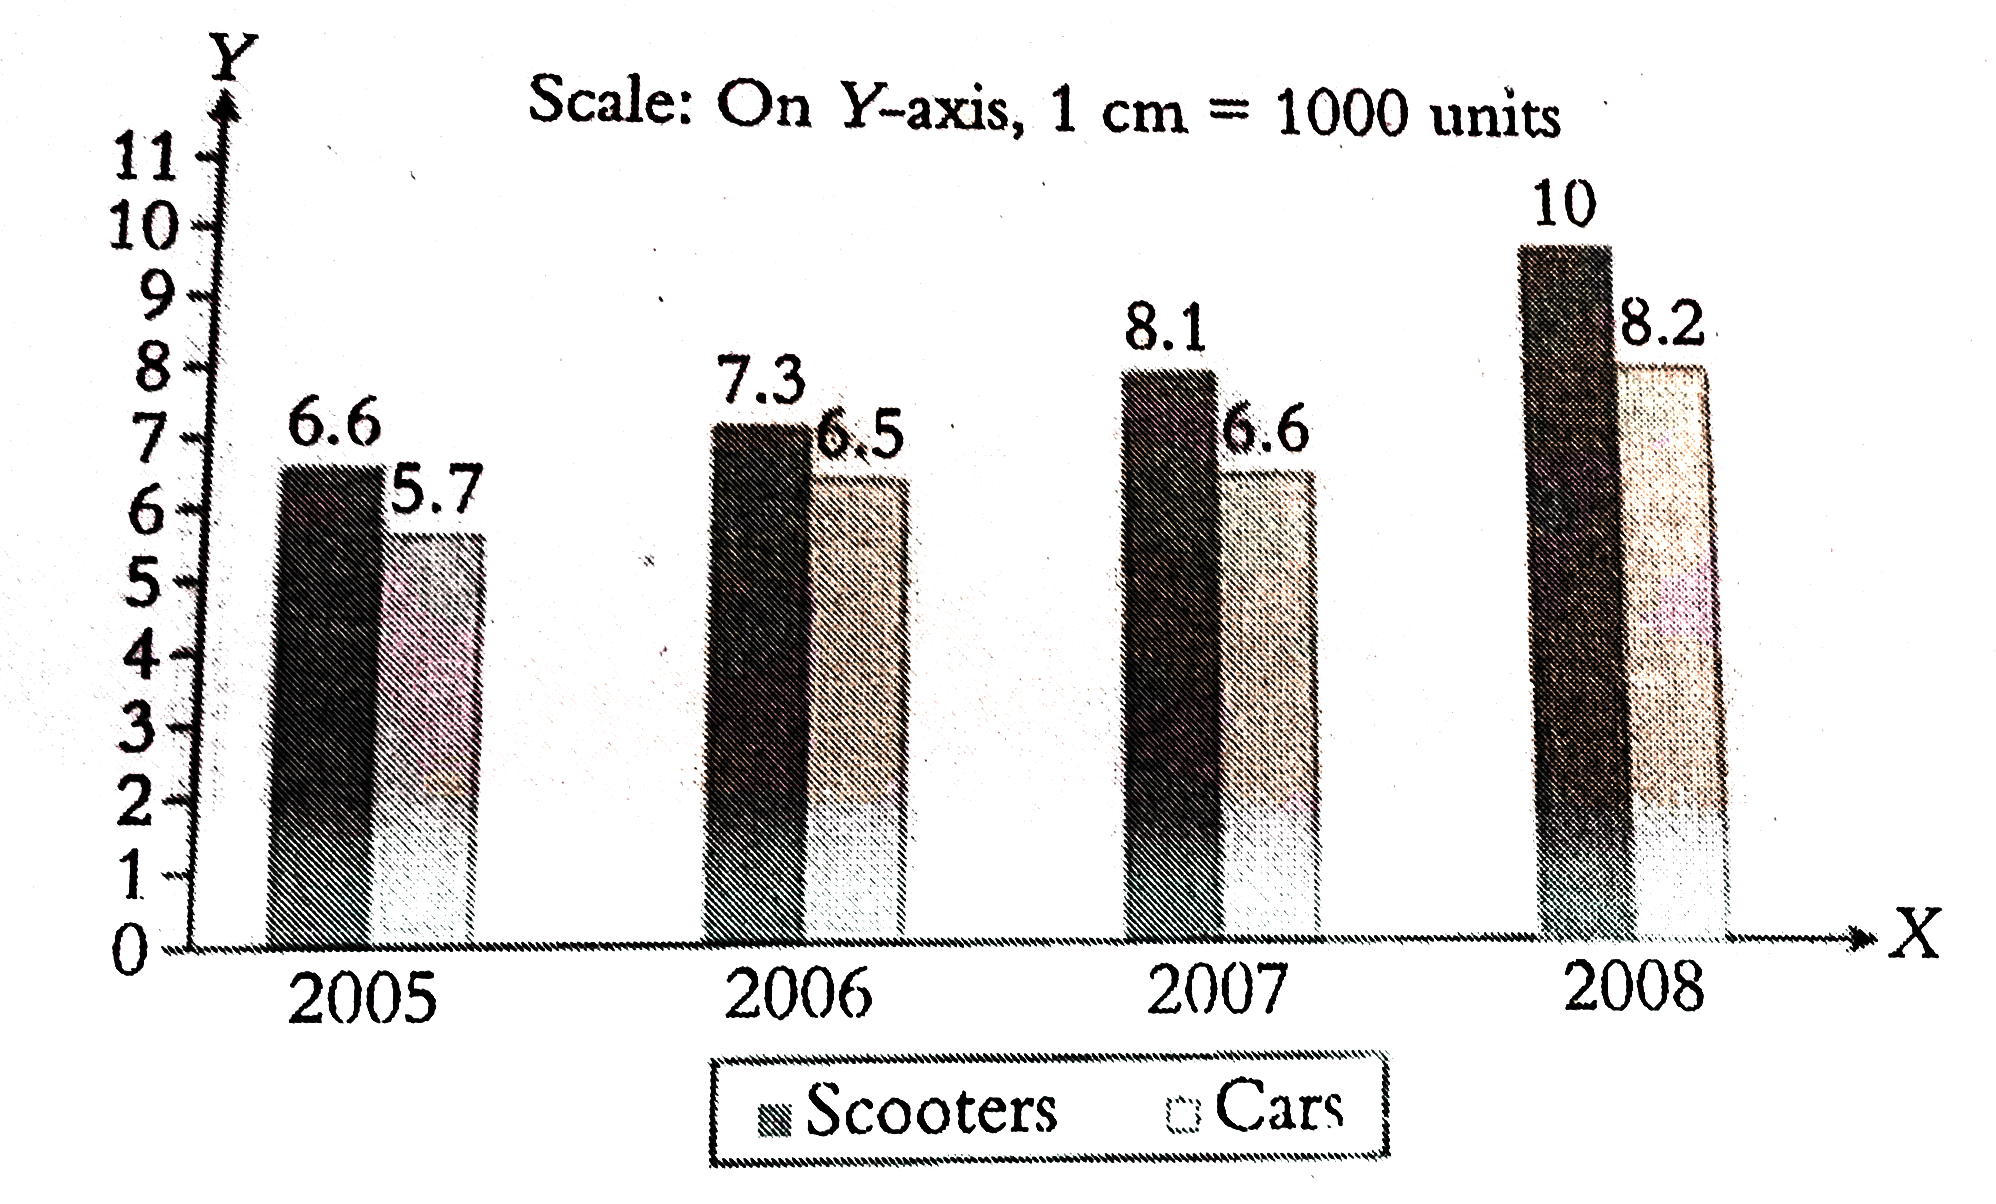
Find the ratio between the total number of vehicles sold (scooters and cars) in the year 2006 and that in the year 2008.
View SolutionThere are 10 cards numbered from 1 to 10 in a box. If a card is drawn randomly, then find the probability of getting an even numbered card.
View SolutionThe mode of the data 48, 45, 49, 51, 46, 48, 47, 49, 48, and 51 is ______.
View SolutionWhen a dice is rooled, find the probability of getting an even prime number.
View SolutionThe range of 12 observations is 60. If the least observation is 90, then find the greatest observation.
View SolutionFind the median of the data 35, 28, 49, 56, 79, 81, 73 and 80.
View SolutionThere are 20 marbles in a box which are marked with distinct numbers from 1 to 20. If a marble is drawn, then find the probability that the marble being numbered as a multiple of 5.
View SolutionThe mode of the data 35, 25, 26, 33, 31, x, and 30 is 26, then x is ________.
View SolutionThe median of the data 18, 42, 31, 25, 26, 38 and 43 is _______.
View SolutionThe sum of 20 observation is 500, then the mean is ______.
View SolutionThere are 100 cards numbered from 1 to 100 in a box. If a card is drawn from the box and the probability of an event is 1/2, then the number of favourable cases to the event is ________.
View Solution
Very Short Answer Type questions and complete solutions for chapter STATISTICS of PEARSON IIT JEE FOUNDATION of Class 7
All Exercises from PEARSON IIT JEE FOUNDATION Class 7 MATHS STATISTICS
- CONCEPT APPLICATION (LEVEL 1)
- CONCEPT APPLICATION (LEVEL 2)
- CONCEPT APPLICATION (LEVEL 3)
- CONCEPT APPLICATION Level - 1
- Essay Type
- Example
- Level 2
- Level 3
- Short Answer Type
- TEST YOUR CONCEPTS (Essay Type Questions)
- TEST YOUR CONCEPTS (Short Answer Type Questions)
- TEST YOUR CONCEPTS (Very Short Answer Type Questions)
- Very Short Answer Type