Complete Solutions to Example of chapter STATISTICS of Class 7 book with complete answers and questions
| Class 7 | MATHS |
| Chapter | STATISTICS |
| PEARSON IIT JEE FOUNDATION | Example |
| Number Of Questions | 39 |
| Academic Year | 2023-24 |
Given below is the data showing the number of children in a family in a locality of 15 families.
Prepare the frequency table for the data 1, 3, 5, 4, 3, 2, 1, 1, 3, 2, 2, 1, 4, 2, and 1.
View SolutionRepresent the following frequency distribution as a bar graph :
`{:(bar("Value of Variable (x) 1 3 4 6 7")),(ul("Frequency (F) 4 3 2 5 1")):}`
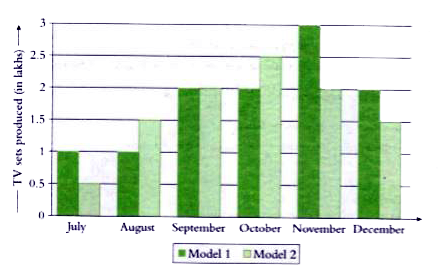
View SolutionTwo different models of TV sets are produced in a factory and are given below as a double bar graph. Read the data and answer the following questions :
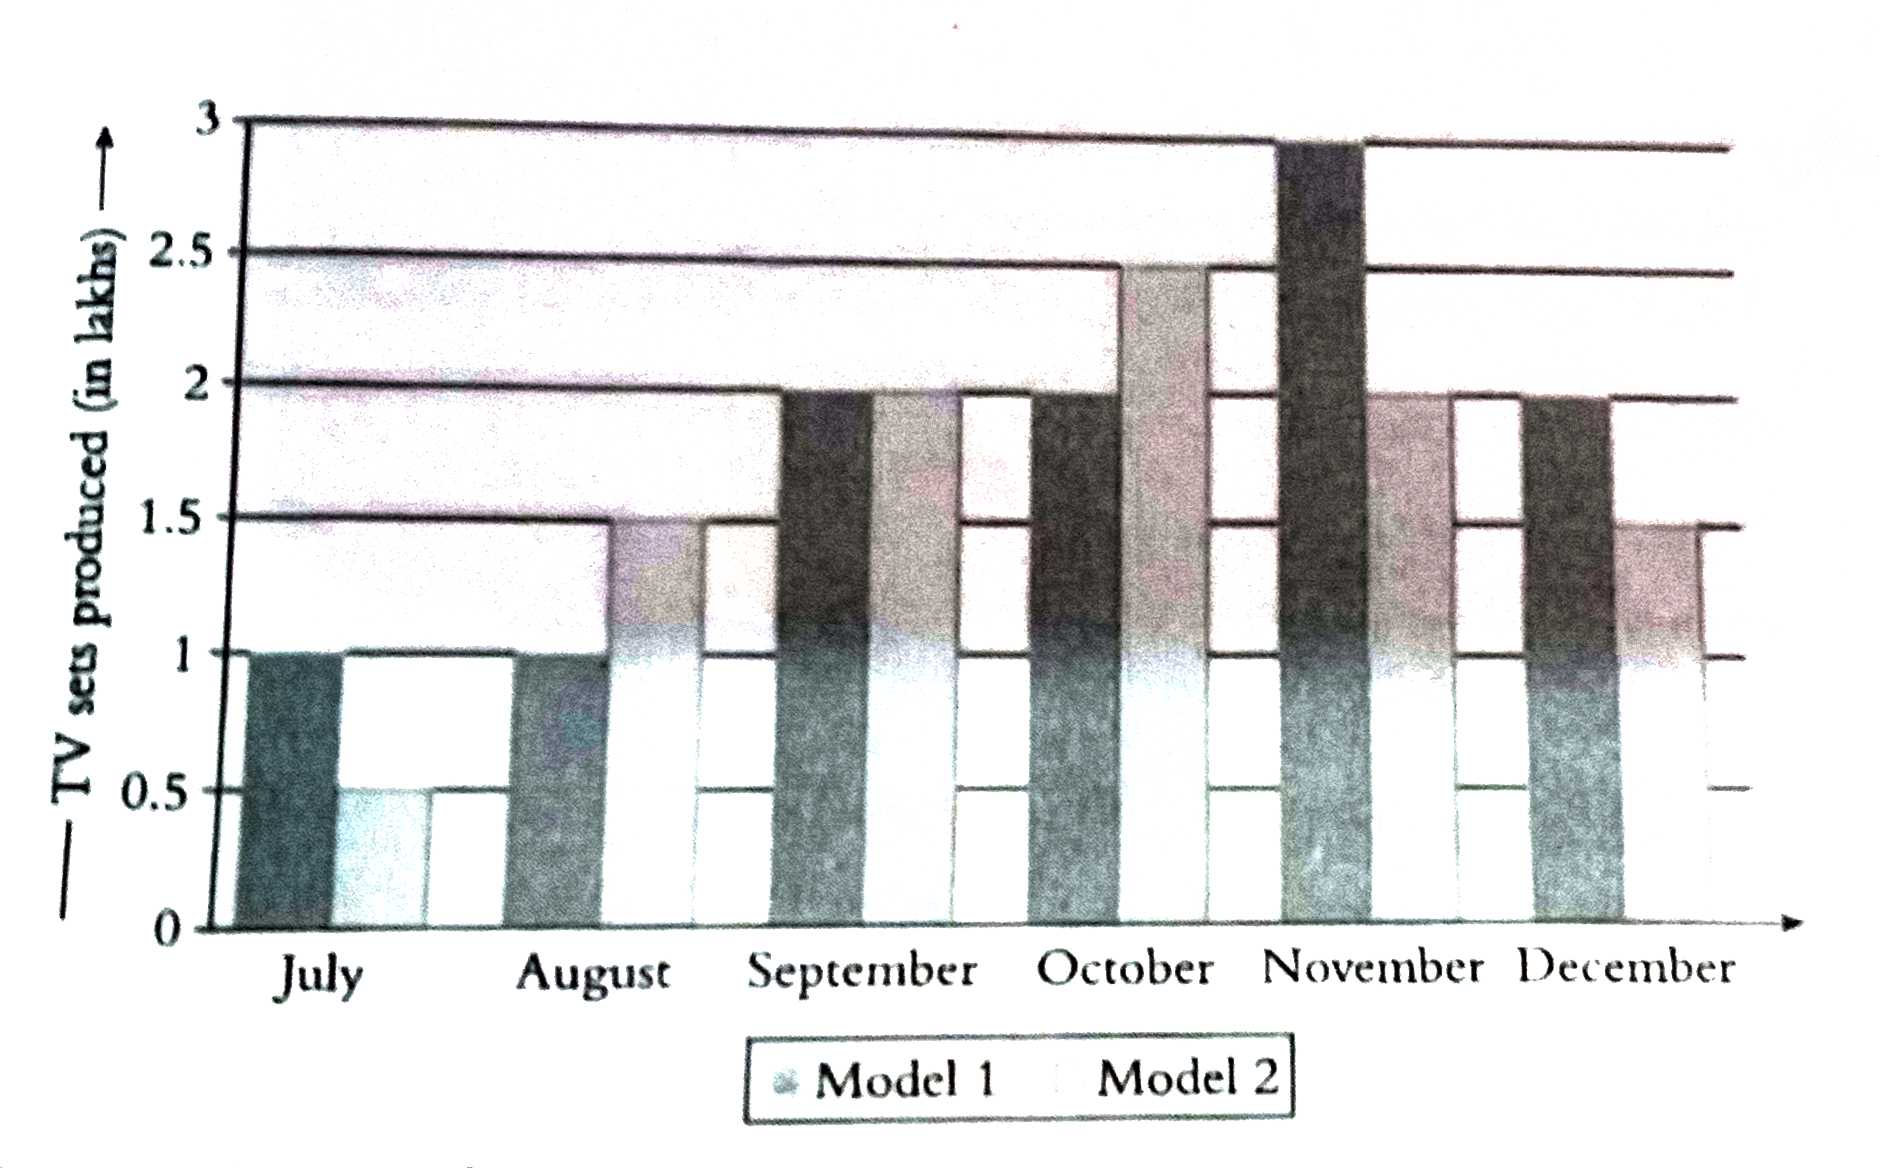
(A) What information does the graph represent ?
(b) In which month, both the models of TV sets produced are equal ?
(c) In which month, both the model of TV sets produced are maximum ?
(d) In which month, both the models of TV sets produced are minimum and how many are they ?
View SolutionA person spends his time every day as shown below :
`{:(bar("Activity Study Games Yoga and Sleeping Miscellaneous")),(" Dance"),(ul("Number of hours 9 3 3 7 2 ")):}`
Present the data in pie chart.
View SolutionDraw a line graph to represent the runs made by different batsmen in a match whose details are given in the following table :
`{:(bar("Player "P_(1)" "P_(2)" "P_(3)" "P_(4)" "P_(5)" "P_(6)" "P_(7))),(ul("Runs made 30 45 55 20 40 35 50")):}`
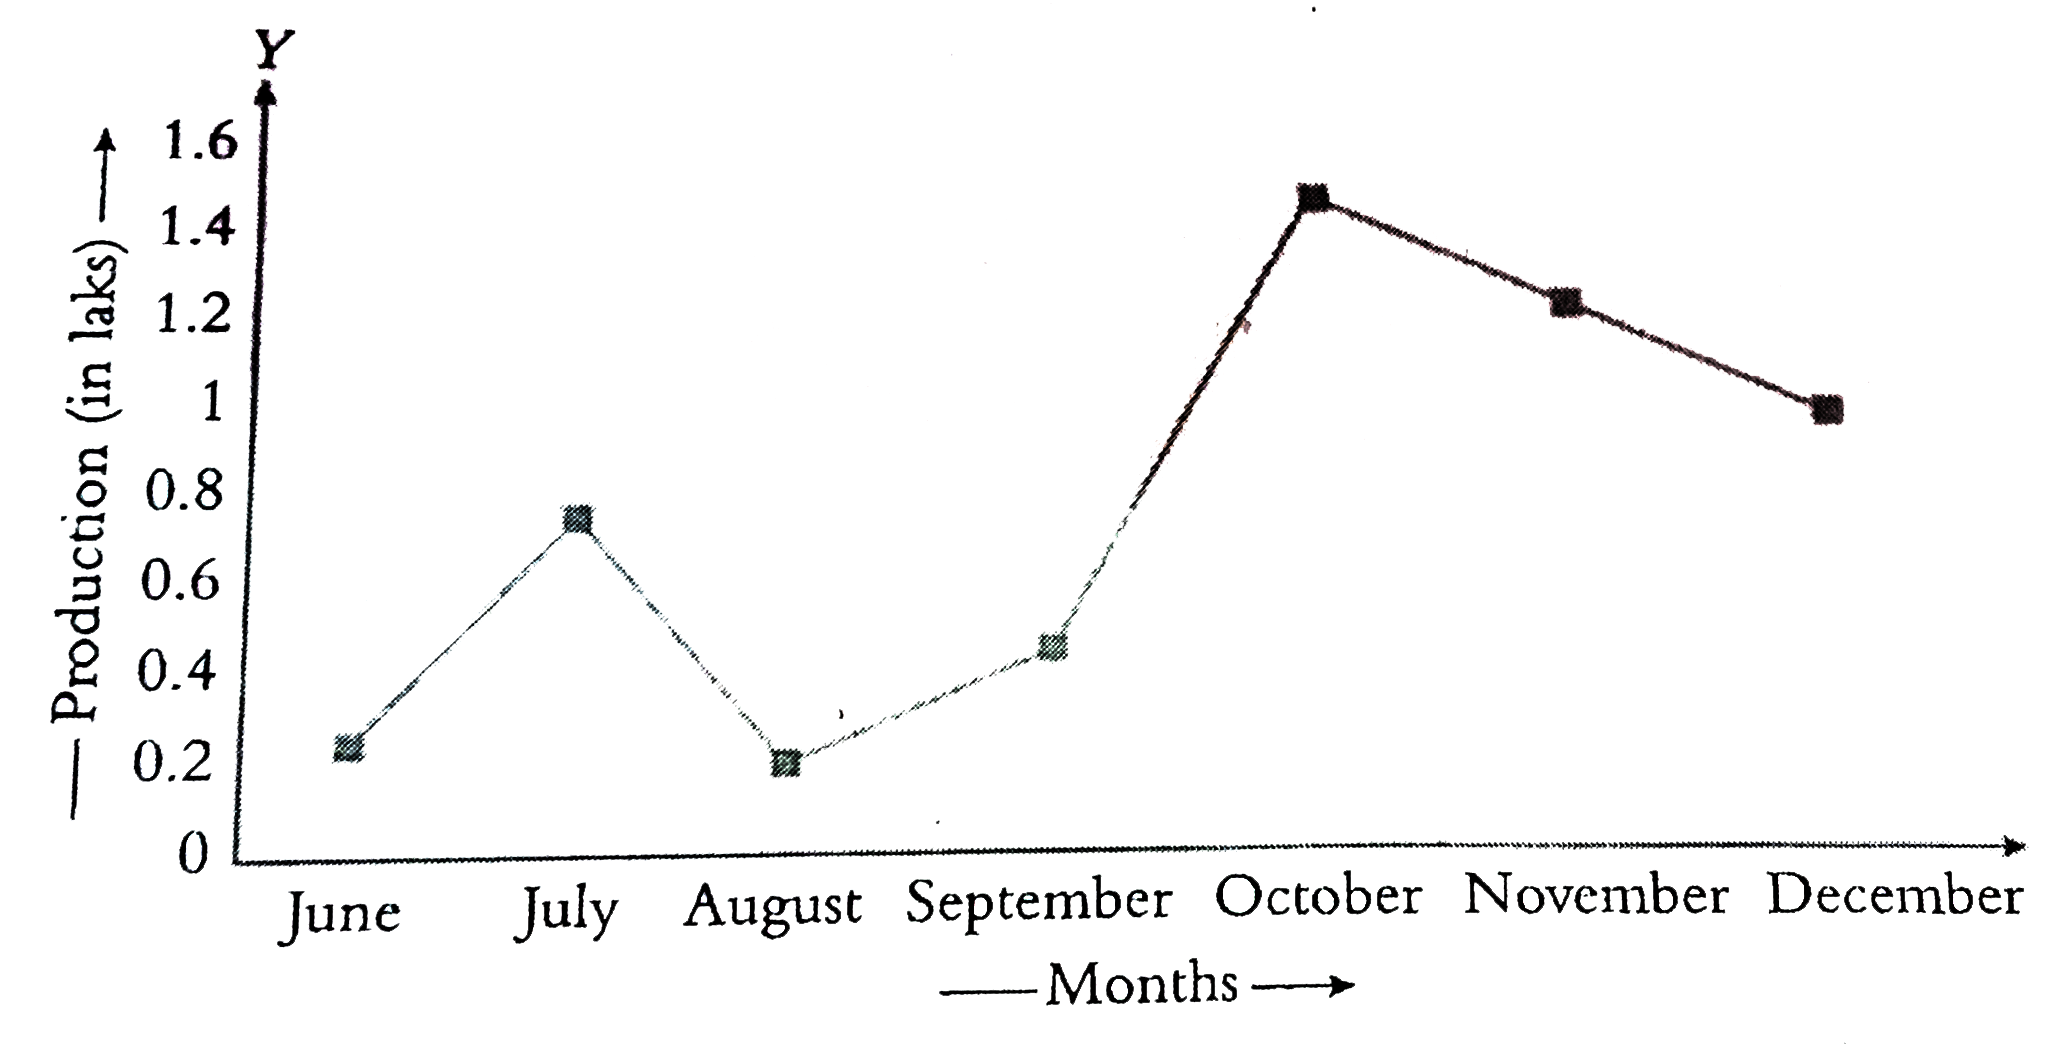
View SolutionThe line graph given below shows the production of a particular model of bike [roduced in different months. Read the line graph and answer the following questions :
(a) In which month is the production maximum ?
(b) In which month is the production least ?
(c) In which two successive months has the production increased ?
(d) In which two successive months has the production decreased ?
View SolutionFind the mean of the first 10 prime numbers.
View SolutionIf the mean of the data 9, 17, 18, 14, x, 16, 15, 11 and 12 is x, then find the value of x.
View SolutionThere are 7 observations in the data and their mean is 11. If each observation is multiplied by 2, then find the new mean.
View SolutionThe marks (maximum marks 100) obtained by 20 students in a test are given below :
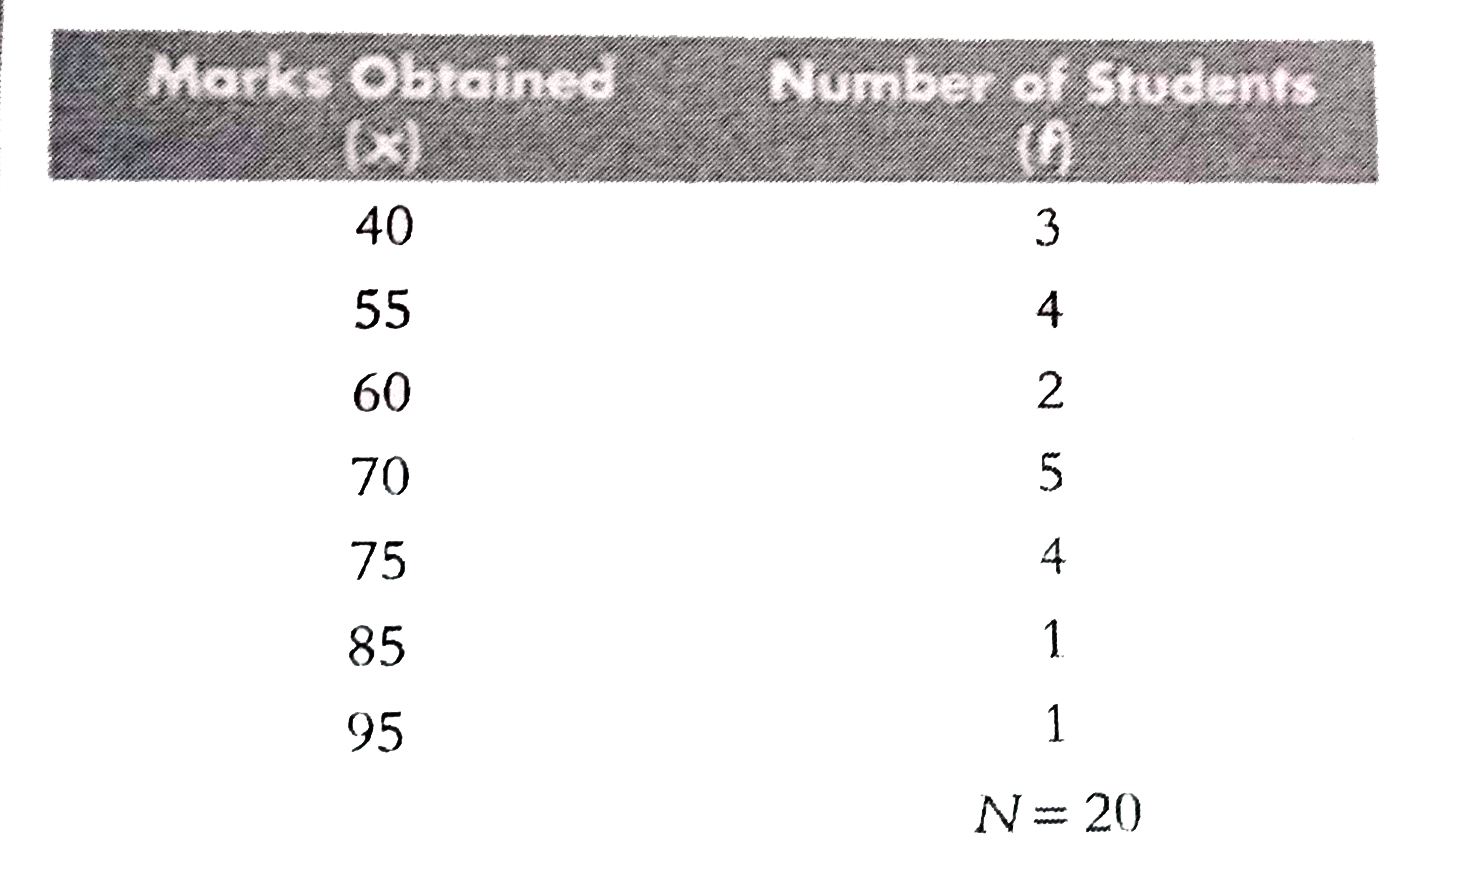
Find the mean marks of the 20 students.
View SolutionFind the median of the following observation 12, 18, 11, 21, 32, 16, and 22.
View SolutionFind the median of the data 21, 33, 15, 19, 26, 32, 14 and 24.
View Solutionthe median of 11 observations is 10. Find the maximum numbe of possible observations in the data which are less than 10.
View SolutionFind the mode of the observations 8, 2, 3, 4, 6, 3, 2, 4, 5, 4, 1, 1, 4, 6, and 8.
View SolutionThe mode of the unimodal data 7, 8, 9, 8, 9, 10, 9, 10, 11, 10, 11, 12 and x is 10. Find the value of x.
View SolutionThere are 10 marbles in a box which are marked with the distinct numbers from 1 to 10. If a marble is drawn, then what is the probability of getting prime numbered marble ?
View SolutionThere are 10 marbles in a box which are marked with the distinct numbers from 1 to 10. If a marble is drawn, then what is the probability of getting a marble being a number multiple of 3 ?
View SolutionGiven below is the data showing the number of children in a family in a locality of 15 families.
Prepare the frequency table for the data 1, 3, 5, 4, 3, 2, 1, 1, 3, 2, 2, 1, 4, 2, and 1.
View SolutionRepresent the following frequency distribution as a bar graph:

View SolutionTwo different models of TV sets are produced in a factory and are given below as a double bar graph. Read the data and answer the following questions:
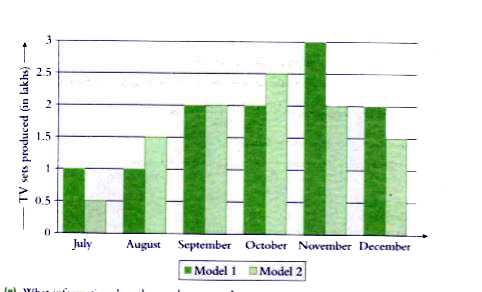
What information does the graph represent?
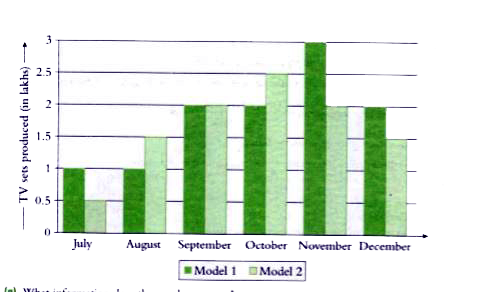
View SolutionTwo different models of TV sets are produced in a factory and are given below as a double bar graph. Read the data and answer the following questions:
In which month, both the models of TV sets produced are equal?
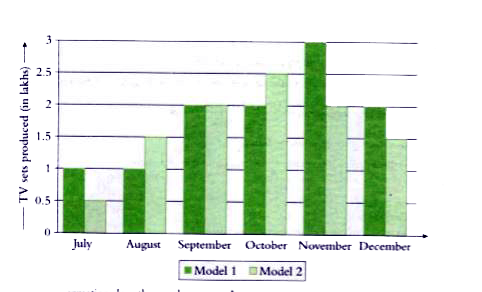
View SolutionTwo different models of TV sets are produced in a factory and are given below as a double bar graph. Read the data and answer the following questions:
In which month, both the models of TV secs produced are maximum?
View SolutionTwo different models of TV sets are produced in a factory and are given below as a double bar graph. Read the data and answer the following questions:
In which month, both the models of TV sets produced are minimum and how many are they?
View SolutionDraw a line graph to represent the runs made by different batsmen in a match whose details are given in the following table:

View SolutionThe line graph given below shows the production of a particular model of bike produced in different months. Read the line graph and answer the following questions:
In which month is the production maximum?
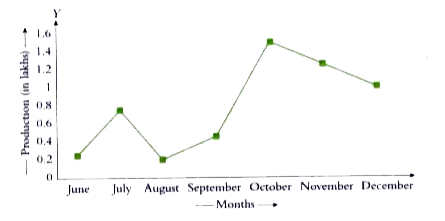
View SolutionThe line graph given below shows the production of a particular model of bike produced in different months. Read the line graph and answer the following questions:
In which month is the production least?
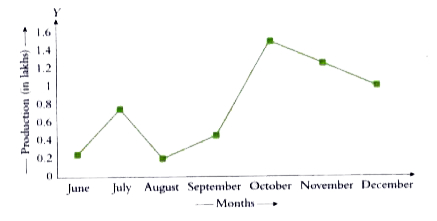
View SolutionThe line graph given below shows the production of a particular model of bike produced in different months. Read the line graph and answer the following questions:
In which two successive months has the production increased?
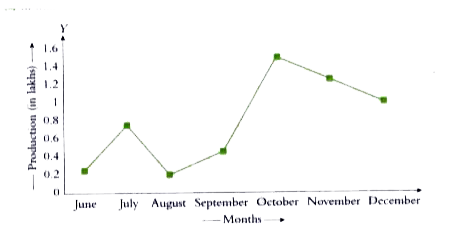
View SolutionThe line graph given below shows the production of a particular model of bike produced in different months. Read the line graph and answer the following questions:
In which two successive months has the production decreased?
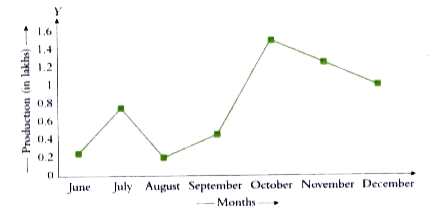
View SolutionFind the mean of the first 10 whole numbers.
View SolutionIf the mean of the data 9, 17, 18, 14, x, 16, 15, 11 and 12 is x, then find the value of x.
View SolutionMean of 9 observations in the data is 14. If each observation is multiplied by 4. then find the new mean is ____.
View SolutionThe marks (maximum marks 100) obtained by 20 students in a test are given below :

Find the mean marks of the 20 students.
View SolutionFind the median of the following observation 12, 18, 11, 21, 32, 16, and 22.
View SolutionFind the median of the data 56, 67, 54, 34, 78, 43, 23.
View Solutionthe median of 11 observations is 10. Find the maximum numbe of possible observations in the data which are less than 10.
View SolutionFind the mode of the observations 12, 8, 4, 8, 1, 8, 9, 11, 9, 10, 12, 8.
View SolutionThe mode of the unimodal data 7, 8, 9, 8, 9, 10, 9, 10, 11, 10, 11, 12 and x is 10. Find the value of x.
View SolutionThere are 10 marbles in a box which are marked with the distinct numbers from 1 to 10. If a marble is drawn, then what is the probability of getting a perfect squared marble?
View SolutionThere are 10 marbles in a box which are marked with the distinct numbers from 1 to 10. If a marble is drawn, then what is the probability of getting a marble being a odd number less than 8?
View Solution
Example questions and complete solutions for chapter STATISTICS of PEARSON IIT JEE FOUNDATION of Class 7
All Exercises from PEARSON IIT JEE FOUNDATION Class 7 MATHS STATISTICS
- CONCEPT APPLICATION (LEVEL 1)
- CONCEPT APPLICATION (LEVEL 2)
- CONCEPT APPLICATION (LEVEL 3)
- CONCEPT APPLICATION Level - 1
- Essay Type
- Example
- Level 2
- Level 3
- Short Answer Type
- TEST YOUR CONCEPTS (Essay Type Questions)
- TEST YOUR CONCEPTS (Short Answer Type Questions)
- TEST YOUR CONCEPTS (Very Short Answer Type Questions)
- Very Short Answer Type