Complete Solutions to CONCEPT APPLICATION Level - 1 of chapter STATISTICS of Class 7 book with complete answers and questions
| Class 7 | MATHS |
| Chapter | STATISTICS |
| PEARSON IIT JEE FOUNDATION | CONCEPT APPLICATION Level - 1 |
| Number Of Questions | 14 |
| Academic Year | 2023-24 |
If the mean of n observations is 12 and the sum of the observations is 132, then find the value of n.
View SolutionThe range of the data 14, 15, 18, 25, 11, 40, 36, 30 is ______.
View SolutionThe median of 5, 7, 9, 10, 11 is _____.
View SolutionIn a pie chart, the sum of the angles of all its components is ______.
View SolutionIn a bar graph, the height of a bar is proportional to the _______.
View Solution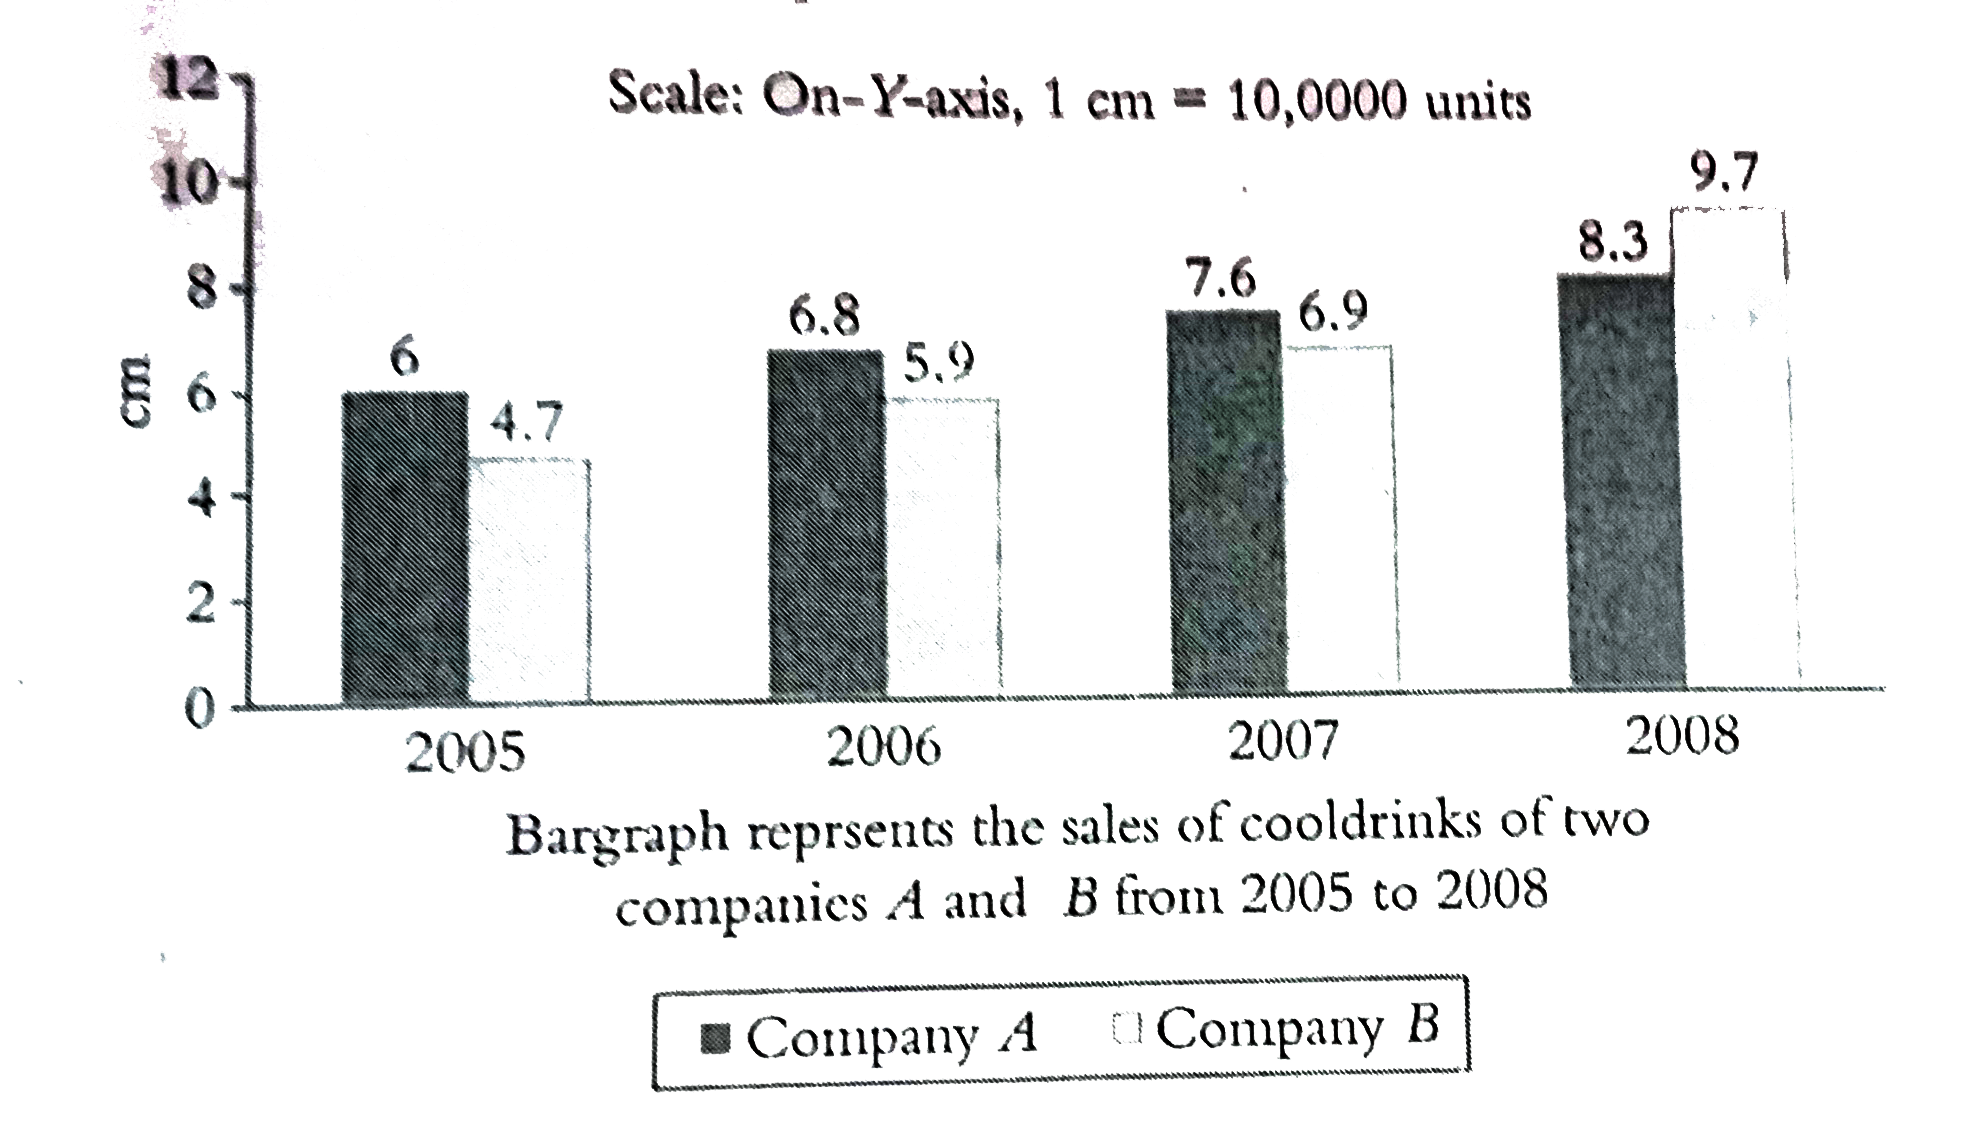
In which year is the difference between the sales of A and the sales of B the highest ?
View Solution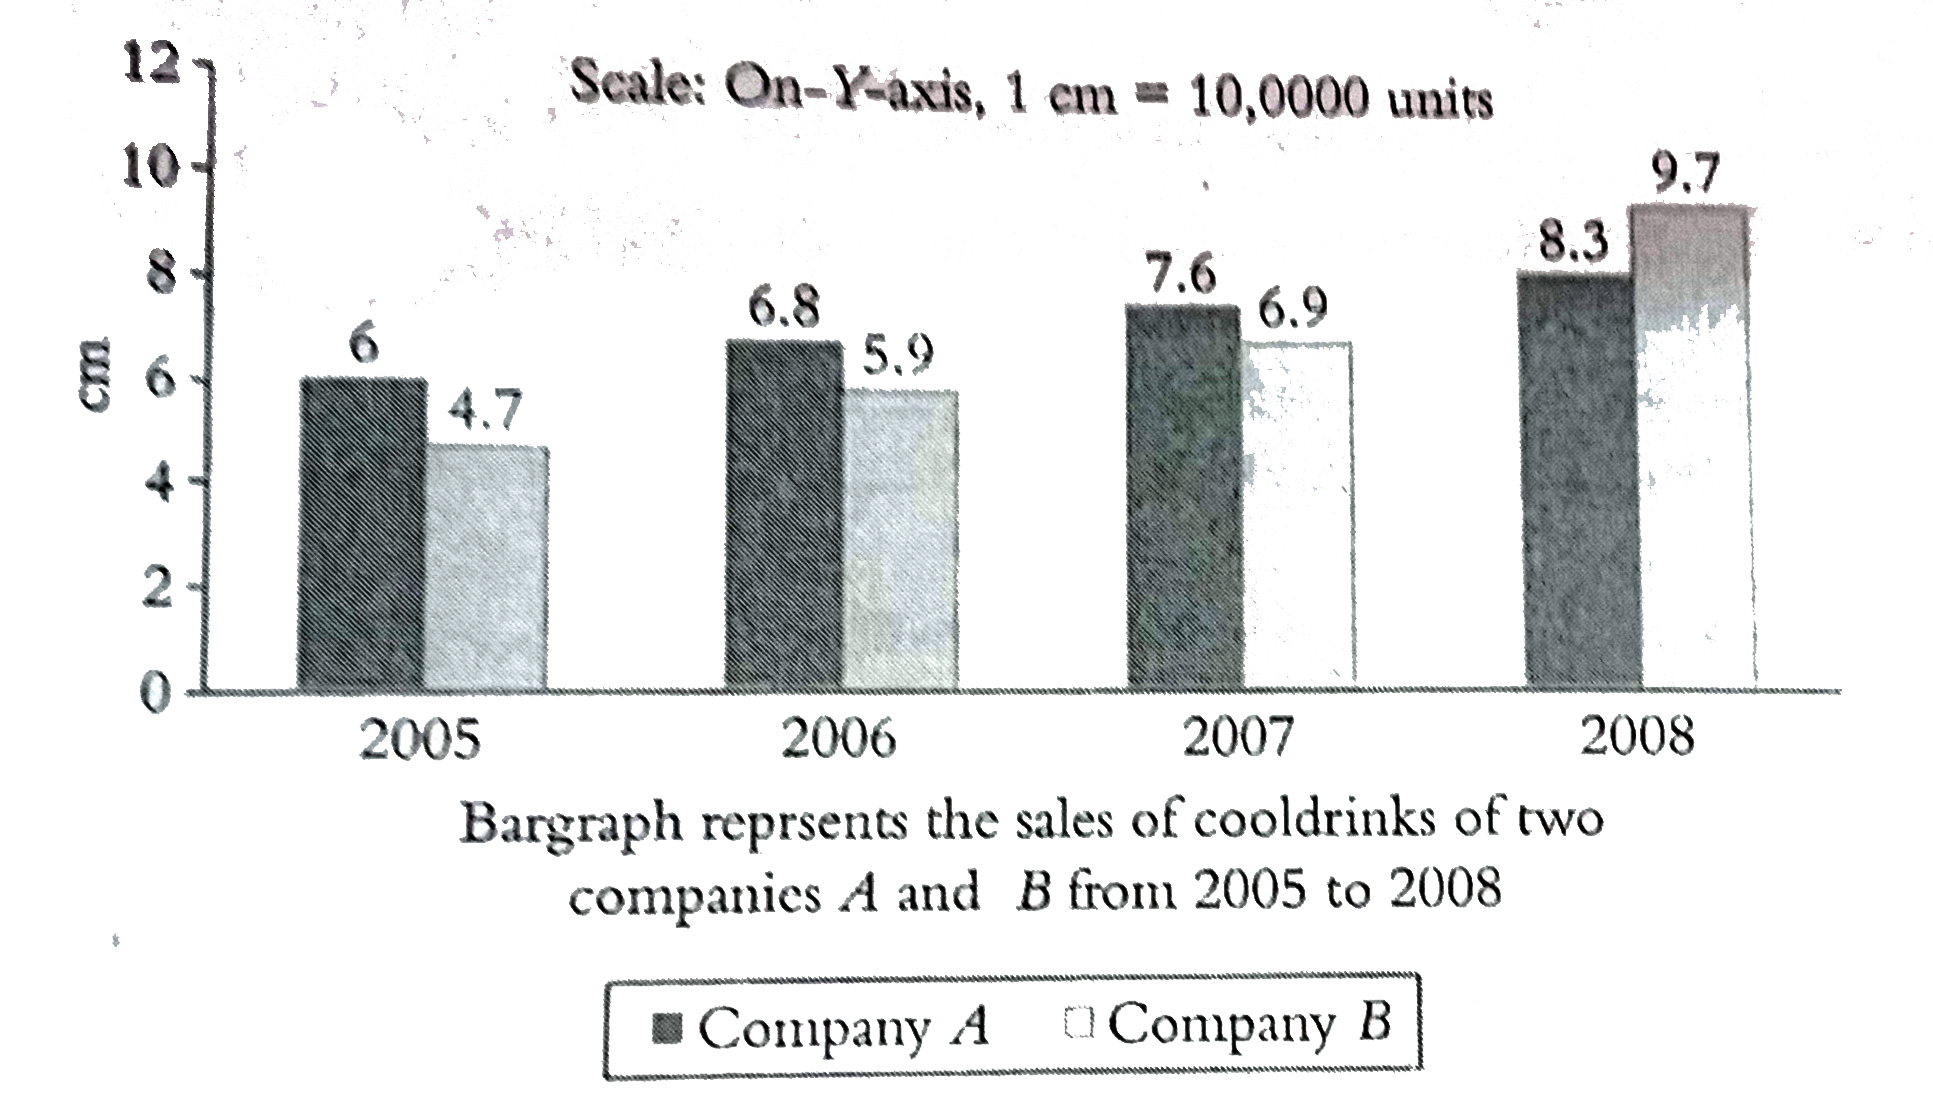
Total sales of A and B in the year 2006 is _____.
View Solution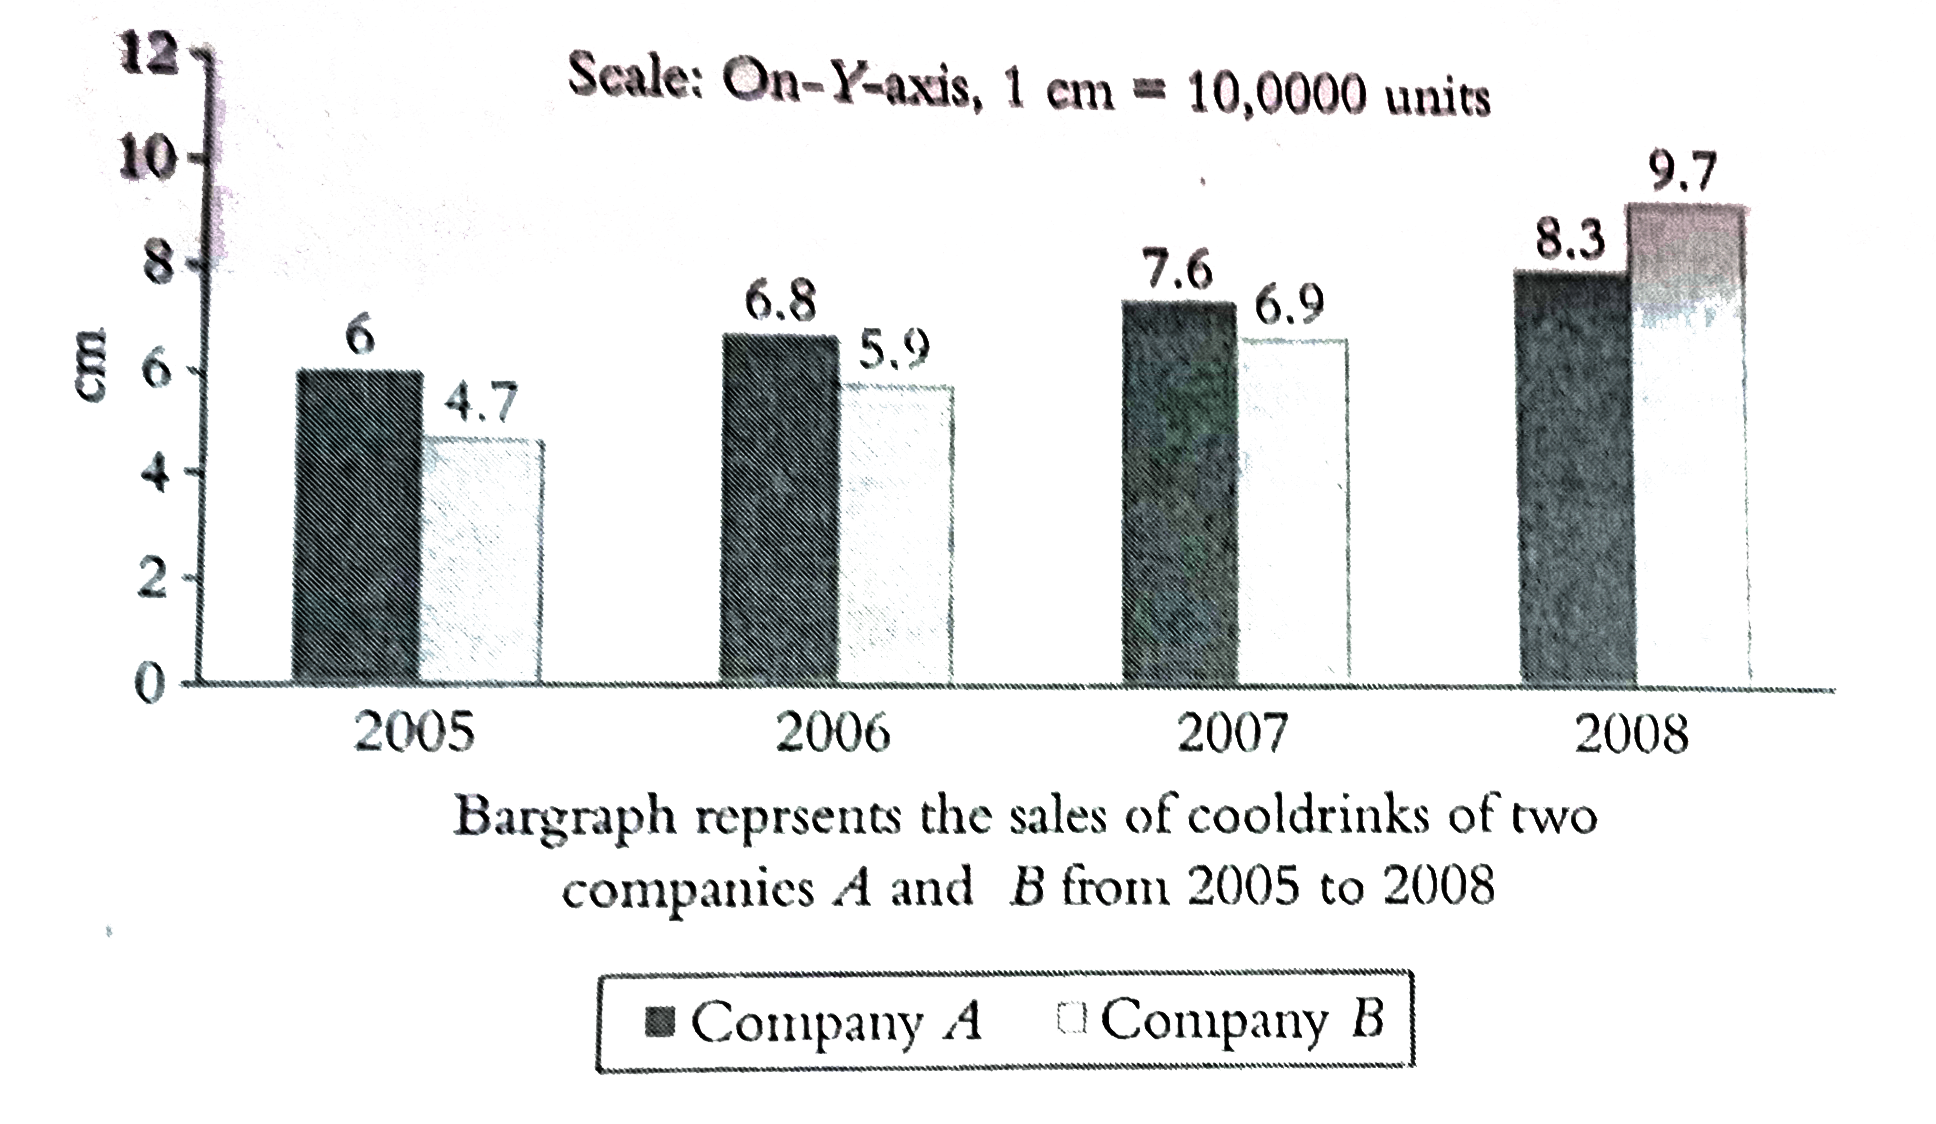
Find the minimum difference between the sales of A and sales of B in any year in the given period.
View Solution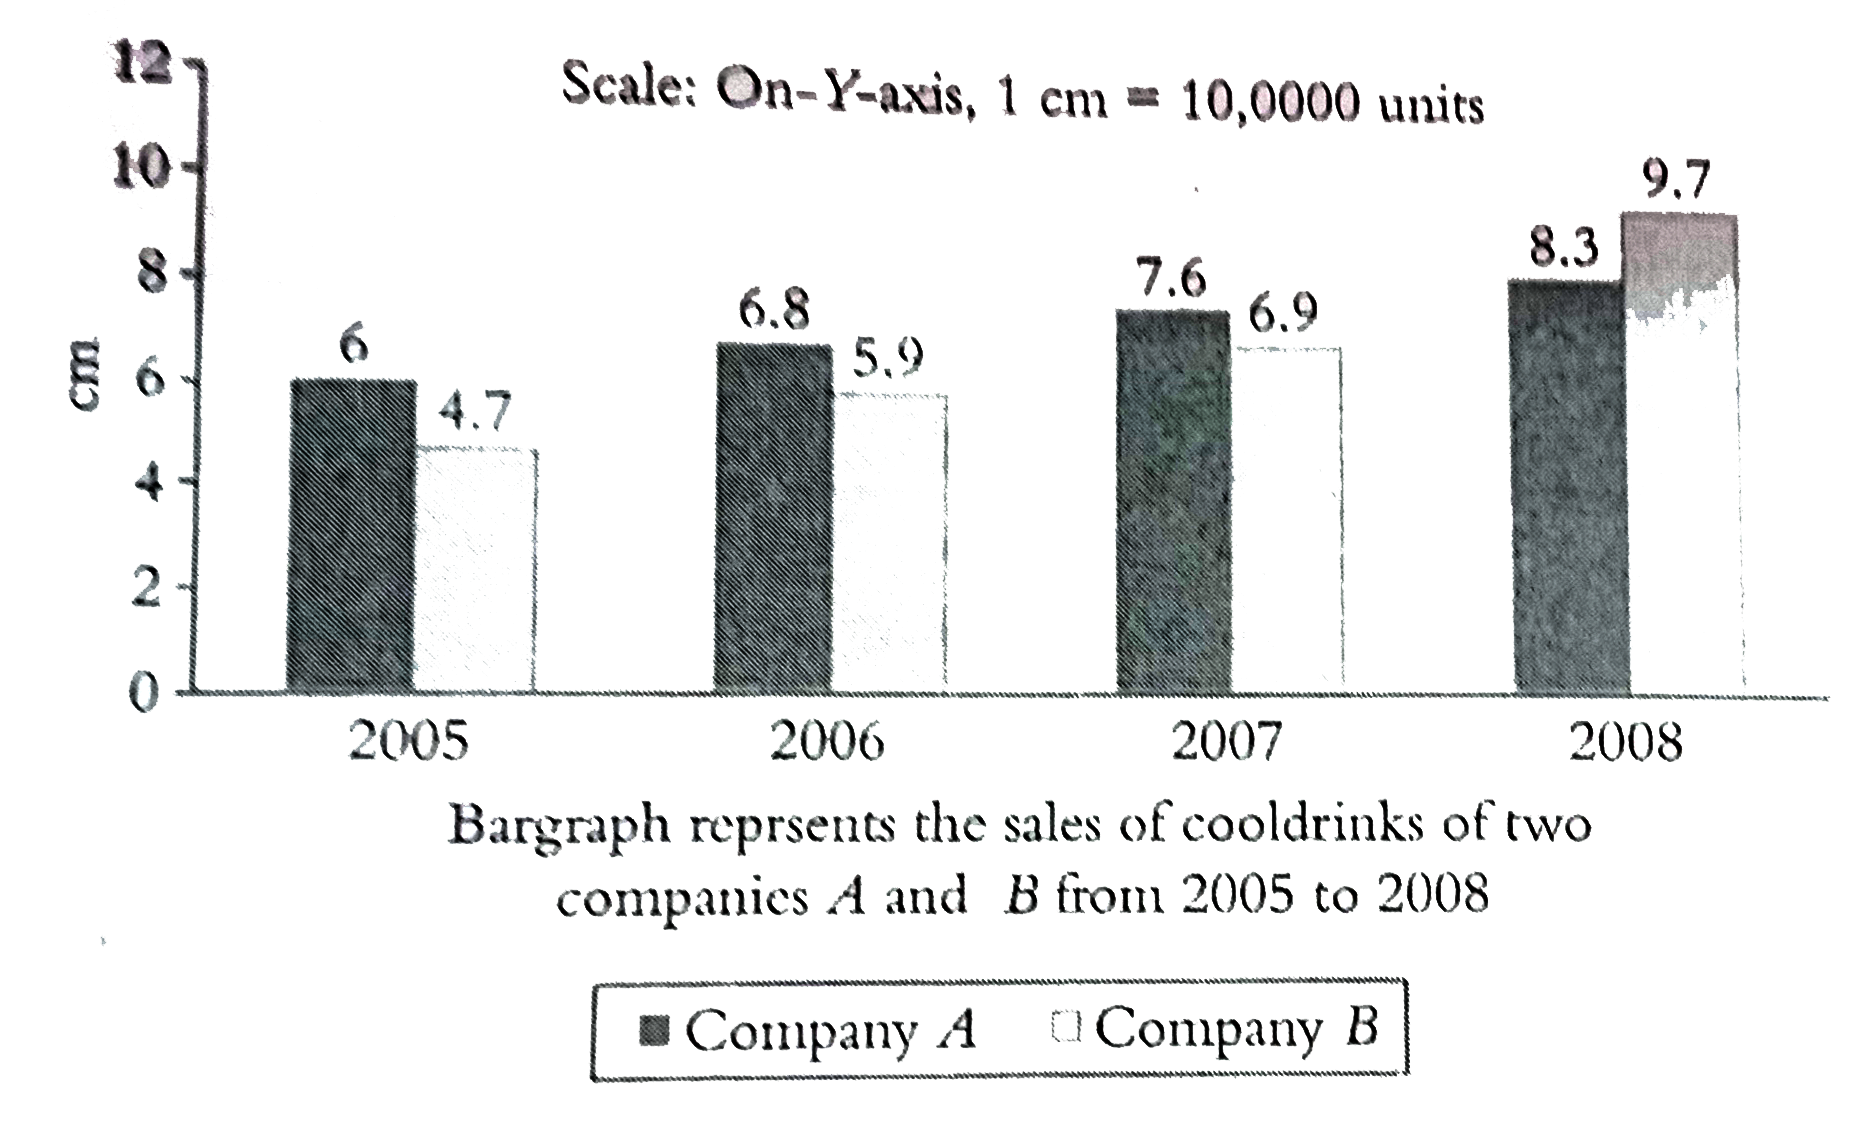
In which year is the sales of B more than the sales of A ?
View Solution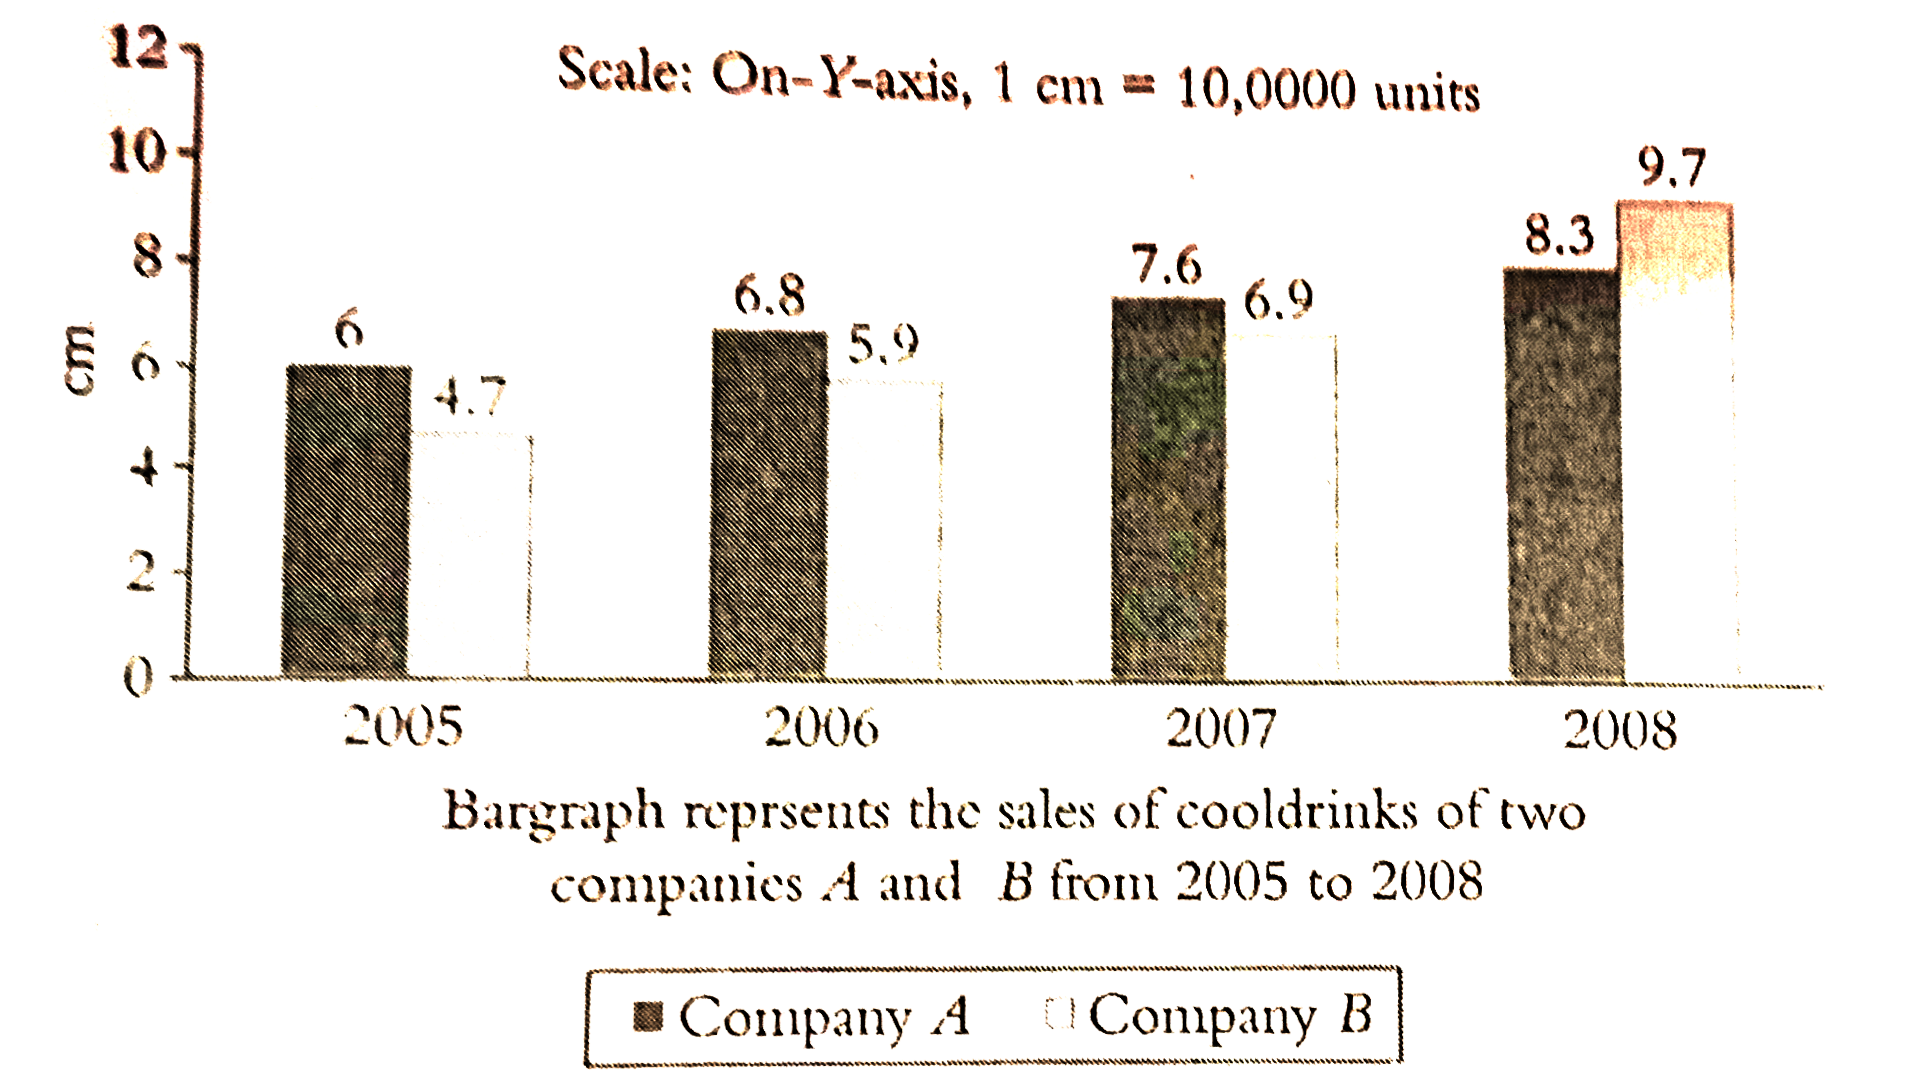
Find the ratio of the total sales in the year 2007 and that in 2008.
View SolutionWhen a dice is thrown, the total number of posible outcomes is ________.
View SolutionThe arithmetic mean of 13 observations is 60. If one of the observation 50 is deleted and another observation 63 is included. Find the new arithmetic mean. The following steps are involved in solving the above problem. Arrange them in sequential order.
(A) New sum of observations `=780-50+63=793`
(B) The sum of the observation `=13xx60=780`
(C) `:.` New arithmetic mean `=793/13`
(D) The required mean `=61`
View SolutionIf a dice is rolled, then find the probability of getting a composite number.
The following steps are involved in solving the above problem. Arrange them in sequential order.
(A) The possible composite number when a dice is rolled are 4 and 6. When a dice is rolled, the possible outcomes are 1, 2, 3, 4, 5, 6.
(B) The required probability `=1/3`
(C) The probability of getting a composite number `=("Number of favourable outcomes")/("Total number of outcomes")=2/6`
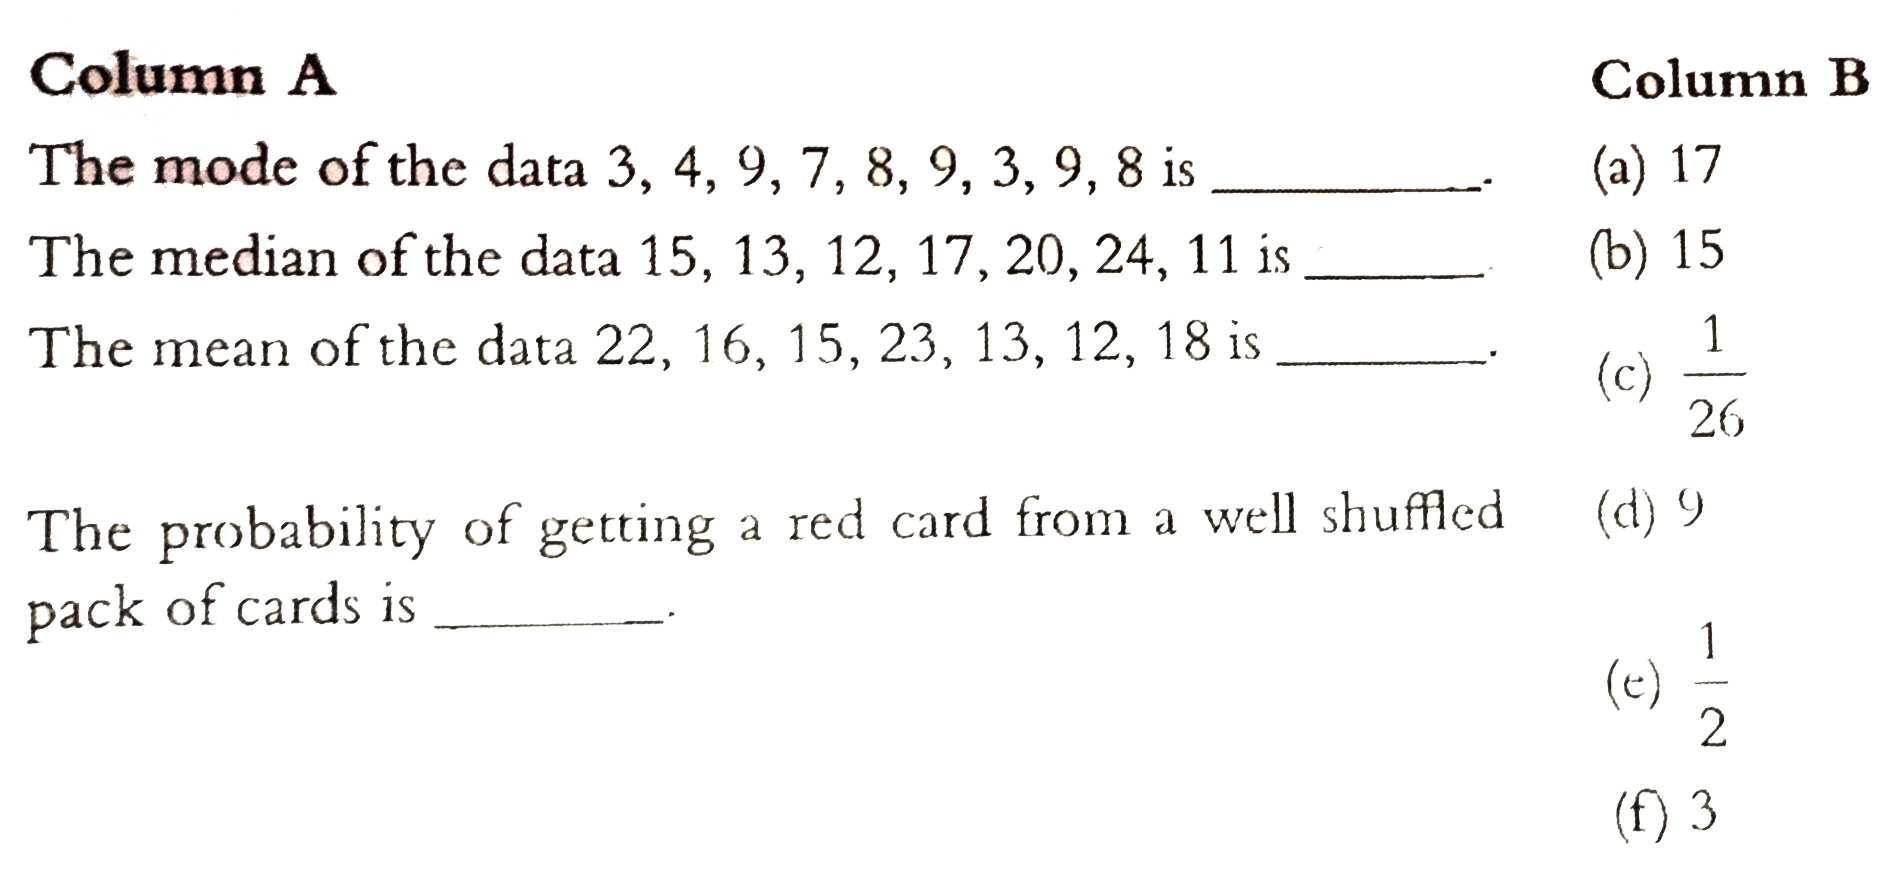
View SolutionMatch the following Column A to Column B
View Solution
CONCEPT APPLICATION Level - 1 questions and complete solutions for chapter STATISTICS of PEARSON IIT JEE FOUNDATION of Class 7
All Exercises from PEARSON IIT JEE FOUNDATION Class 7 MATHS STATISTICS
- CONCEPT APPLICATION (LEVEL 1)
- CONCEPT APPLICATION (LEVEL 2)
- CONCEPT APPLICATION (LEVEL 3)
- CONCEPT APPLICATION Level - 1
- Essay Type
- Example
- Level 2
- Level 3
- Short Answer Type
- TEST YOUR CONCEPTS (Essay Type Questions)
- TEST YOUR CONCEPTS (Short Answer Type Questions)
- TEST YOUR CONCEPTS (Very Short Answer Type Questions)
- Very Short Answer Type