Complete Solutions to SKILL TESTING EXERCISE of chapter STATISTICS of Class 9 book with complete answers and questions
| Class 9 | MATHS |
| Chapter | STATISTICS |
| KUMAR PRAKASHAN | SKILL TESTING EXERCISE |
| Number Of Questions | 21 |
| Academic Year | 2023-24 |
The marks scored by 40 students in a Mathematics test are given below:

Prepare the frequency distribution with classes 0-4, 5-9.....
View SolutionThe weights (in kg) of 30 girls of Primestreet Society are as below:

Prepare a frequency distribution with classes 30-35, 35-40 ....
View SolutionThe marks scored by 40 students in a 60 mark test of english are as follows ,

Prepare the frequency distribution with classes 0-9,10-19,…..
View SolutionThe information on the height (in cm) of 30 children is given below :

Prepare the frequency distribution with classes 40-50,50-60,….
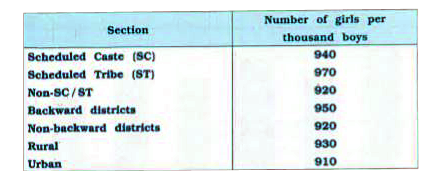
View SolutionThe following data on the number of girls (to the nearest ten) per thousand boys in different sections of Indian society is given below:

(i) Represent the information above by a bar graph. (ii) In the classroom discuss what conclusions can be arrived at from the graph.
View SolutionDraw a histogram for the frequency distribution :

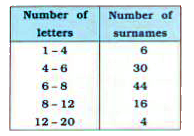
View Solution100 surnames were randomly picked up from a local telephone directory and a frequency distribution of the number of letters in the English alphabet in the surnames was found as follows:

(i) Draw a histogram to depict the given information, (ii) Write the class interval in which the maximum number of surnames lie.
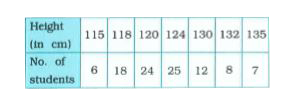
View SolutionDraw a frequency polygon for the following frequency distribution :

View SolutionThe weight (in kg) of seven students are given below: 35, 30, 42, 36, 38, 40, 45 Find the mean weight.
View SolutionThe information regarding the marks scored by 30 students in a 20 mark test of Mathematics is given below:

Find the mean of the data.
View SolutionThe height (in cm) of 100 students of a school are tabulated below:

Find the mean of the data.
View SolutionFind the median of the observations 13, 9, 15, 8, 6, 3.
View SolutionFind the median of the observations 12, 41, 34, 26. 31, 22, 10.
View SolutionFind the mode of the observations 17, 10, 13, 18, 22, 13, 26, 9, 13, 19.
View SolutionFind the mode of the observations 25, 20, 16, 12, 20, 16, 19, 23, 31, 20, 11, 18, 16.
View SolutionFind the mean, the median and the mode of the observations 24, 12, 15, 28, 15, 22, 17.
View SolutionSome observations are arranged in the ascending order as 9, a +3, a +7, 20, 23 and 26. If the median of the data is 18.5, find the value of a. Also find the mean of the data.
View SolutionThe mean of 5 observations is 20. Including one new observation, the mean is 25. Find the newly included observation.
View SolutionThe mean of 10 observations is 28. If 2 is added to each observation and then each result is divided by 3, find the mean of new observations so obtained.
View SolutionFind the mean of the following frequency distribution:

View SolutionIf the mean of the following frequency distribution is 26.7, find the missing frequency f:

View Solution
SKILL TESTING EXERCISE questions and complete solutions for chapter STATISTICS of KUMAR PRAKASHAN KENDRA MATHS (GUJRATI ENGLISH) of Class 9