Complete Solutions to SUM TO ENRICH REMEMBER of chapter STATISTICS of Class 9 book with complete answers and questions
| Class 9 | MATHS |
| Chapter | STATISTICS |
| KUMAR PRAKASHAN | SUM TO ENRICH REMEMBER |
| Number Of Questions | 14 |
| Academic Year | 2023-24 |
Consider the marks obtained by 10 students in a mathematics test as given below: 55 36 95 73 60 42 25 78 75 62 Find the range of the data.
View SolutionConsider the marks obtained (out of 100 marks) by 30 students of Class IX of a school :

Represent this data in a frequency distribution table
View Solution100 plants each were planted in 100 schools during Van Mahotsava. After one month, the number of plants that survived were recorded as:
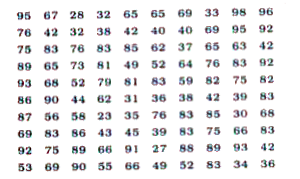
Present this data in a condensed tabular form so that a reader can make sense of it easily
View SolutionLet us now consider the following frequency distribution table which gives the weights of 38 students of a class :
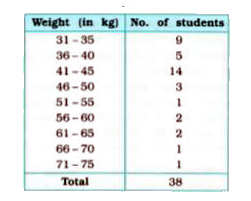
Convert the classes of above frequency distribution to continuous classes to include two new students weighing 35.5 kg and 40.5 kg.
View SolutionIn a particular section of Class IX, 40 students were asked about the month of their birth and the following graph was prepared for the data so obtained :
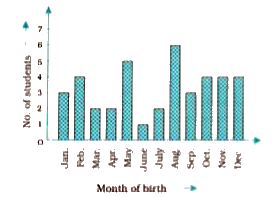
Observe the bar graph given above and answer the following questions: ( i ) How many students were born in the month of November? (ii) in which month were the maximum number of students born ?
View SolutionA family with a monthly income of Rs. 20,000 had planned the following expenditures per month unders various heads :
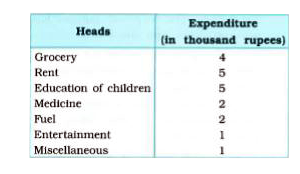
Draw a bar graph for the data above.
View SolutionThe information regarding the marks scored by 30 students in a 20 mark test of Mathematics is given below:

Find the mean of the data.
View SolutionThe data regarding the motion of two different objects A and B are given in the following table :
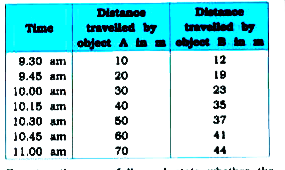
Examine them carefully and state whether the motion of the objects is uniform or non-uniform.
View Solution5 people were asked about the time in a week they spend in doing social work in their community. They said 10, 7, 13, 20 and 15 hours, respectively. Find the mean (or average) time in a week devoted by them for social work.
View SolutionThe information regarding the marks scored by 30 students in a 20 mark test of Mathematics is given below:

Find the mean of the data.
View SolutionThe heights (in cm) of 9 students of a class are as follows: 155, 160, 145, 149, 150, 147, 152, 144, 148 Find the median of this data.
View SolutionThe points scored by a Kabaddi team in a series of matches are as follows: 17, 2, 7, 27, 15, 5, 14, 8, 10, 24, 48, 10, 8, 7, 18, 28 Find the median of the points scored by the team.
View SolutionFind the mode of the following marks (out of 10) obtained by 20 students : 4, 6, 5, 9, 3, 2, 7, 7, 6, 5, 4, 9, 10, 10, 3, 4, 7, 6, 9, 9
View SolutionConsider a small unit of a factory where there are 5 employees: a supervisor and four labourers. The labourers draw a salary of 75,000 per month each while the supervisor gets 715,000 per month. Calculate the mean, median and mode of the salaries of this unit of the factory.
View Solution
SUM TO ENRICH REMEMBER questions and complete solutions for chapter STATISTICS of KUMAR PRAKASHAN KENDRA MATHS (GUJRATI ENGLISH) of Class 9