Complete Solutions to EXERCISE 14.3 of chapter STATISTICS of Class 9 book with complete answers and questions
| Class 9 | MATHS |
| Chapter | STATISTICS |
| KUMAR PRAKASHAN | EXERCISE 14.3 |
| Number Of Questions | 9 |
| Academic Year | 2023-24 |
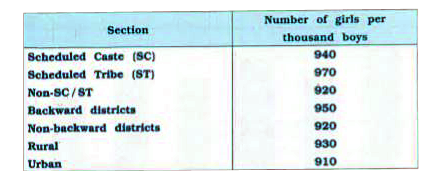
The following data on the number of girls (to the nearest ten) per thousand boys in different sections of Indian society is given below:

(i) Represent the information above by a bar graph. (ii) In the classroom discuss what conclusions can be arrived at from the graph.
View SolutionThe following data on the number of girls (to the nearest ten) per thousand boys in different sections of Indian society is given below:

(i) Represent the information above by a bar graph. (ii) In the classroom discuss what conclusions can be arrived at from the graph.
View SolutionGiven below are the seats won by different political parties in the polling outcome of a state assembly elections :

(i) Draw a bar graph to represent the polling results. (ii) Which political party won the maximum number of seats?
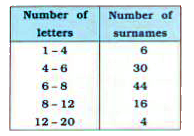
View Solution100 surnames were randomly picked up from a local telephone directory and a frequency distribution of the number of letters in the English alphabet in the surnames was found as follows:

(i) Draw a histogram to depict the given information, (ii) Write the class interval in which the maximum number of surnames lie.
View SolutionThe following table gives the distribution of the lifetime of 400 neon lamps :
`{:("Lifetime (in hours) ","Number of lamps "),(" "1500-2000," "14),(" "2000-2500," "56),(" "2500-3000," "60),(" "3000-3500," "86),(" "3500-4000," "74),(" "4000-4500," "62),(" "4500-5000," "48):}`
Find the median of a lamp.
View SolutionThe runs scored by two teams A and B on the first 60 balls in a cricket match are given below:

Represent the data of both the teams on the same graph by frequency polygons .
View SolutionThe following table gives the information about the number of students in different standards of a school :

Represent the data by a Bar graph.
View Solution100 surnames were randomly picked up from a local telephone directory and a frequency distribution of the number of letters in the English alphabet in the surnames was found as follows:

(i) Draw a histogram to depict the given information, (ii) Write the class interval in which the maximum number of surnames lie.
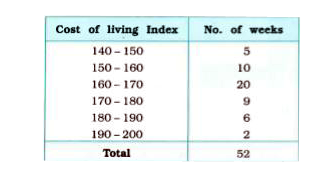
View SolutionIn a city, the weekly observations made in a study on the cost of living index are given in the following table :

Draw a frequency polygon for the data above (without constructing a histogram).
View Solution
EXERCISE 14.3 questions and complete solutions for chapter STATISTICS of KUMAR PRAKASHAN KENDRA MATHS (GUJRATI ENGLISH) of Class 9