Complete Solutions to EXERCISE of chapter STATISTICS of Class 9 book with complete answers and questions
| Class 9 | MATHS |
| Chapter | STATISTICS |
| MODERN PUBLICATION | EXERCISE |
| Number Of Questions | 100 |
| Academic Year | 2023-24 |
Define
Statistics as a subject.
View SolutionDefine
Few fundamental characterstics of Statistics.
View SolutionDefine primary and secondary data. Which of them is more reliable and why?
View SolutionExplain the meaning of the following terms:
variate.
View SolutionExplain the meaning of the following terms:
class interval.
View SolutionExplain the meaning of the following terms:
class size.
View SolutionExplain the meaning of the following terms:
class mark.
View SolutionExplain the meaning of the following terms:
frequency of a class
View SolutionExplain the meaning of the following terms:
cumulative frequency of a class.
View SolutionExplain the meaning of the following terms:
true class limits
View SolutionWrite the class size in each of the folowing
0-4,5-9,10-14
View SolutionWrite the class size in each of the folowing
10-19,20-29,30-39
View SolutionWrite the class size in each of the folowing
100-120,120-140,140-160
View SolutionWrite the class size in each of the folowing
0-0.25,0.25-0.50,0.50-0.75
View SolutionWrite the class size in each of the folowing
5-5.01, 5.01-5.02, 5.02-5.03.
View SolutionThe final makrs in Mathematics of 30 students are as follows
`{:(53,61,48,60,78,68,55,100,67,90),(75,88,77,37,84,58,60,48,62,56),(44,58,52,98,59,70,38,50,60):}`
Arrange these marks in the ascending order, 30 to 39 one group, 40 to 49 second group etc.
View SolutionThe final makrs in Mathematics of 30 students are as follows
`{:53,61,48,60,78,68,55,100,67,90,75,88,77,37,84,58,60,48,62,56,44,58,52,98,59,70,38,50,60:}`
What is the highest score?
View SolutionThe final makrs in Mathematics of 30 students are as follows
`{:(53,61,48,60,78,68,55,100,67,90),(75,88,77,37,84,58,60,48,62,56),(44,58,52,98,59,70,38,50,60):}`
What is the lowest score?
View SolutionThe final makrs in Mathematics of 30 students are as follows
`{:(53,61,48,60,78,68,55,100,67,90),(75,88,77,37,84,58,60,48,62,56),(44,58,52,64,98,59,70,38,50,60):}`
What is the range?
View SolutionThe final makrs in Mathematics of 30 students are as follows
`{:53,61,48,60,78,68,55,100,67,90,75,88,77,37,84,58,60,48,62,56,44,58,52,98,59,70,38,50,60:}`
What is the highest score?
View SolutionThe final makrs in Mathematics of 30 students are as follows
`{:(53,61,48,60,78,68,55,100,67,90)`
`(75,88,77,37,84,58,60,48,62,56)`
`(44,58,52,64,98,59,70,38,50,60)`
How much have scored 75 or more?
View SolutionThe final makrs in Mathematics of 30 students are as follows
`(53,61,48,60,78,68,55,100,67,90)`
`(75,88,77,37,84,58,60,48,62,56)`
`(44,58,52,98,59,70,38,50,60)`
Which observations between 50 and 60 have not actually appeared?
View SolutionThe final marks in Mathematics of 30 students are as follows
`(53,61,48,60,78,68,55,100,67,90)`
`(75,88,77,37,84,58,60,48,62,56)`
`(44,58,52,98,59,70,38,50,60)`
How many have scored less than 50?
View SolutionThe number of runs scored by a cricket player in 25 innings are as follows:
26,35,94,48,82,105,53,0,39,42,71,0,64,15,34,67,0,42,124,84,48,139,64,47
Rearange these runs in ascending order.
View SolutionThe number of runs scored by a cricket player in 25 innings are as follows:
26,35,94,48,82,105,53,0,39,42,71,0,64,15,34,67,0,42,124,84,48,139,64,47
Determine the player's highest score.
View SolutionThe number of runs scored by a cricket player in 25 innings are as follows:
26,35,94,48,82,105,53,0,39,42,71,0,64,15,34,67,0,42,124,84,48,139,64,47
How many centuries did he score?
View SolutionThe number of runs scored by a cricket player in 25 innings are as follows:
26,35,94,48,82,105,53,0,39,42,71,0,64,15,34,67,0,42,124,84,48,139,64,47
How many times did he score more than 50 runs?
View SolutionThe number of runs scored by a cricket player in 25 innings are as follows:
26,35,94,48,82,105,53,0,39,42,71,0,64,15,34,67,0,42,124,84,48,139,64,47
How many times did the player not score a run?
View SolutionFollowing data gives the number of children in 40 families:2,1,5,6,1,5,1,3,2,6,4,2,0,4,4,3,2,2,0,0,1,2,2,4,3,2,0,5,1,2,4,3,4,1,2,2,6
Represent it in the form of frequency distribution, taking classes 0-2,2-4 etc.
View SolutionThe marks scored by 40 students of class IX in mathematics are given below:
81, 56, 68, 79, 85, 13, 29, 68, 54, 73, 47, 35, 72, 64, 95, 44, 50, 77, 64, 35, 79, 52, 45, 54, 70, 83, 62, 64, 72, 92, 84, 76, 63, 43, 54, 38, 73, 68, 52, 54.
Prepare a frequency distribution with class size of 10 marks.
View SolutionThe heights of 30 students of class IX are given below:
158,155,154,158,160,148,150,153,159,161,148,157,162,159,151,154,156,152,156
,160,152,147,155,163,155,153,157. prepare a frequency distributions table with 150-154 as one of the class intervals.
View SolutionThe daily maximum temperature recorded in a certain city during the month of November are as follows:
24.5, 25.8, 25.6, 20.7, 21.8,20.5,20.6,20.9,23.1,22.4,21.5,22.7,22.8,22.0,23.9,22.8,23.8,24.6,21.1,23.9
Represent them as a frequency distribution table with class size `1^@C`.
View SolutionThe yearly savings (in rupees) of 30 students of X are as follow:
50,60,53,70,70,80,60,53,75,47,47,47,75,53,60,70,70,80,53,50,53,70,75,75,60,80,47,50,50,50.Prepare a frequency table using tally marks.
How much saving is minimum?
View SolutionFollowing are the ages of 360 patients getting medical treatment in a hospital

Construct a commulative frequency table for the above data.
View SolutionGiven below is a cummulative frequency table
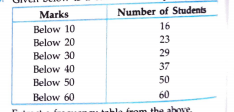
Extract a frequency table from the above.
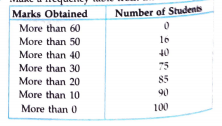
View SolutionMake a frequency table from the following
View SolutionOne a certain day the temperatuer in a city was recorded as under:

Illustrate the data by a bar graph.
View SolutionThe following table shows the favourite sports of 250 students of a school. Represent the data by a bar graph

View SolutionGiven below is a table which shows the year wise strenght of a school. Represent this data by a bar graph

View SolutionThe birth rate per thousand in five countries over a priod of time is shown below
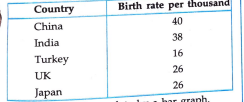
Represent the above data by a bar graph.
View SolutionThe air distance of four cities form Delhi are given below

Draw a graph to represent the data.
View SolutionGold prices on 4 consecutive wednesdays were as under:

Draw a bar graph to represent the data.
View SolutionVarious modes of transport used by 1950 students of a school are given below

Draw a graph to represent the above data.
View SolutionThe following table shows the daily production of T.V sets in a industry for 7 days of a week
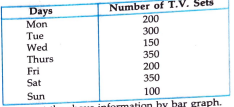
Represent the above information by bar graph.
View SolutionRead the bar graph shown in fig. and answer the following questions
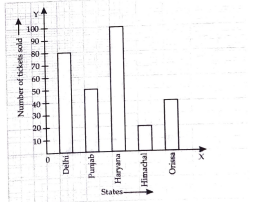
What is the information given by the bar graph.
View SolutionRead the bar graph shown in fig. and answer the following questions
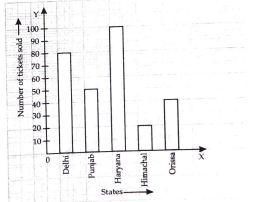
How many tickets of Orissa State Lottery were sold by the agent?
View SolutionRead the bar graph shown in fig. and answer the following questions
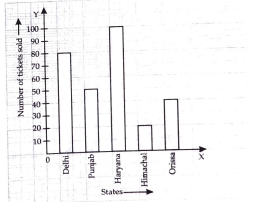
Of which state were the maximum number of tickets sold?
View SolutionRead the bar graph shown in fig. and answer the following questions
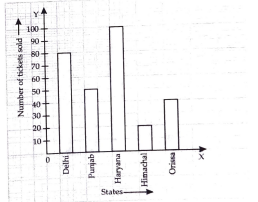
The maximum number of tickets sold is three times the minimum number of tickets sold.
View SolutionRead the bar graph shown in fig. and answer the following questions
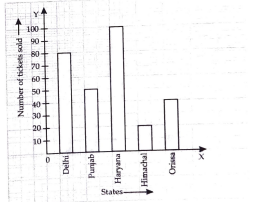
Of which state were the minimum number of tickets sold?
View SolutionRead the bar graph shown in fig. and answer the following questions
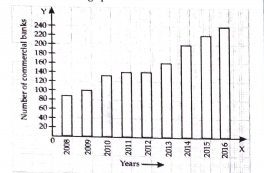
What is the information given by the bar graph?
View SolutionRead the bar graph shown in fig. and answer the following questions
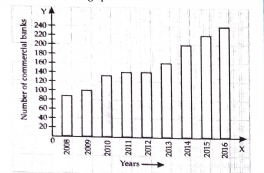
What was the number of commercial banks in 2010?
View SolutionRead the bar graph shown in fig. and answer the following questions
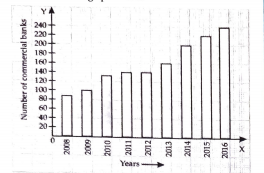
What is the ratio of the number of commercial banks in 2008 to that in 2014?
View SolutionRead the bar graph shown in fig. and answer the following questions
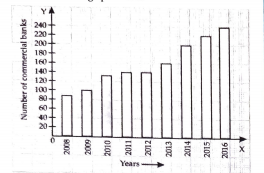
The number of commercial banks in 2016 is less than double the number of commercial banks in 2008.
View SolutionWhat is the information given y the bar graph
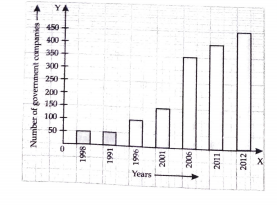
View SolutionThe number of governement companies in 1996 is that of 2011 of 1:9
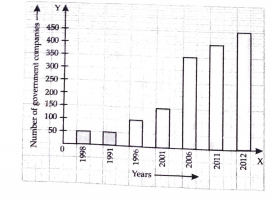
View SolutionThe number of government companies have decreased over the year 1998 to 2012.
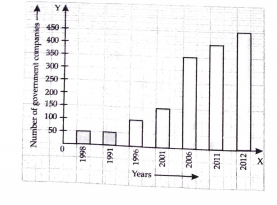
View SolutionRead the following bar graph and answer the following questions
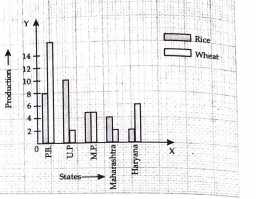
What information is given by the bar graph?
View SolutionRead the following bar graph and answer the following questions
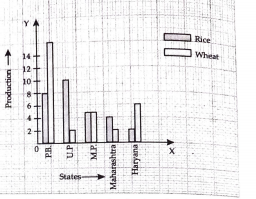
Which state is the largest producer of rice?
View SolutionRead the following bar graph and answer the following questions
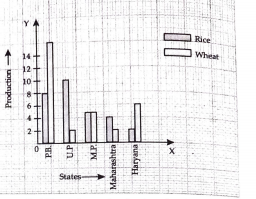
Which state is the largest producer of wheat?
View SolutionRead the following bar graph and answer the following questions
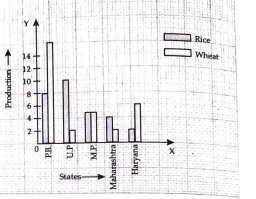
Which state has the total production of wheat and rice as its maximum?
View SolutionRead the following bar graph and answer the following questions
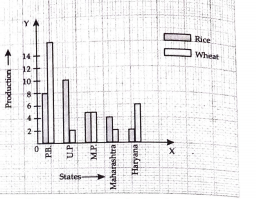
Which state has the total production of wheat and rice minimum?
View SolutionRead the following the bar graph in fig. and answer the following questions
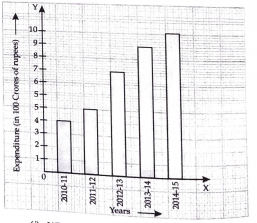
What was the expenditure on health and family planning in the year 2012-13?
View SolutionRead the following the bar graph in fig. and answer the following questions
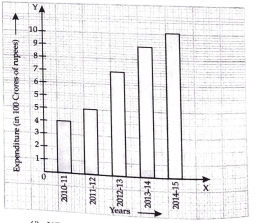
In which year is increased in expenditure maximum over the expenditure.
View SolutionRead the following the bar graph in fig. and answer the following questions
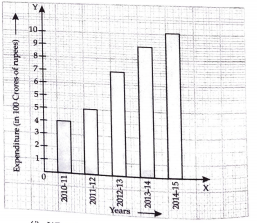
What information is given by the bar graph?
View SolutionWhat information does it gave?
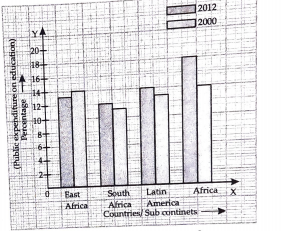
View SolutionIn which part the expenditure on education is maximum in 2000?
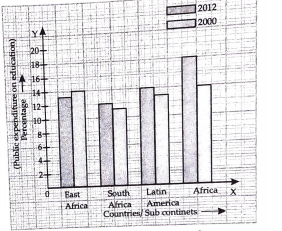
View SolutionIn which part the expenditure has gone up from 2000 to 2012?
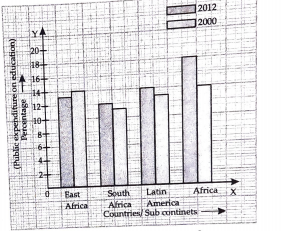
View SolutionIn which part the gap between 2000 to 2012 is maximum?
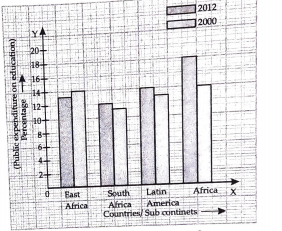
View SolutionThe daily wages of 50 workers in a factory are given below:
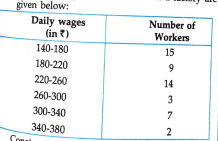
Construct a histogram to represent the above frequency distribution.
View SolutionDraw a histogram for the frequency distributions of the following data
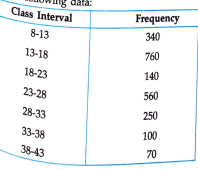
View SolutionThe following table shows the number of illiterate persons in the age group in a town
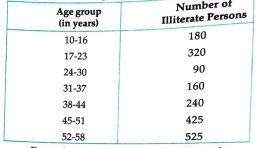
Draw a histogram to represent the above data.
View SolutionConstruct a histogram for the following data:
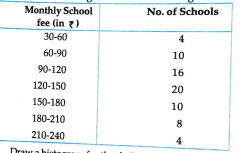
View SolutionDraw a histogram for the daily earnings of 30 drug stores in the following table
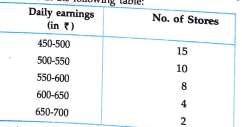
View SolutionThe ages of 360 patients treated in a hospital on a particular day are given below
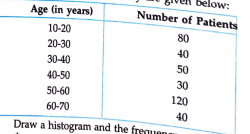
Draw a histogram and the frequency polygon on the same grap to represent the above data.
View SolutionDraw a frequency polygon for the following frequency distribution
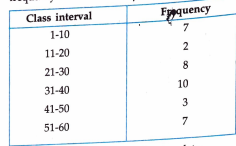
View SolutionDraw a histogram for the following data:
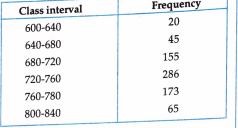
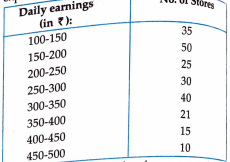
View SolutionThe following is the distribution of total household expenditure of manual worker in a city The total numbers of workers whose earning is between 100-250 is
View SolutionThe montly profits of 100 shops are distributed as follows
Draw a histogram for the data and show the frequency polygon for it.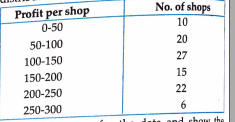
View SolutionFind the mean of first five natural numbers.
View SolutionFind the mean of all factors of 10.
View SolutionFind the arithmetic mean of first ten even natural numbers.
View SolutionThe number of children in 10 families of a locality are: 2,4,3,4,2,0,3,5,1,6 .Find the mean number of children per family.
View SolutionFind the mean of first five multiples of 3.
View SolutionThe number of children in 10 families of a locality are: 2,4,3,4,2,0,3,5,1,6 .Find the mean number of children per family.
View SolutionThe following are the number of books issued in a school library during a week:
105, 216, 322,167,273,405 and 346. find the average number of books issued per day.
View SolutionIf the arithmetic mean of 7,9,1,13,x,21 is 13, find the value of x.
View SolutionThe mean of 20 numbers is 43, if 6 is subtracted from each of the numbers, what will be the new mean?
View SolutionThe mean of 12 numbers is 40. if each numbers if divided by 8, what will be the mean of the new numbers?
View SolutionThe mean of 20 numbers is 18, if 3 is added to each of the first ten numbers, find the mean of the new set of 20 numbers.
View SolutionThe mean of 100 items was found to be 64. later on, it was discovered that two itens were misread as 26 and 9 instead of 36 and 90 respectively. Find the correct mean.
View SolutionThe mean of 200 items was 50. later on, it was discovered that the two items were misread as 92 nd 8 instead of 192 and 88, find the correct mean.
View SolutionThe mean of six numbers is 23. if one of the number is excluded, the mean of the remaining numbers is 20. find the excluded number.
View SolutionThe mean of 5 numbers is 18, if one number is excluded, their mean is 16. find the excluded number.
View SolutionThe mean of marks scored by 100 students was found to be 40, later on, it was discovered that a score of 53 was misread as 83. find the correct mean.
View SolutionObtain the sum of the deviations of the observations
3,4,6,8,14 from their mean.
View SolutionIf `barx` is the mean of ten natural numbers `x_1,x_2,x_y………..x_10` show that:
`(x_1-barx)+(x_2-barx)+……….+(x_10………barx)=0`
View SolutionDurations of sunshine in Delhi for first 10 days of Auguse, 2016 as reported by the Meterological Department are given below:
9.6,5.2,3.5,1.5,1.6,2.4,2.6,8.4,10.3,10.9
Find the mean `barx`
View SolutionDurations of sunshine in Delhi for first 10 days of Auguse, 2016 as reported by the Meterological Department are given below:
9.6,5.2,3.5,1.5,1.6,2.4,2.6,8.4,10.3,10.9
Verify that `underset(i=1)overset(10)sum(x_i-barx)=0`
View SolutionA cricketar has a mean score of 58 runs in nine innings. Find out how many runs are to be scored y him in the tenth inning to raie the mean score to 61.
View SolutionThe average monthly salary of 20 workers in an office is Rs 7650. If the manager's salary is added, the average salary becomes Rs 8200 per month. What is the manager salary per month?
View Solution
EXERCISE questions and complete solutions for chapter STATISTICS of MODERN PUBLICATION of Class 9