Complete Solutions to EXAMPLE of chapter STATISTICS of Class 9 book with complete answers and questions
| Class 9 | MATHS |
| Chapter | STATISTICS |
| MODERN PUBLICATION | EXAMPLE |
| Number Of Questions | 100 |
| Academic Year | 2023-24 |
The following data gives the number of children in 15 families of a locality.
1,1,2,3,1,5,3,2,4,1,1,2,4,3,1,1
Calculate the array of above data and construct a frequency as below.
View SolutionThe following data gives the marks out of 50, obtained by 11 students of a class in a test
32,23,22,18,42,18,20,17,12,9,11
Arrange them in ascending order and present it as a completed data
In exclusive form.
View SolutionThe following data gives the marks out of 50, obtained by 25 students of a class in a test
32,23,22,18,42,18,20,17,12,9,11
Arrange them in ascending order
View SolutionThe marks obtained by 35 students of class IX of a school are given as below:
17,9,11,9,15,11,4,22,1,17,24,3,11,20,12,9,7,0,5,3,5,13,21,13,15,20,24,1,7,21,22,10,13,18,24. present the data in the form of a frequency distributions, using same class size, starting with class 0-5
View SolutionThe class marks of a distributions are:
37,42,47,52,57,62,67,72,77,82,87,92
find the class size, the limits and true class limits.
View SolutionConstruct a frequency distribution table with class size 10 of the following data
184,144,195,130,134,132,114,196,174,212,210,188,202,145,154,175,178,146,166, 115,135,114, 126,188,140, 166,176,208,210
View SolutionThe weight of 50 apples form a consignement are as below
113,131,75,82,204,81,84,118,110,104,107,80,141,111,143,136,78,.90,110,98,106, 99,84,107,186,76,82,109,100,115,125,107,115,93,119,89,87,139,129,130,68,73, 195,111,125,85,92,126,70,75. form the grouped frequency table by dividing the variable range into intervals of equal width of 20 g so that the mid vlaue of the first class intervals is 70 g.
View SolutionIn an examination, the marks obtained by 32 students are as below:
290,370,175,318,410,378,405,370,380,315,305,325,275,288,241,261,355,402,380,428,210,240,154,175,405,370,380,460,306,440,328,425. form a commulative frequency table with class intervals of length 50.
View SolutionA commulative frequency distributions if given below. Convert this into a frequency distribution table
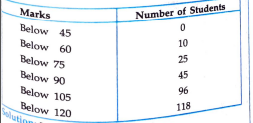
View SolutionThe following table gives the number of students in IX class in a school during the academic years 2012-2013 to 2016-17

Represent the above data by a bar graph.
View Solution600 students of a school use different mode of transport to go to school s below
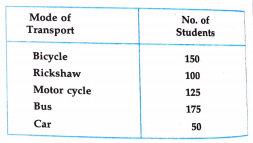
Draw the bar graph representing the above data.
View SolutionA family with normally income of Rs.40,000 had planned the following expenditure per month under following heads:
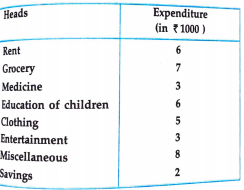
Draw a bar graph for the above data.
View SolutionIn a particular section of class IX, 40 students were asked about the months of their birth and following graph was prepared for the above data so obtained
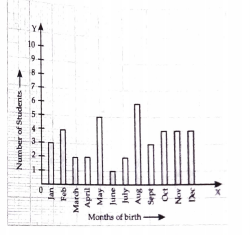
How many students were born in the month of October?
View SolutionIn a particular section of class IX, 40 students were asked about the months of their birth and following graph was prepared for the above data so obtained
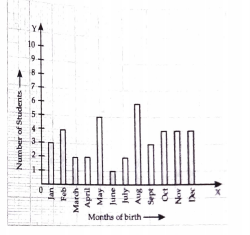
In which month were the maximum number of students born?
View SolutionRead the bar graph shown in fig. and answer the following questions
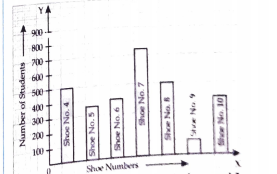
What is the number of students wearing shoe NO. 5?
View SolutionRead the bar graph shown in fig. and answer the following questions
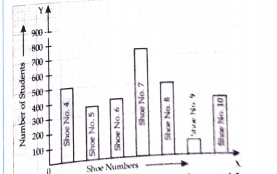
Which shoe number is worn by the maximum number of students? Also give its number.
View SolutionRead the bar graph shown in fig. and answer the following questions
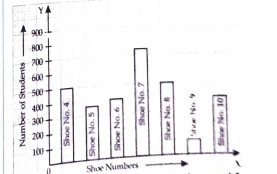
Which shoe number is worn by the minimum number of students? Also give the number.
View SolutionRead the bar graph shown in fig. and answer the following questions
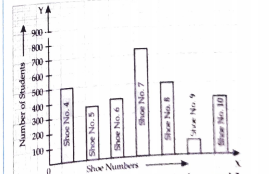
State whethe true or false
The number of students wearing shoe no. 10 is less than three times the number of students wearing shoe no. 8.
View SolutionAfter reading the bar graph given below
answer the following questions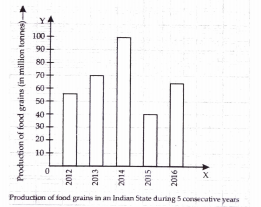
what information is given by the bar graph?
View SolutionAfter reading the bar graph given below
answer the following questions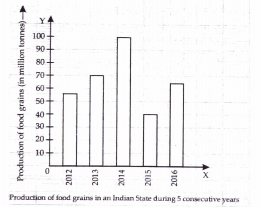
In which year was the productions maximum?
View SolutionAfter reading the bar graph given below
answer the following questions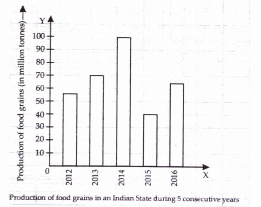
After which year was there a sudden fall in the production?
View SolutionAfter reading the bar graph given below
answer the following questions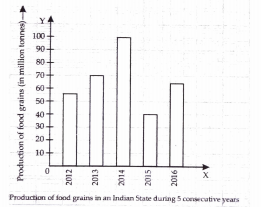
find the ratio between the maximum production and the minimum production during the given period.
View SolutionThe results of pass percentage of class X and class XII in CBSE examination for 5 years are given in the following table:

Draw bar graphs so as to represent the above data.
View SolutionRepresent the following frequency distribution by means of a histogram:

View SolutionThe following table presents the number of literate males in a town:
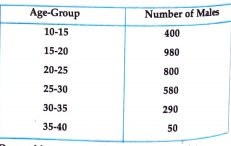
Draw a histogram to represent the above data.
View SolutionRepresent the following frequency distribution by means of a histogram:
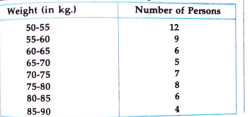
View SolutionDraw a histogram for the following data:

View SolutionDraw a histogram to represent the following frequency distribution

View SolutionDraw a histogram from the following distributions obtained by 55 students of IX class in the examination
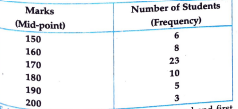
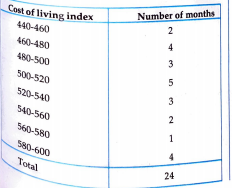
View SolutionDraw a histogram and a frequency polygon in represent the following data, which shows the montly cost of living index of a city in a period of 2 years
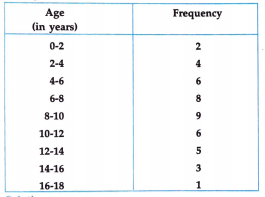
View SolutionConstruct a frequency polygon for the following data:
View SolutionThe daily pocket expenses of 206 students in a school are given below
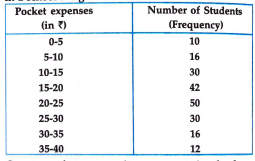
construct a fequency polygon representing the above data.
View SolutionThe heights of four players are
152 cm, 140 cm, 148 cm and 156 cm, find the mean height of players.
View SolutionFind the arithmetic mean of first 8 natural numbers.
View SolutionFind the arithmetic mean of first ten even natural numbers.
View SolutionIf the mean of x, x+2, x+4, x+6 and x+8 is 13, find x.
View SolutionThe mean of 40 numbers was found to be 35. Later on, it was detecte that a number 56 was misread as 36. find the correct mean of the given numbers.
View SolutionThe mean of first 8 observations is 18 and last 8 observations is 20. if the mean of all 15 observations is 19, find the 8th observations.
View SolutionIf the mean of n observatoins:
`ax_1,ax_2,………..ax_n` is `abarx`,
Show that `(ax_1-abarx)+(ax_2-abarx)+……..+(ax_n-abarx)=0`
View SolutionObtain the sum of the deviations of the observations
3,4,6,8,14 from their mean.
View SolutionThe mean of 10 number is 25. if 5 is subtracted from each other find the new mean.
View SolutionFind the mean of the following distributions

View SolutionThe mean of following data is 21.6. find the value of p

View SolutionThe mean of the following frequency distributions is 1.46

Find the missing frequencies.
View SolutionThe runs scored by 11 members of a cricket team are: 10,30,43,15,35,55,20,0,58,32. find the median score.
View SolutionFind the median of the following data
26,36,29,25,24,37,23,20,34
View SolutionThe following observation are arranged in ascending order:
26,29,42,53,x,x+2,70,75,82,93
If the median is 65 find the value of x.
View Solutionfind the median of the following data
18,26,59,48,31,30,32,52. if 26 is replaced by 62, what will be the new median.
View SolutionFind the median of the folloiwng frequency distributions

View SolutionFind the mode of the following marks obtained by 20 students
3,5,6,9,3,2,8,8,6,4,5,10,3,5,7,9,9
View SolutionFor what value of x, the mode of the data is 12:
12,11,10,12,x,10,9,12,10,12
View SolutionFind the mode of the following data:
25,23,25,28,23,16,23,16,22,17,25,23
View SolutionConsider the marks out of 100, obtained by 51 students of a class in a test, given in table below:
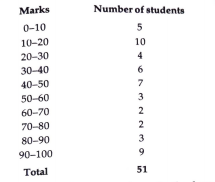
Draw a historigram and frequency polygon for the above data.
View SolutionA train travels between two stations ambala and Amritsar. While goind from Ambala to Amritsar, it takes 3 hours and its average speed is 100km/hr. when coming back from Amritsar of Ambala, it takes 2 hours and it average speed is 150 km/hr. obtain the average speed during the whole journey?
View SolutionThe mean of n observations `x_1,x_2,…………..x_n` is `barx`. If (p+q) is added to each observations then prove that the mean of the new set of observations is `barx+(p+q)`.
View SolutionIf `x_1,x_2,………….x_p` are p values of variabled x such that `underset(i=1)overset(p)sum(x_i-2)=110 and underset(i=1)overset(p)sum(x_i-5)=20` find the value of p and the mean.
View Solution5 people of a locality were asked about the time they spent in a week in doing social work. They told the number of hous as: x,x+3,x+6,x+7,x+4. find the mean number of devoted by first three members. If mean number of hours of 5 persons is 11 hours, what values do we draw from above data?
View SolutionThe percentage of salary donated by twelve difference households to an orphanage every month are: 3,4,3,4,6,4,3,4,1,2
find the mean, median and mode of the data. What qualities do the persons of these households possess?
View SolutionGive three examples of data that you can collect from your School
View Solutionfind the mean of data
3,5,8,1,4,6
View SolutionThe blood groups of 30 students of Class VIII are recorded as follows: A, B, O, O, AB, O, A, O, B, A, O, B, A, O, O, A, AB, O, A, A, O, O, AB, B, A, O, B, A, B, O. Represent this data in the form of a frequency distribution table. Which is the most common, and which is the rarest, blood group among these students?
View SolutionDistance of 40 engineers from their place of residence to their place of work were found as follows

construct a grouped frequency distribution table with class size 5 for the data given above taking the first interval as 0-5. what main featues do you observe from his tabular representation.
View SolutionThe relative humidity (in %) of a certain city for a month of 30 days was as follows :
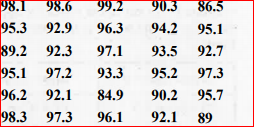 : Construct a grouped frequency distribution table with classes 84 - 86, 86-88 etc.
View SolutionThe relative humidity (in %) of a certain city for a month of 30 days was as follows :
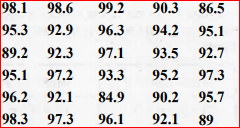 : Which month or season do you think this data is about ?
View SolutionThe relative humidity (in %) of a certain city for a month of 30 days was as follows :
 : What is the range of this data ?
View SolutionThe height of 50 students, measured to the nearest centimetres have been found to be as follows:

Represent the data given above by a grouped frequency distribution table, taking the class intervals as 160-165, 165-170 etc.
View SolutionThe heights of 50 students, measured to the nearest centimetres have been found to be as follows :
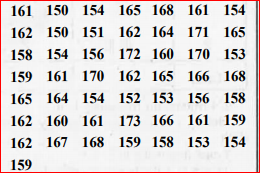 : What can you conclude about their heights from the table ?
View SolutionA study was conducted to find out the concentration of sulphur dioxide in the air in parts per million (ppm) of a certain city. The data obtained for 30 days is as follows :
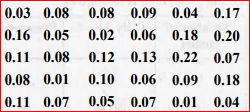 Make a grouped frequency distribution table for this data with class intervals as 0.00 - 0.04, 0.04 -0.08 and so on.
View SolutionA study was conducted to find out the concentration of sulphur dioxide in the air in parts per million (ppm) of a certain city. The data obtained for 30 days is as follows :
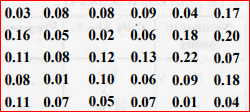 For how many days, was the concentra-tion ofsulphur dioxide more than 0.11 parts per million.
View SolutionThree coins were tossed 30 times simultaneously.Each time thenumber of heads occurring was noted down asfollows :
 Prepare a frequency distribution for the data given above
View SolutionThe value of `pi` upto 50 decimal places is given below: 3.14159265358979323846264338327950288419716939937510 (i) Make a frequency distribution of the digits from 0 to 9 after the decimal point. (ii) What are the most and the least frequently occurring digits?
View SolutionThe value of `pi` upto 50 decimal places is given below: 3.14159265358979323846264338327950288419716939937510 (i) Make a frequency distribution of the digits from 0 to 9 after the decimal point. (ii) What are the most and the least frequently occurring digits?
View SolutionThirty children were asked about the number of hours they watched TV programmes in the previous week. The results were found as follows :
 : How many children watched television for 15 or more hours a week ?
View SolutionThe following number of goals were scored by a team in a series of 10 matches : 2, 3, 4, 5, 0, 1, 3, 3, 4, 3 Find mean, median and mode of these scores :
View SolutionIn a mathematics test given to 15 students, the following marks (out of 100) are recorded: 41, 39, 48, 52, 46, 62, 54, 40, 96, 52, 98, 40, 42, 52, 60 Find the mean, median and mode of this data.
View SolutionThe following observations have been arranged in theascending order.If themedian of the data is 63, find the value of x : 29, 32, 48, 50, x,x + 2, 72, 78, 84, 95
View SolutionFind the mode of 14, 25, 14, 28, 18, 17, 18, 14, 23, 22, 14, 18.
View SolutionGive an example of a situation in which : the mean is an appropriate measure of central tendency.
View SolutionGive one example of a situations in which:
The mean is not an appropriate measure of central tendency but the median is an appropriate measure of central tendency?
View SolutionThe frequency distribution
 has been repesented graphically as follows
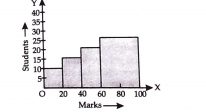
Do you think this representation is correct? Why?
View SolutionIn a diagonstic test in Mathematics given to students, the following marks are recorded: 46,52,48,11,41,62,54,53,96,40,98,44
which average will be a good representative of the above data and why?
View SolutionA child says that the median of 3,14,18,20,5 is 18. what does not the child understand about finding the median?
View SolutionA football player scored the following number of goals in the 10 matches:
1,2,5,8,1,4,7,9
since the number of matches is 10 therefore, the median=`(5th observation+6th observation)/2=(8+6)/2=7` is it’s the correct answer and why?
View SolutionIs its correct to say that in a histogram, the area of each rectangle is proportional to the class size of the corresponding class interval? If not, correct the statement
View SolutionThe class marks of a continuous distribution are 1.04, 1.14, 1.24, 1.34, 1.44, 1.54, 1.64 Is it correct to sya that he last interval will be 1.55-1.73? Justify your answer.
View SolutionThe blood groups of 30 students of Class VIII are recorded as follows: A, B, O, O, AB, O, A, O, B, A, O, B, A, O, O, A, AB, O, A, A, O, O, AB, B, A, O, B, A, B, O. Represent this data in the form of a frequency distribution table. Which is the most common, and which is the rarest, blood group among these students?
View SolutionThe value of `pi` upto 50 decimal places is given below: 3.14159265358979323846264338327950288419716939937510 (i) Make a frequency distribution of the digits from 0 to 9 after the decimal point. (ii) What are the most and the least frequently occurring digits?
View SolutionThe scores (out of 100) obtained by 33 students in a Mathematics test are :
69,48,84,58,84,48,73,83,48,66,58,66,64,71,64,66,69, 66,83,66,69,71,81,71,73,69,66,66,64,58,64,69and 69.
Prepare a frequency table for the above scores.
View SolutionA class consists of 50 students out of which 30 are girls, the mean of mark scored by girls in a test is 45 and that of boys is 30. determine the mean score of the whole class.
View SolutionMean of 50 observations was found to be 80.4. but later on, it was discovered that 96 was misread as 69 at one place. Find the corect mean.
View SolutionTen observations 6,14,15,17,x+1,2x-13,30,32,34,46 are written is an ascending order. The median of the data is 24. find the value of x.
View SolutionThe points scored by a basket ball team in a seris of matches are as follows:
17,2,7,27,25,5,14,18,24,48,10,8,7,10,28
Find the median and mode for the data.
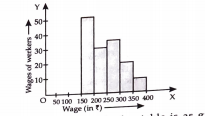
View SolutionIn the fig. there is a histogram depicting daily wages of workers in a factory. Construct the frequency distribution table
View SolutionThe following are the marks of 60 students in Mathematics
16,13,5,80,86,7,51,24,56,70,19,16,36,34,42,34,35,73,55,75,52,72,97,74,45,62, 68,86,35,81,75,55,26,95,31,7,78, 92,62,52,56,15,63,25,54,44,47,27,17,4,30
Construct a grouped distribution table with width 10 each of the class starting from 0-9.
View SolutionFind the mean of the given data
10,4,5,2,8,4
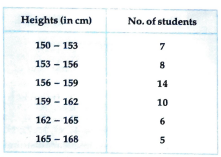
View SolutionDraw a histogram of the following distribution
View SolutionDraw a histogram to represent the following grouped frequency distribution:
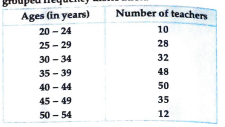
View SolutionThe length of 40 leaves of a plant are measured correct to one millimetre, and the obtained data is represented in the following table.
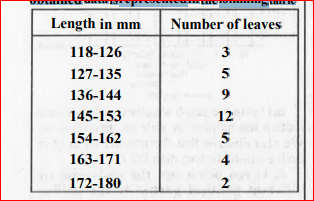 : Draw a histogram to represent the given data.
View SolutionThe marks obtained of a class of 80 students are given below

Construct a histogram to represent the data above.
View SolutionFollowing table shows a frequeny ditribution for the speed of cars pasing through a particular spot on a high way, draw the histogram and frequency polygon representing the data above.
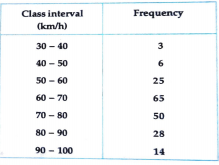
View Solution
EXAMPLE questions and complete solutions for chapter STATISTICS of MODERN PUBLICATION of Class 9