Complete Solutions to SHORT ANSWER TYPE QUESTIONS of chapter STATISTICS AND PROBABILITY of Class 9 book with complete answers and questions
| Class 9 | MATHS |
| Chapter | STATISTICS AND PROBABILITY |
| NCERT EXEMPLAR | SHORT ANSWER TYPE QUESTIONS |
| Number Of Questions | 20 |
| Academic Year | 2023-24 |
The blood groups of `30` students are recorded as follows:
A, B, O, A, AB, O, A, O, B, A, OB, B, A, AB, B, A,AB ,B, A, A, O, A, AB, B, A, O, B, A, B, A
Prepare a frequency distribution table for the data.
View SolutionThe value of `pi` upto 35 decimal places is given below
`3.14159265358973238462643383277950288`
Make a frequency distribution of the digits 0 to 9 after the decimal point.
View SolutionThe scores (out of 100) obtained by 33 students in a mathematics test are as follows
69.48.84,58,48,73,83,48,66,58,84,66,64,71,64,66,69,66,83,66,69,71,81,71,73,69,66,66,64,58,64,69,69.
Represent this data in the form of a frequency distribution.
View SolutionPrepare a continuous grouped frequency distribution from the following data
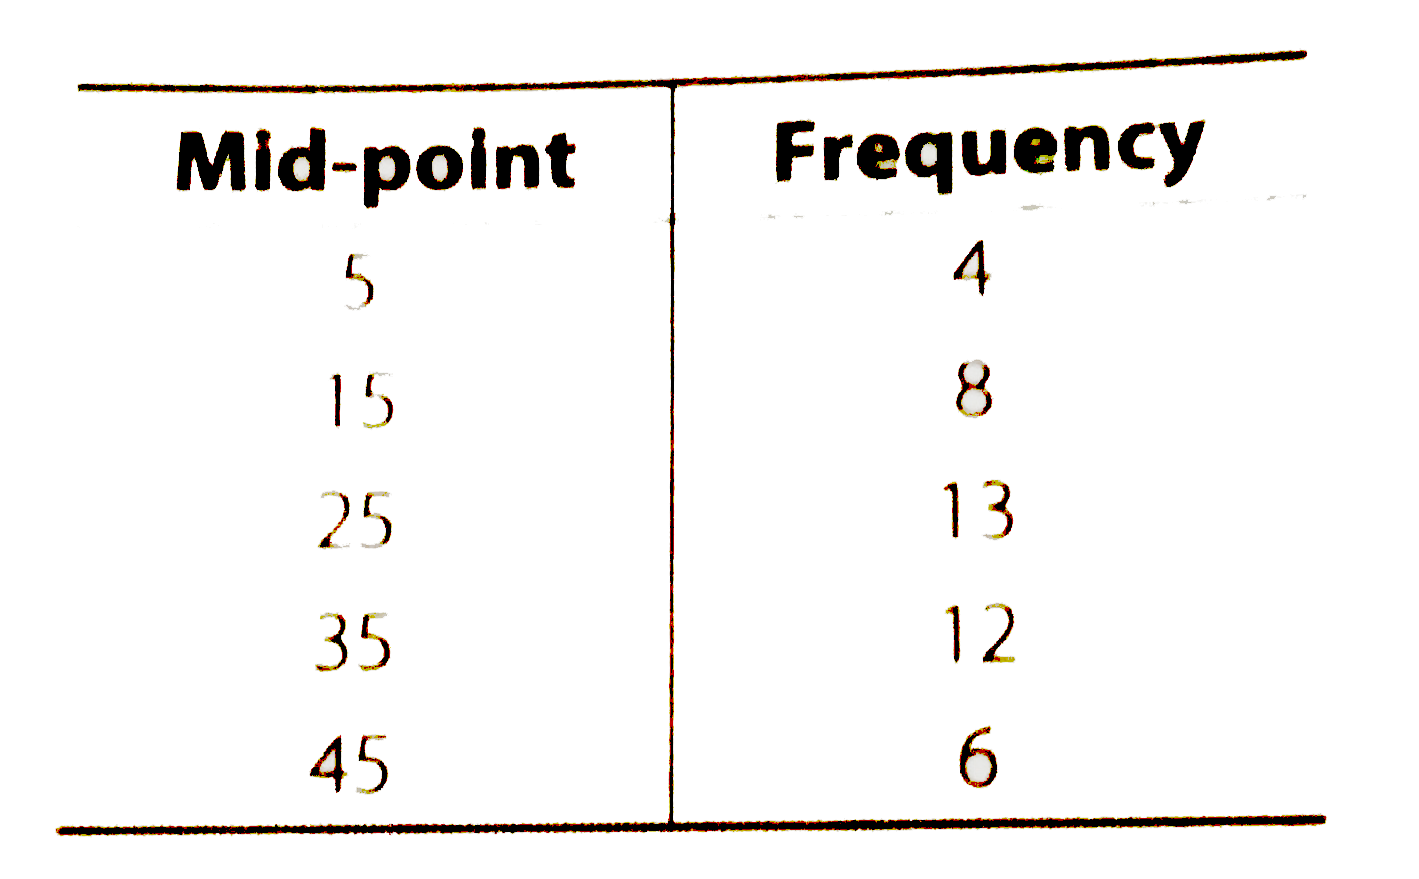
Also, find the size of class intervals.
View SolutionConvert the given frequency distribution into a continuouos grouped frequency distribution.
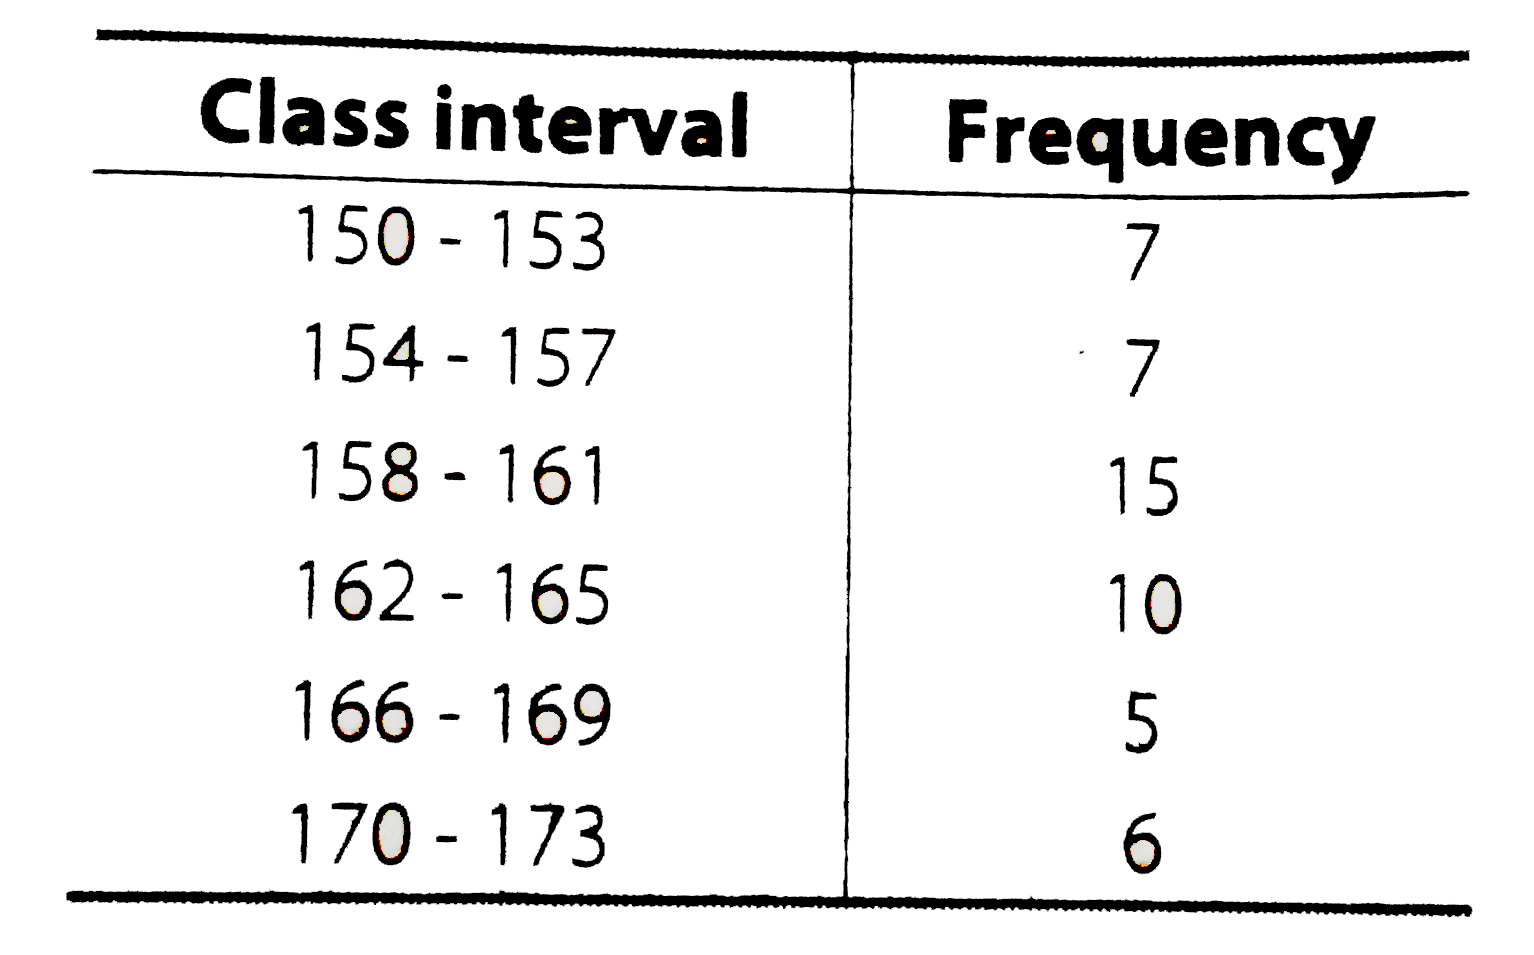
In which intervals would 153.5 and 157.5 be included?
View SolutionThe expenditure of a family of different heads in a month is given below

Draw a bar graph to represent the data above.
View SolutionExpenditure on education of a country during a five years period (2002-2006), in crore of rupees, is given below
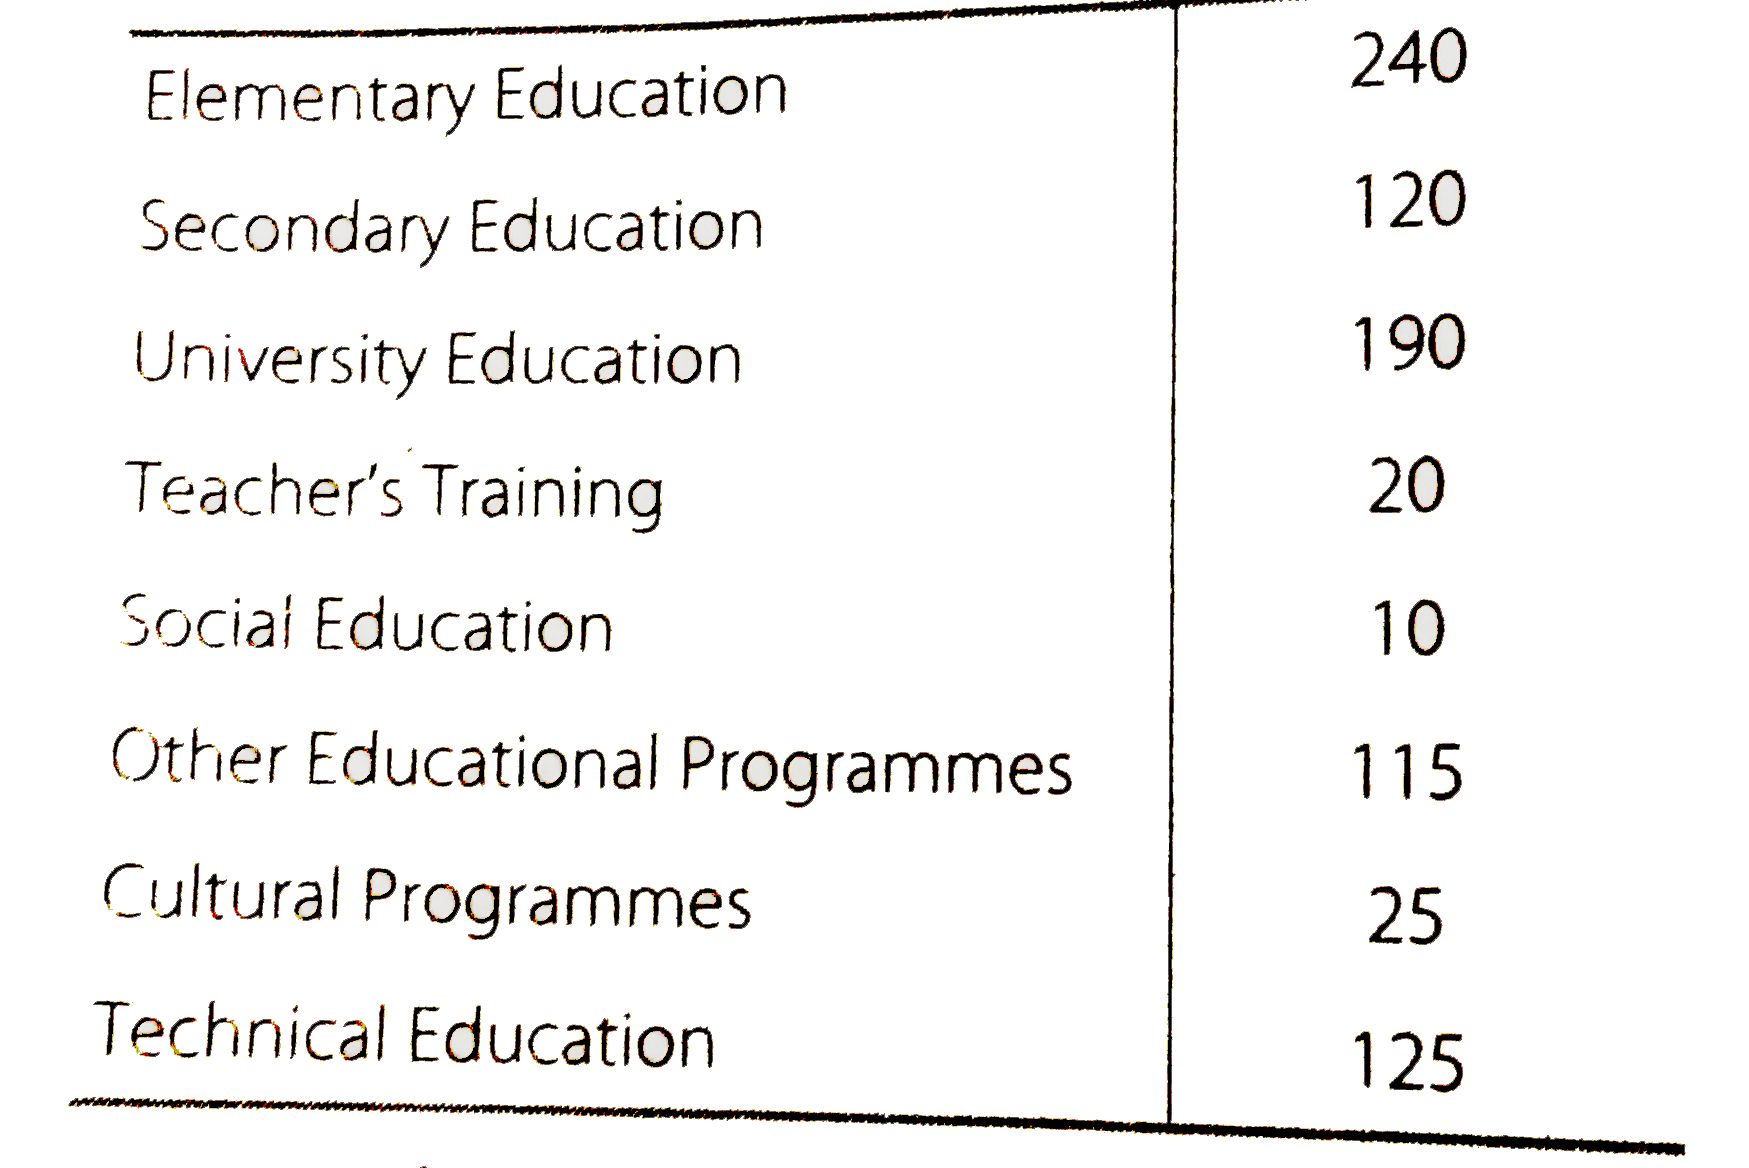
Represent the information above by a bar graph.
View SolutionThe following table gives the frequencies of most commonly used letters a,e,I,o,r,t,u, from a page of a book

Represent the information above by a bar graph.
View SolutionIf the mean of the following data is 20.2, then find the value of p.

View SolutionObtain the mean of the following distribution.
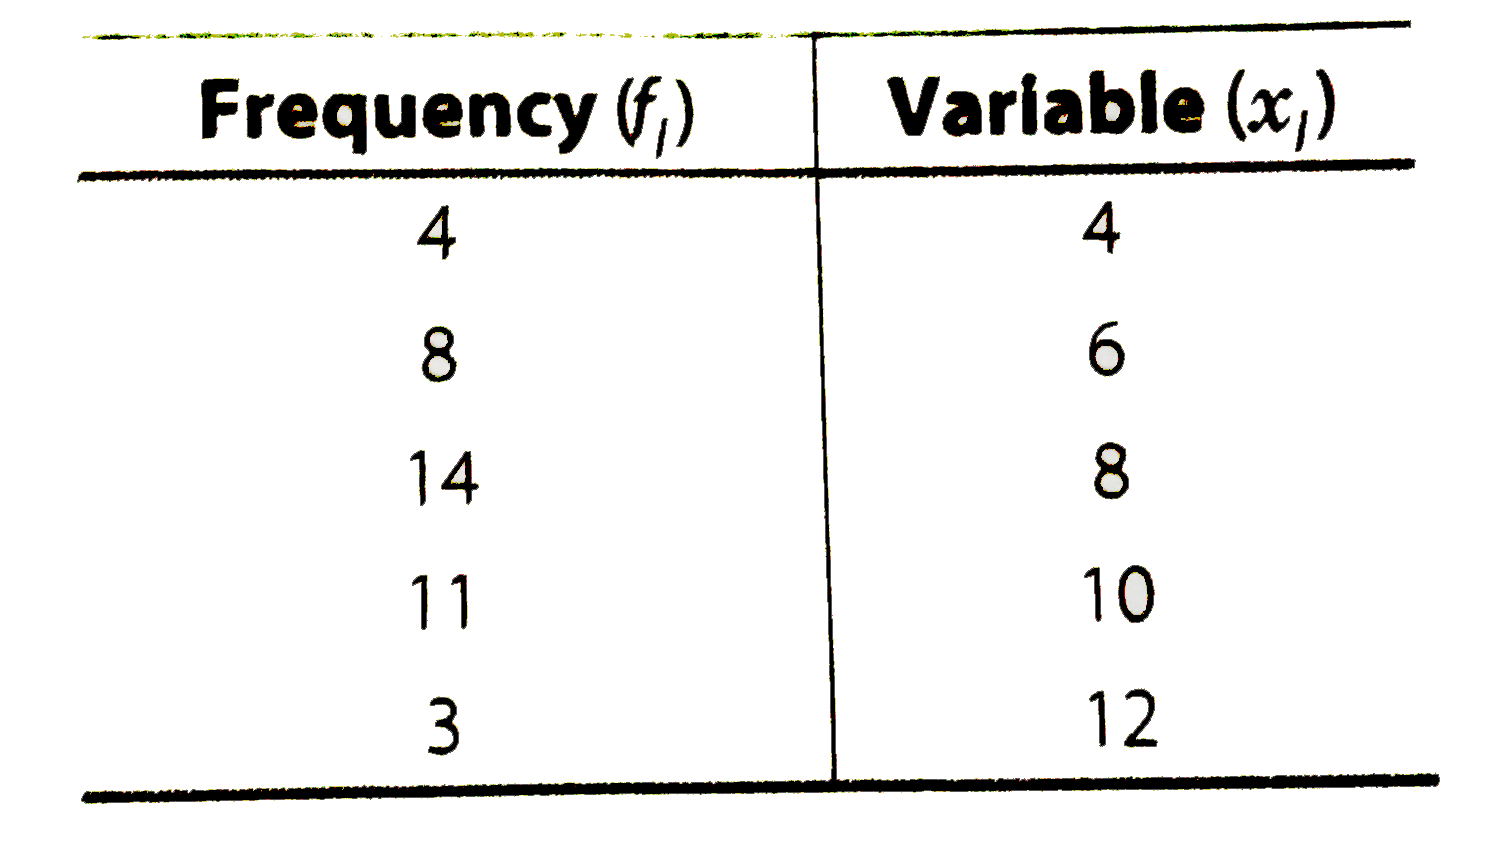
View SolutionA class consists of 50 students out of which 30 are girls. The mean of marks scored by girls in a test is 73 (out of 100) and that of boys is 71. Determine the mean score of the whole class.
View SolutionMean of 50 observations was found to be 80.4. But later on, it was discovered that 96 was misread as 69 at one place. Find the correct mean.
View SolutionTen observations `6`, `14`, `15`, `17`, `x+1`, `2x-13`, `30`, `32`, `34` and `43` are written in an ascending order. The median of the data is `24`. Find the value of `x`.
View SolutionThe points scored by a basket ball team in a series of matches are as follows
17, 2, 7, 27, 25, 5, 14, 18, 10, 24, 48, 10, 8, 7, 10, 28
Find the median and mode for the data.
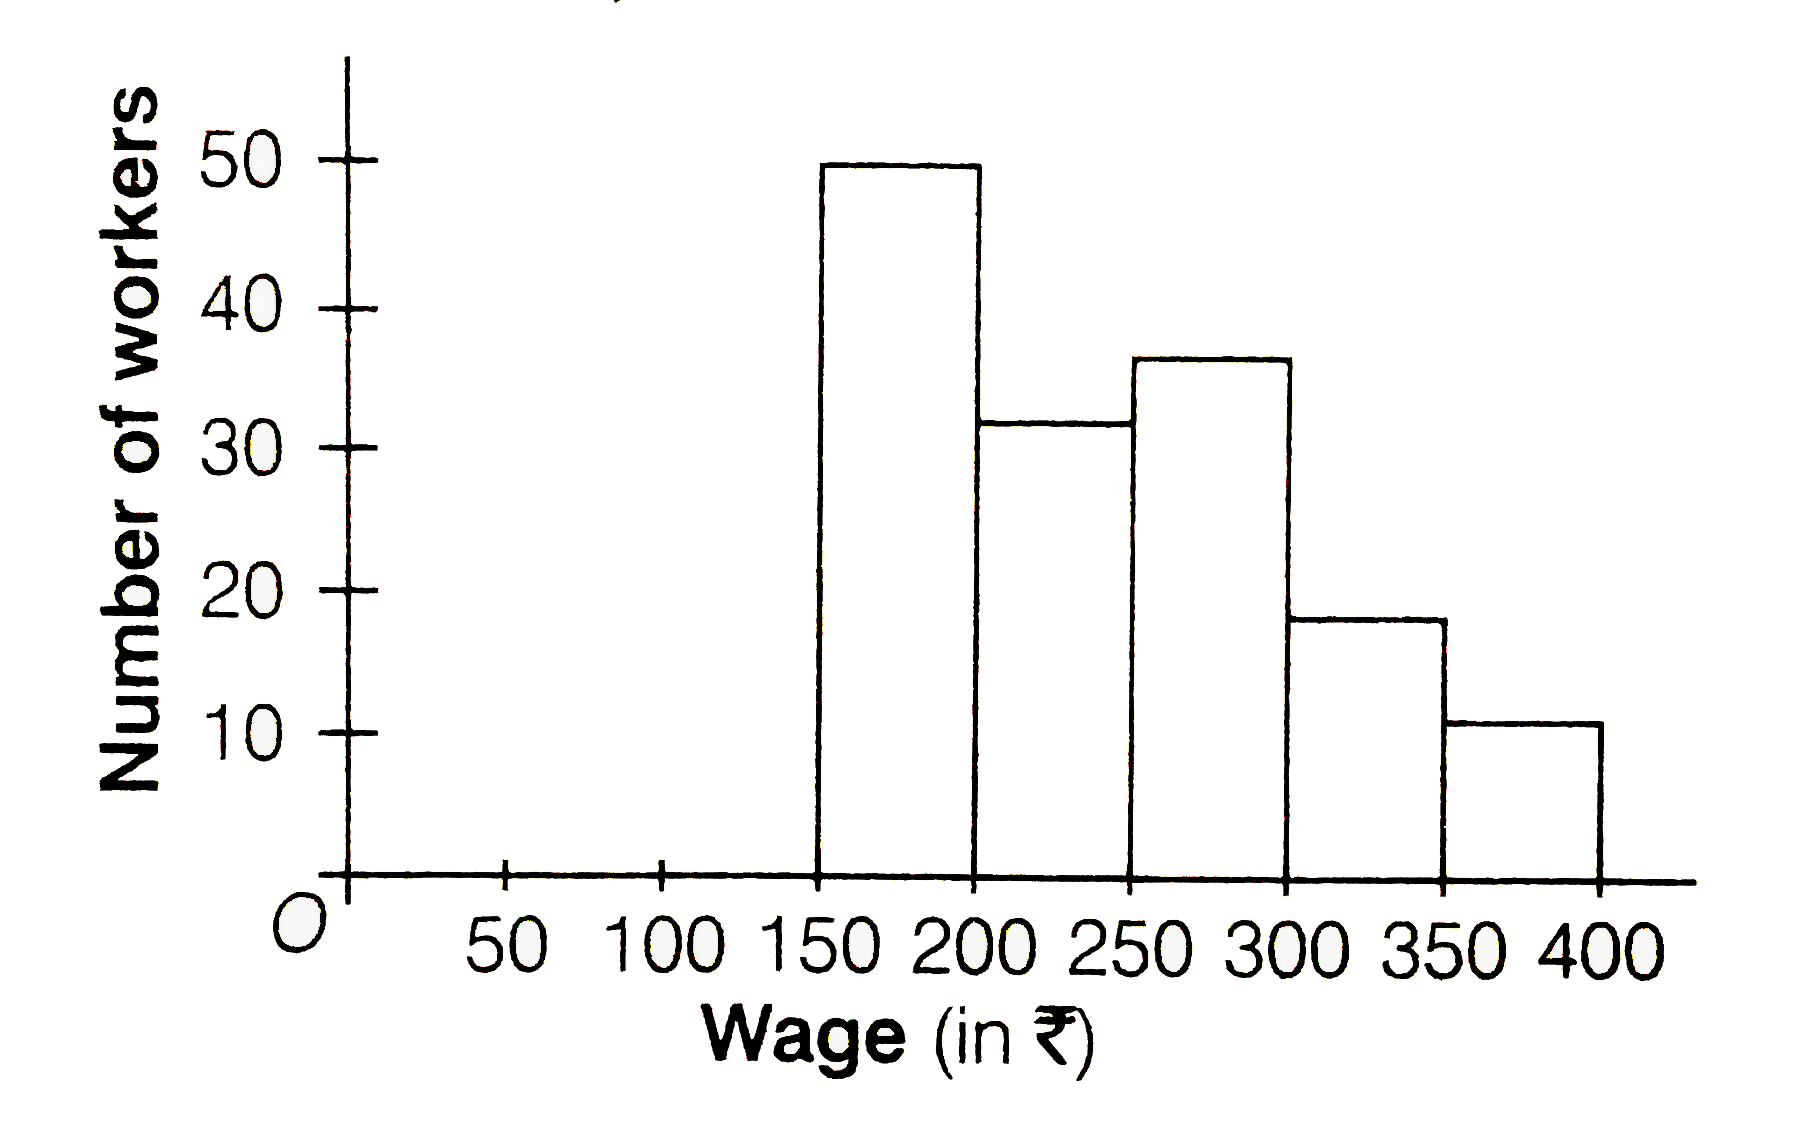
View SolutionIn the figure, there is histrogram depicting daily wages of workers in a factory. Construct the frequency distribution table.
View SolutionA company selected 4000 households at random and surveyed them to find out a relationship between income level and the number of televisions sets in a home. The information, so obtained is listed in the following table.
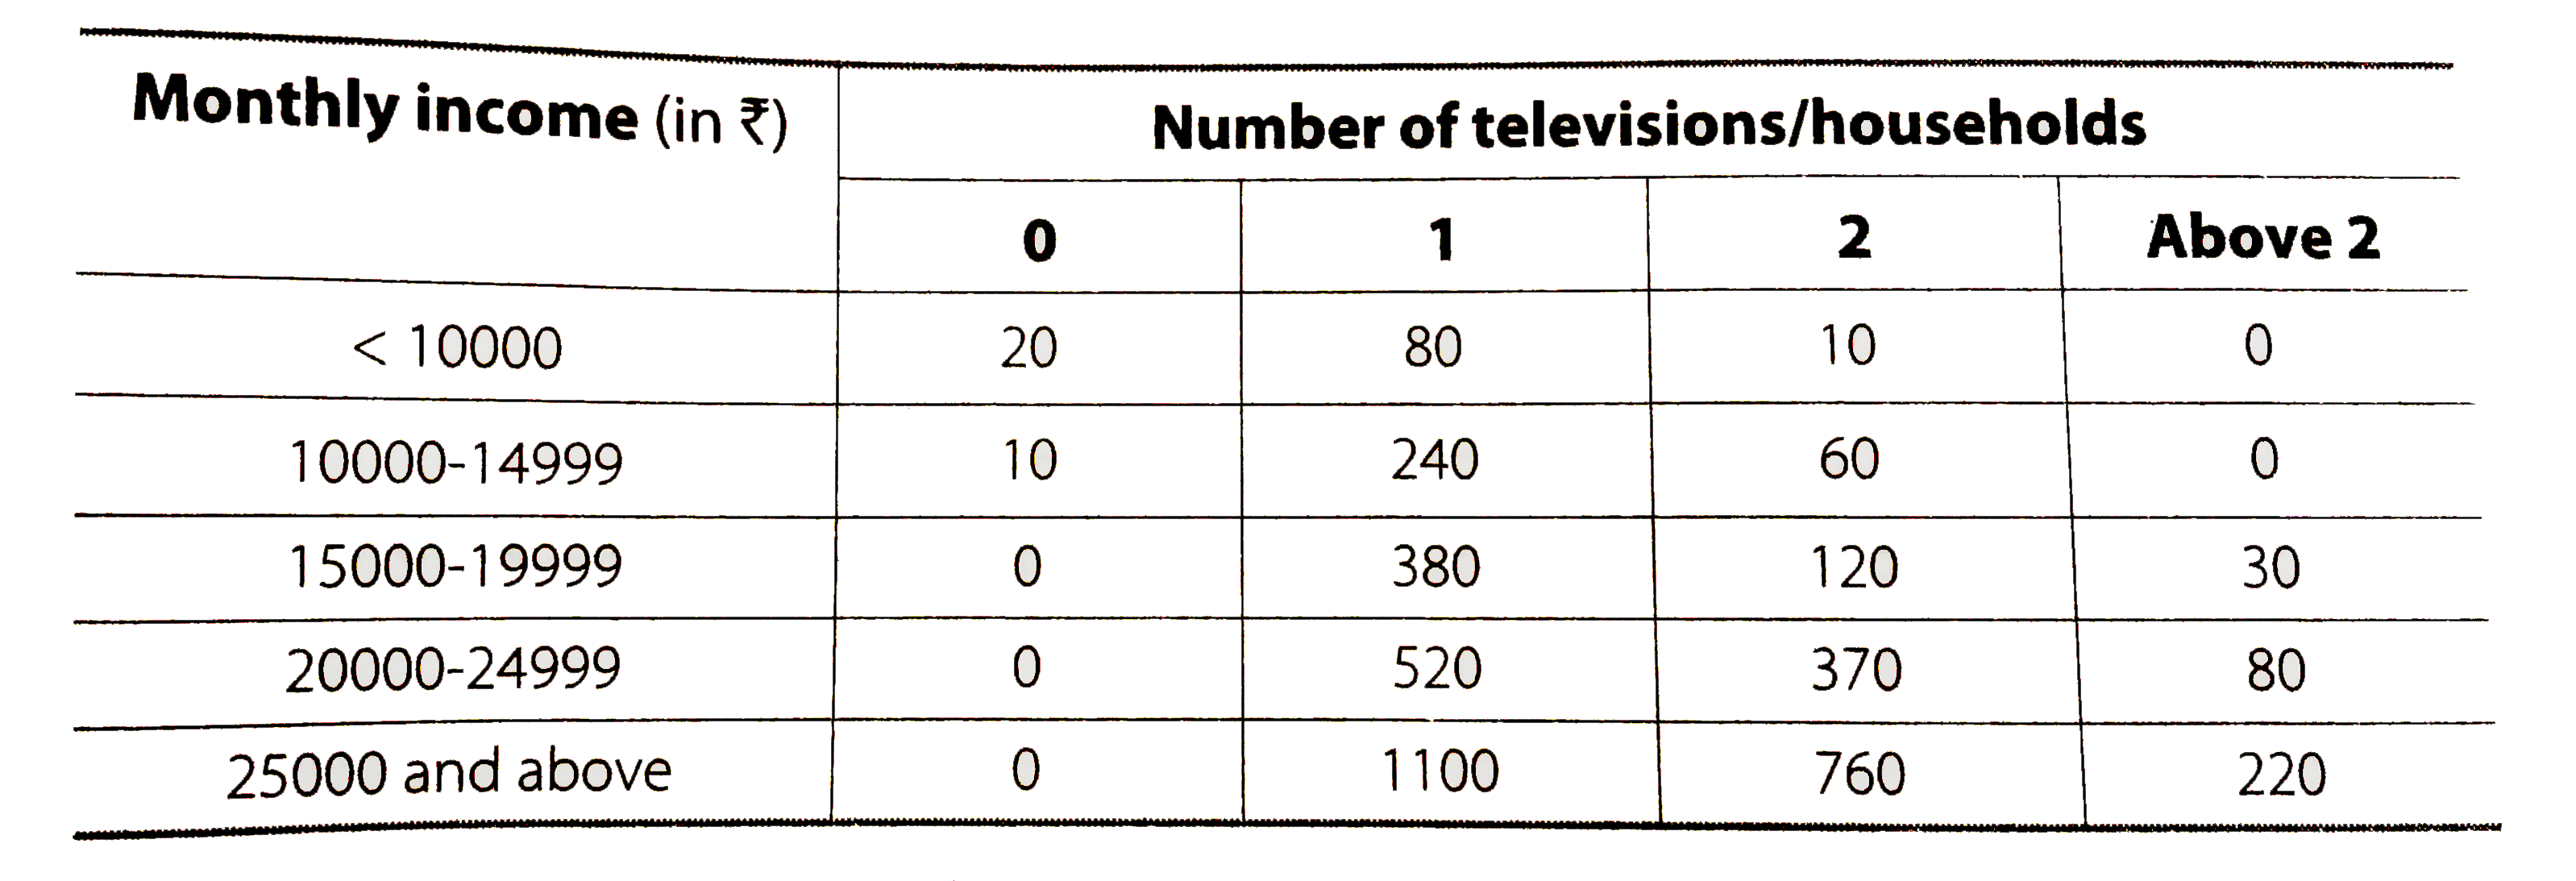
Find the probability
i) of a household earning Rs 10000- Rs 14999 per year and having exactly one television.
ii) of a household earning Rs 25000 and more per year owning 2 televisions.
iii) of a household not having any television.
View SolutionTwo dice are thrown simultaneouly 500 times. Each time the sum of the two numbers appearing on their tops is noted and recorded as given in the following table
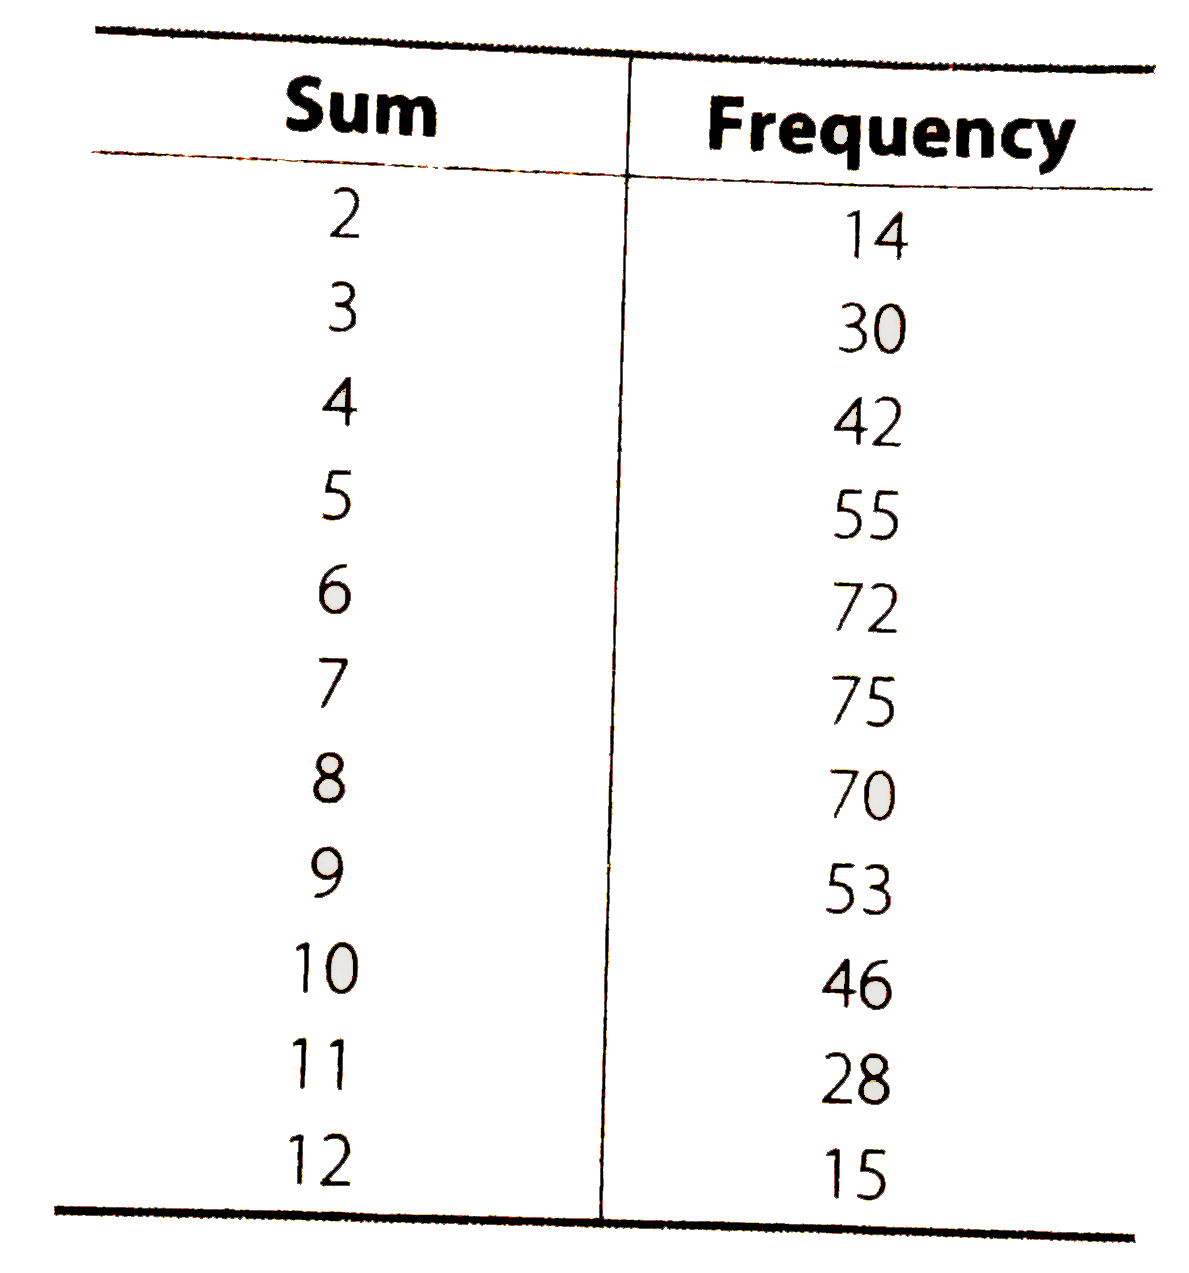
If the dice are thrown once more, then what is probability of getting a sum
i) 3?
ii) More than 10?
iii) Less than or equal to 5?
iv) Between 8 and 12?
View SolutionBulbs are packed in cartons each containing 40 bulbs, seven hundred cartons were examined for defective bulbs and the results are given in the following table.

One carton was selected at random. What is the probability that it has
i) no defective bulb?
ii) defective bulbs from 2-6?
iii) defective bulbs less than 4?
View SolutionOver the past 200 working days, the number of defective parts produced by a machine is given is given in the followig table.

Determine the probability that tomorrow's output will have
View SolutionA recent survey found that the edges ages of workers in a factory as follow.

If a person is selected at random, find the probability that the person is
View Solution
SHORT ANSWER TYPE QUESTIONS questions and complete solutions for chapter STATISTICS AND PROBABILITY of NCERT MATHS (ENGLISH) of Class 9