STATISTICS for Class 10 MATHS
Introduction
A branch of mathematics which will tell us how to analysis the information collected for some specific objective namely how to analysis the data. Though ye topic hum class 8 and 9 me padh chuke hai but this year we will go more deeper in statistics and as we already learn about collection of data, Graphical representation of data basically Bar Graph, Histogram, Frequency Polygon and Central tendency that is Mean, Mode and Median for ungrouped data. Now we will head our discussion towards Mean, Mode and Median of Grouped data and we shall also discuss the concept of cumulative frequency, the cumulative frequency distribution and how to draw cumulative frequency curves, called ogives.
Let's Learn
So students we represent the data in two forms one is Grouped data and other is Ungrouped data. Below is an example for both forms (Figure 1 is for ungrouped data and figure 2 is for grouped data).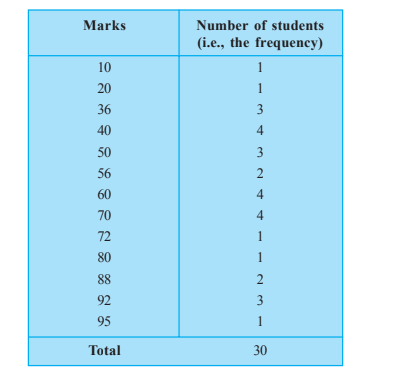
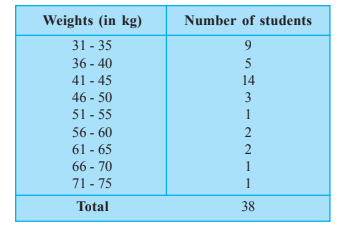
So in grouped data we have class intervals or you can say data is classified whereas in ungrouped data there are no class intervals. In this chapter we will basically deal with Grouped data.
Important Definition
1.Information collected for any specific objective is called Data.
2.Extraction of meaningful information is studied in a branch of mathematics called Statistics.
3.Ungrouped data is the data you first gather from an experiment or study. The data is raw that is, it’s not sorted into categories, classified, or otherwise grouped. An ungrouped set of data is basically a list of numbers.
4.Grouped data are data formed by aggregating individual observations of a variable into groups, so that a frequency distribution of these groups serves as a convenient means of summarizing or analyzing the data.
5.The mean is the average of the numbers.
6.The median is the middle number in a sorted, ascending or descending, list of numbers.
7.The mode is the value that appears most frequently in a data set. A set of data may have one mode, more than one mode.
8.Frequency is the number of times a particular value occurs in a set of data.
9.The total of a frequency and all frequencies so far in a frequency distribution, or the 'running total' of frequencies is called cumulative frequency.
Mean for grouped data
We know now that mean refers to the average of given observations of the data, we have already learnt how to find mean of raw and ungrouped data in class 9 , now we will learn how to find the mean of grouped data, for this we have 3 formulas.
1. Direct method
2. Assumed mean method
3. Step deviation method.
We will use different formulas according to given problems , basically according to given class mark and corressponding frequencies.
Direct method :
Mean=∑fi×xi∑fi
whenever given class mark and frequency are small we can use direct method for finding mean.
Here ∑fi means sum of all frequencies and ∑fi×xi means first multiply each frequency with corressponding class mark then add them together.
Example 1
A survey was conducted by a group of students as a part of their environment awareness programme, in which they collected the following data regarding the number of plants in 20 houses in a locality.
Find the mean number of plants per house.
So yaha pehle hum class mark find karenge
Classmark(xi)=UpperLowerclass2.
For example if I take the interval 0-2 then class mark = 0+22 = 1 , in similar way we will calculate class mark for each class and further find fi×xi as follows:
Now it can be observed from the table that ∑fi=20 and ∑fi×xi=162, So now put all values in the formula we get,
Mean=∑fi×xi∑fi=16220=8.1
Therefore, mean pnumber of plants per house is 8.1
Assumed mean method:
mean = a+(∑fi×di∑fi)
Here di=xi−a and a is the assumed value which has been choosen from xi.
Example 2
A class teacher has the following absentee record of 40 students of a class for the whole term. 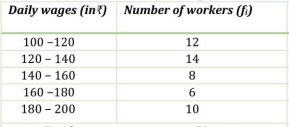
Find the mean number of days a student was absent.
So first we will calculate the class mark for each class interval as find in the previous example.
Now you can see that both the class mark and frequency is a bit large so we will use assumed mean method instead of using direct method. For this we will assume a from the obtained class mark.
Let a = 17(generally we choose the middle value from the all class mark ).
Now we will find di=xi−a=xi−17
It means we have to subtract 17 from each class mark, for example for the first class interval, class mark = 3 so corresponding di=3−17=−14, in a similar way we will calculate for other classes
Now we will multiply corresponding fito di like for first class fi = 11 and di = -14 so fi×di=−154
Similarly we can calculate for other classes.
Now as, ∑fi=40 & ∑fi×di=−181
we will put all these values in the formula : mean = a+∑fi×di∑fi
Mean = 17+(−18140)=17−4.525=12.48
Therefore, the mean number of days is 12.48 days for which a student is absent.
Note:This problem can also be done by direct method but just to make calculation efficient, we are using this method.
Example 3
The following distribution shows the daily pocket allowance of children of a locality .The mean pocket allowance is Rs. 18.
Find the missing frequency f.
Now here you can see frequency is small so we can use direct method of mean to find the unknown value f, so first we will calculate class mark for each class as we have done in previous example. 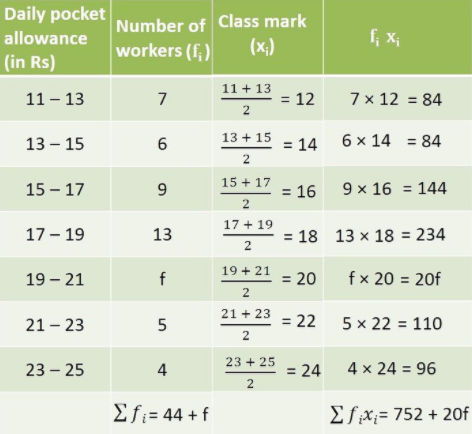
Now from the table you can observe that : ∑fi=44+f and ∑fi×xi=752+20f
Put all thse values in the formula , mean = ∑(fi×xi)∑fi
Since mean is given as 18 so we get, 18=752+20f44+f( Use cross multiplication )
18×(44+f)=752+20f
18×44+18f=752+20f
792+18f=752+20f
792−752=20f−18f
40=2f
so f = 20
Step-deviation method:
Mean =a+h(∑fiui∑fi),
ui=xi−ah, where a is the assumed mean which has been chosen from xi and h is the class size(upper class limit - lower class limit).
Example 4
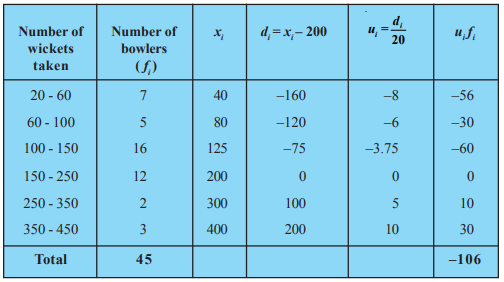
The distribution below shows the number of wickets taken by bowlers in
one-day cricket matches. Find the mean number of wickets by choosing a suitable
method. What does the mean signify ?
Here, the class size varies, and the xis are large. Let us still apply the step-deviation method with a=200 and h=20. Then, we obtain the data as shown below
So, ∑fiui∑fi=−10645. Therefore Mean =a+h(∑fiui∑fi)=200+20(−10645)=200–47.11=152.89.
This tells us that, on an average, the number of wickets taken by these 45 bowlers
in one-day cricket is 152.89.
Mode of Grouped Data
Toh bachcho mode ka matlab h wo observation jo given data me sabse jayda baar aayi ho, ya jiski frequency sabse jayda ho. Is class me hum mode nikalne ka naya formula seekhne wale hai, jo ki grouped data ke liye use hoga .
Mode for grouped data:
Mode = l+(f1−f02f1−f0−f2)×h
Here a class with the maximum frequency, called the modal class.
l = lower limit of the modal class,
h = size of the class interval (assuming all class sizes to be equal),
f1= frequency of the modal class,
f0= frequency of the class preceding the modal class,
f2= frequency of the class succeeding the modal class.
Example 5
The following table shows the ages of the patients admitted in a hospital during a year:
Find the mode of the data given above.
So our first aim is to find class mark for each class that we already know how to find and then the most important part is to find modal class ( class with highest frequency)
so 35-45 will be the modal class as it has the highest frequency 23.
Lower limit(l) of modal class = 35
Frequency (f1) of modal class = 23
Class size (h) = 10
Frequency (f0) of class preceding the modal class = 21 ( means modal class se pehle wali class ki frequency)
Frequency (f2) of class succeeding the modal class = 14 (modal class se next class ki frequency)
Now put all values in the formula :
Mode = l+(f1−f02f1−f0−f2)×h
Mode = 35+(23−212×23−21−14)×10=36.81
Mode is 36.8. It represent that the age of maximum number of patients admitted in hospital was 36.8 years.
Median of Grouped Data
So median of any given data simply refers to middle observation, Lets recapitulate the previous knowledge, when we are given even number of observations then average of (n2) th and its next observation is used to refer as median after they are arranged in ascending or descending manner . For example : If you are given the marks of 6 students of your class as : 10, 8, 2, 5, 9,1
Then to find its median we will first arrange it in ascending or descending order as : 1,2,5,8,9,10, since here we have n = 6 so (n2) th observation means 62th observation, so median will be equal to average of 3rd and 4th observation that is:
Median = 5+82=6.5
In a similar way if we have odd number of observations then n+12 th observation will be the median. For example: if we have 45, 98, 76, 65, 12, here you can see we have 5 observations so n= 5 , then
Median = n+12=5+12 = 3rd observation will be the required median after arranging in ascending or descending order.
12, 45, 65, 76, 98, here you can see 3 rd observation is 65 so required median is 65.
But now we will go a bit advance in this process and find medain for grouped data, for this we will use the following formula :
Medain of grouped data :
Median = l+⎛⎜
⎜⎝(n2)−cff⎞⎟
⎟⎠×h
A class whose cumulative frequency is greater than (and nearest to) n2 , where n is total observations is called the median class
l = lower limit of median class,
n = number of observations,
cf = cumulative frequency of class preceding the median class,
f = frequency of median class,
h = class size (assuming class size to be equal).
Example 6
The following frequency distribution gives the monthly consumption of electricity of
68 consumers of a locality. 
Find the median ?
So median find karne ke liye sabse pehle hum har class ke liye cumulative frequency find karenge, Iske liye hum har class ki frequency and usse upar wali sari classes ki frequency ko add karenge
Jaise pehli class h 65-85, now you can see isse upar aur koi class nahi hai toh iski cumulative frequency 4 hogi
For second class 85- 105 cumulative frequency will be the sum of 4 and 5 that is 9, in a similar way hum har class ke liye cumulative frequency find karenge
Now from the above table you can observe that :
n=∑fi=68
Now Cumulative frequency (cf) just greater than n2 ( i.e. 682 = 34) is 42, belonging to class interval 125 - 145.
Therefore, median class = 125 - 145
Lower limit (l) of median class = 125
Class size (h) = 20
Frequency (f) of median class = 20
Median class ki previous class matlab 105 -125 ki cumulative frequency (cf) = 22
Now we will put all these values in formula : Median = l+⎛⎜
⎜⎝(n2)−cff⎞⎟
⎟⎠×h
Median = 125+(34−2220)×20
on solving this we get, median = 137.
Example 7
The following frequency distribution gives the monthly consumption of electricity of 68 consumers of a locality. Find the Mean, Mode and median and then compare them ?.
So iska median (that is 137) hum already example 5 me nikal chuke hai, ab hum iska mode aur find karenge, phir empirical relationship between the three measures of central tendency that is :
3 Median = Mode + 2 Mean, Iska use karenge to find mean.
So to find mode we will first find modal class (class with highest frequency ) that is 125 - 145 with frequency 20
Therefore, Modal class = 125 -145
Lower limit (l) of modal class = 125
Frequency (f1) of modal class = 20
Frequency(f0) of class preceding modal class = 13
Frequency (f2) of class succeeding the modal class = 14
put all these values in the formula :
Mode = l+(f1−f02f1−f0−f2)×h
Mode = 125+(20−132×20−13−14)×20=135.76
So mode of given data is 135.76
Now since, 3 Median = Mode + 2 Mean
3(137) = 135.76 + 2 Mean
411 = 135.76 - 2 Mean
411−135.762 = Mean
So mean = 137.62
So it can be observed that all three values are approximately equal.
Graphical Representation of Cumulative Frequency Distribution
Bachcho jaisa ki aap jantey hai ki graphical representations se kisi bhi data ko samjhna ya represent karna easy ho jaata hai aur apne pichli class mein data ko bar graphs, histogram aur frequency polygons mein represent karna sikh liya tha lekin ab hum cumulative frequency curve or an ogive ko represent karna sikhenge. Cumulative frequency curve do types ke hotey hai,
(i) Less than type ogive : Kisi grouped data ko represent karne ke liye hum upper class limits ko horizontal axis(x-axis) mein mark karenge aur cumulative frequency ko vertical axis(y-axis) mein mark karenge by choosing a convenient scale. Iske baad hum ordered points(upper limit,
corresponding cumulative frequency) ko graph mein plot karkey unhey free hand smooth curve se join kar denge. Iske baad humey jo curve milega wo ogive of less than type hoga.
(ii) More than type ogive : Kisi grouped data ko represent karne ke liye hum lower class limits ko horizontal axis(x-axis) mein mark karenge aur cumulative frequency ko vertical axis(y-axis) mein mark karenge by choosing a convenient scale. Iske baad hum ordered points(lower limit,
corresponding cumulative frequency) ko graph mein plot karkey unhey free hand smooth curve se join kar denge. Iske baad jo humey curve milega wo ogive of more than type hoga.
Example 8
The following table gives the distribution of the life time of 400 neon lamps Find the median life of a lamp.
Median class = 3000−3500
l=3000
h=500
cf=130
f=86
Median=l+(n2)−cf86⋅500
=3000+200−13086⋅500
=3406.98hours
Summary
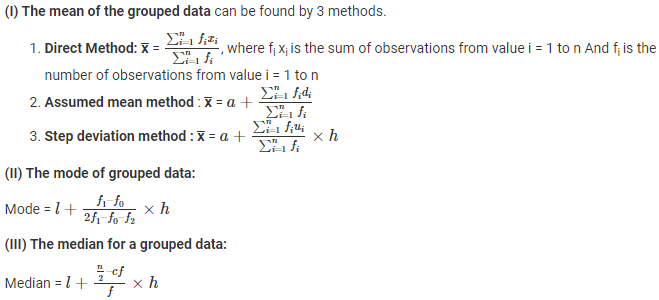
Let's Revise
Statistics.
- Alphabets, numbers, observations, etc ka collection data kahlata hai.
- Data organization
- Ek particular quantity kitni baar repeat ho rhi hai kisi data mein ussey frequency kahtey hai.
- Frequency distribution
- Grouped data
- Mean :
(i) Direct Method :
Mean=∑fi×xi∑fi, yha xi( Class Mark) =(Upper Class Limit + Lower Class Limit2) aur fi, frequencies of respective observations hai.
(ii) Assumed Mean Method :
Mean = a+(∑fi×di∑fi)
yha di=xi−a hai aur a ek assumed value hai jo xi mein se choose ki gyi hai.
(iii) Step Deviation Method : Mean =a+h(∑fiui∑fi),
ui=xi−ah, yha a assumed mean hai jo xi mein se choose ki gyi hai aur h is the class size(upper class limit - lower class limit).
Mode : So, mode ka matlab hai wo observation jo given data me sabse jayda baar aayi ho, ya jiski frequency sabse jayda ho.
Mode for grouped data : l+(f1−f02f1−f0−f2)×h
Here a class with the maximum frequency, called the modal class.
l = lower limit of the modal class,
h = size of the class interval (assuming all class sizes to be equal),
f1= frequency of the modal class,
f0= frequency of the class preceding the modal class,
f2= frequency of the class succeeding the modal class.
- Median :
Median = l+⎛⎜ ⎜⎝(n2)−cff⎞⎟ ⎟⎠×h
where l = lower limit of median class,
n = number of observations,
cf = cumulative frequency of class preceding the median class,
f = frequency of median class,
h = class size (assuming class size to be equal).
- 3Median = Mode + 2 Mean
- Graphical Representation of Cumulative Distribution Curve(Ogive) :
(i) Less than type Ogive : Data ko iss tarh ke graph se represent karne ke liye upper class limits ko horizontal axis(x-axis) mein aur uske corresponding cumulative frequencies ko vertical axis mein mark karkey ordered points ko ek smooth curve se join karna hota hai.
(ii) More than type Ogive : Data ko iss tarh ke graph se represent karne ke liye lower class limits ko horizontal axis(x-axis) mein aur uske corresponding cumulative frequencies ko vertical axis mein mark karkey ordered points ko ek smooth curve se join karna hota hai.


