Problem Set-6 from TARGET MATHS (HINGLISH) STATISTICS for Class 10
| Class 10 | MATHS |
| Chapter | STATISTICS |
| TARGET MATHS (HINGLISH) | Problem Set-6 |
| Medium | English |
| Academic Year | 2023-2024 |
Question 15
The time required for some students to complete a science experiment and the number of students is shown in the following grouped frequency distribution table. Draw the frequency polygon with the help of histogram using given information :
Time required for experiment ( minutes)20−2222−2424−2626−2828−3030−32Number of students61420161210View SolutionQuestion 19
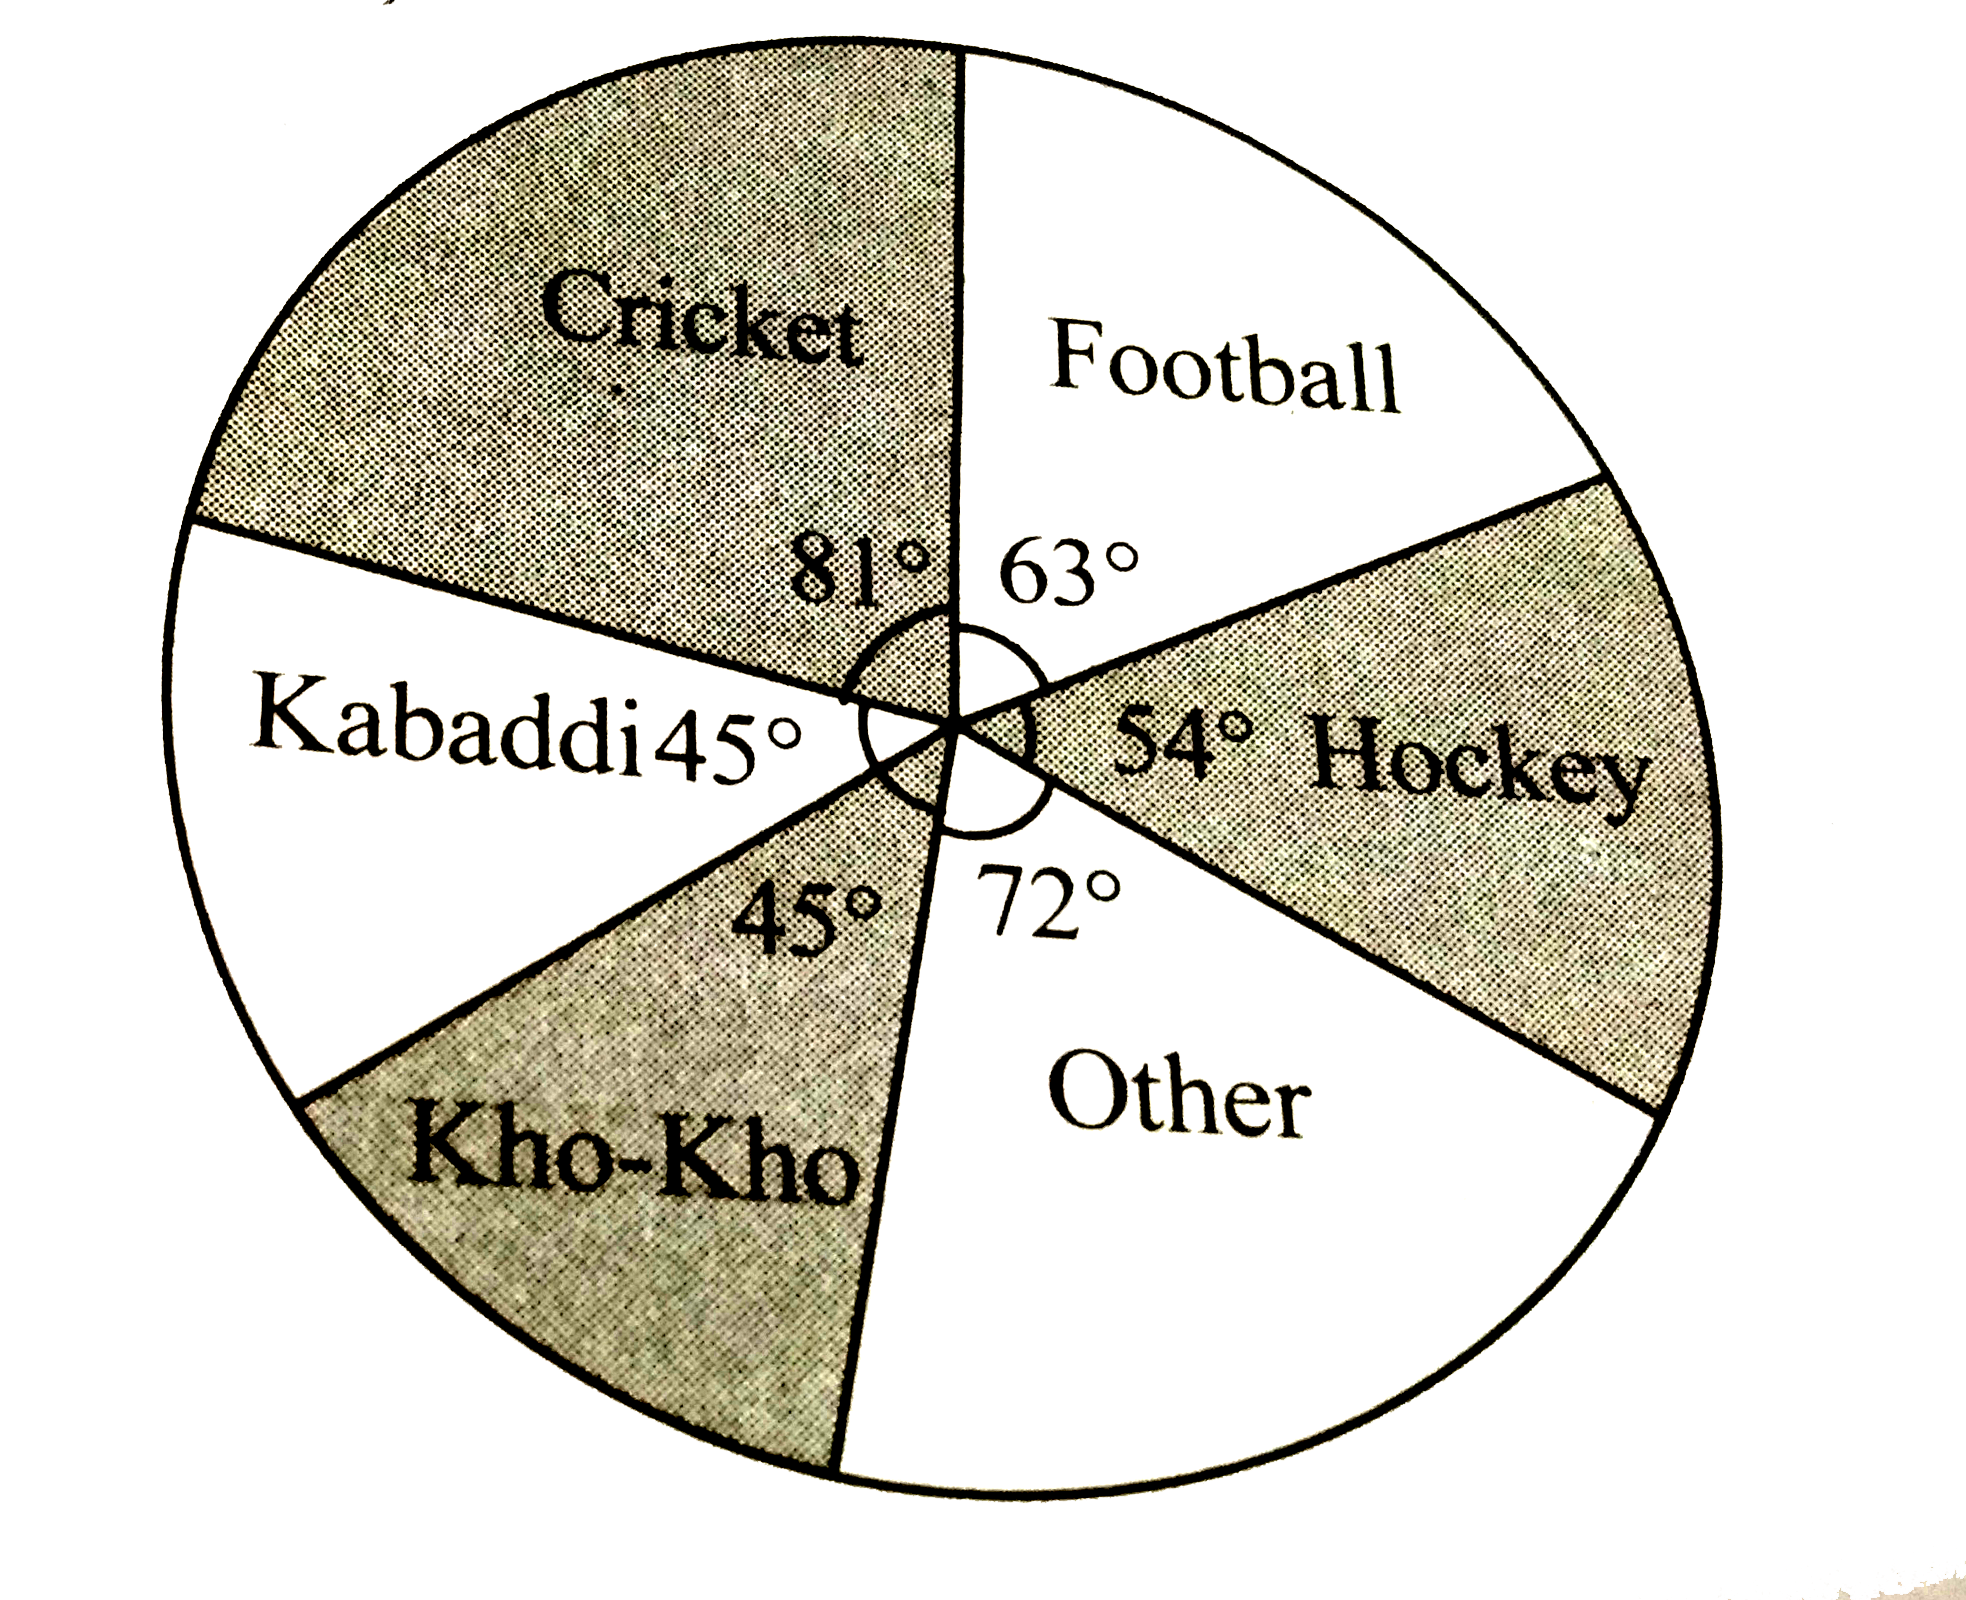
A survey of students was made to know which game they like. The data obtained in the survey is presented in the given pie diagram. If the total number of students are 1000.
i. How many students like cricket?
ii how manystudents like football?
iii how many students perfer other games?
 View Solution
All Exercises from TARGET MATHS (HINGLISH) Class 10 MATHS STATISTICS
- TRY THIS
- TRY THIS
- TRY THIS
- TRY THIS
- MULTIPLE CHOICE QUESTIONS
- MULTIPLE CHOICE QUESTIONS
- MULTIPLE CHOICE QUESTIONS
- MULTIPLE CHOICE QUESTIONS
- ADDITIONAL PROBLEMS FOR PRACTICE
- ADDITIONAL PROBLEMS FOR PRACTICE
- ADDITIONAL PROBLEMS FOR PRACTICE
- ADDITIONAL PROBLEMS FOR PRACTICE
- APPLY YOUR KNOWLEDGE
- APPLY YOUR KNOWLEDGE
- APPLY YOUR KNOWLEDGE
- APPLY YOUR KNOWLEDGE
- CHAPTER ASSESSMENT
- CHAPTER ASSESSMENT
- CHAPTER ASSESSMENT
- CHAPTER ASSESSMENT
- PRACTISE SET 6.1
- PRACTISE SET 6.1
- PRACTISE SET 6.1
- PRACTISE SET 6.1
- PRACTISE SET 6.2
- PRACTISE SET 6.2
- PRACTISE SET 6.2
- PRACTISE SET 6.2
- PRACTISE SET 6.3
- PRACTISE SET 6.3
- PRACTISE SET 6.3
- PRACTISE SET 6.3
- PRACTISE SET 6.4
- PRACTISE SET 6.4
- PRACTISE SET 6.4
- PRACTISE SET 6.4
- PRACTISE SET 6.5
- PRACTISE SET 6.5
- PRACTISE SET 6.5
- PRACTISE SET 6.5
- PRACTISE SET 6.6
- PRACTISE SET 6.6
- PRACTISE SET 6.6
- PRACTISE SET 6.6
- PROBLEM SET-6
- PROBLEM SET-6
- PROBLEM SET-6
- PROBLEM SET-6
- EXAMPLE
- EXAMPLE
- EXAMPLE
- EXAMPLE


