Additional Problems for Practice from TARGET MATHS (HINGLISH) STATISTICS for Class 10
| Class 10 | MATHS |
| Chapter | STATISTICS |
| TARGET MATHS (HINGLISH) | Additional Problems for Practice |
| Medium | English |
| Academic Year | 2023-2024 |
Question 33
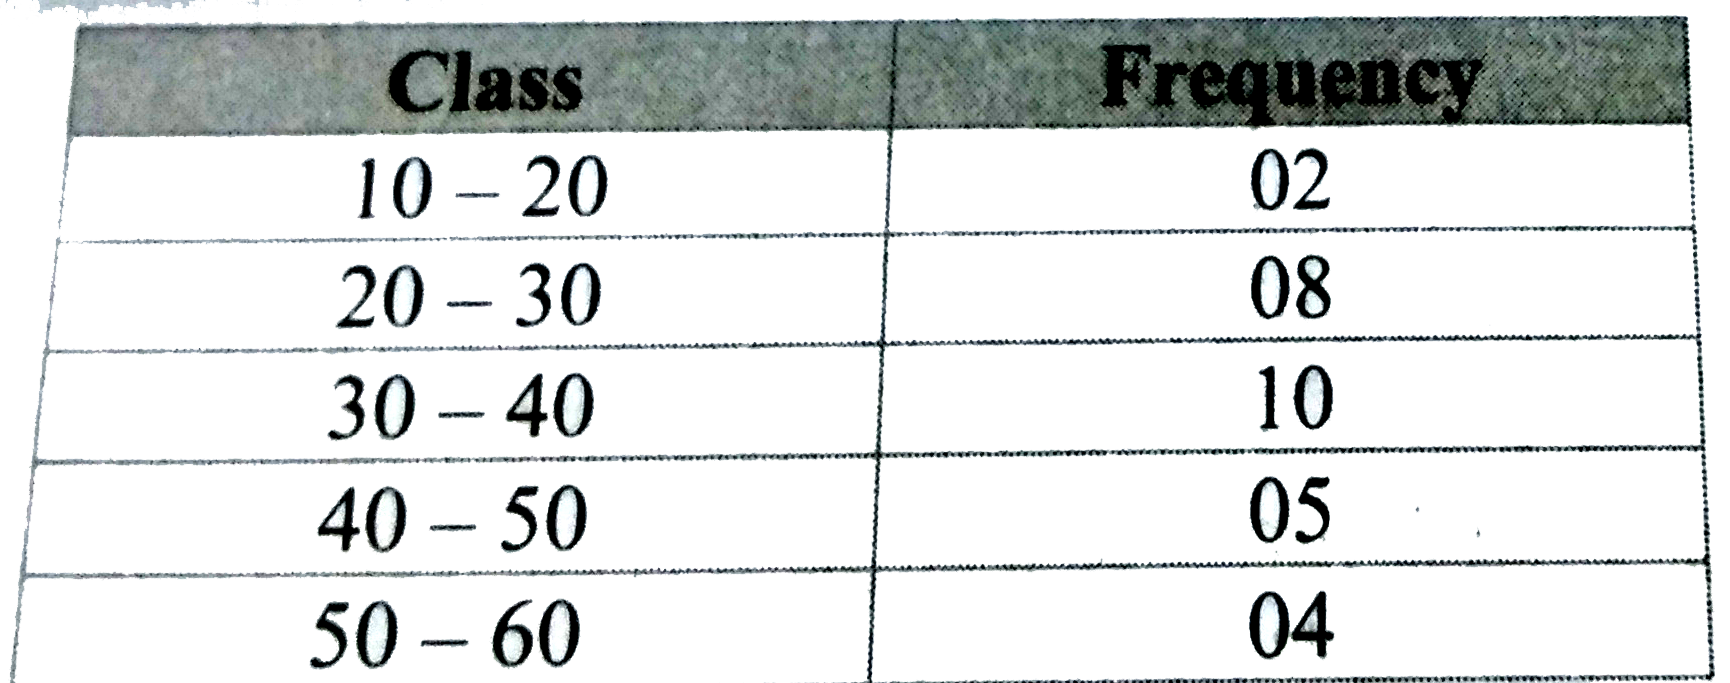
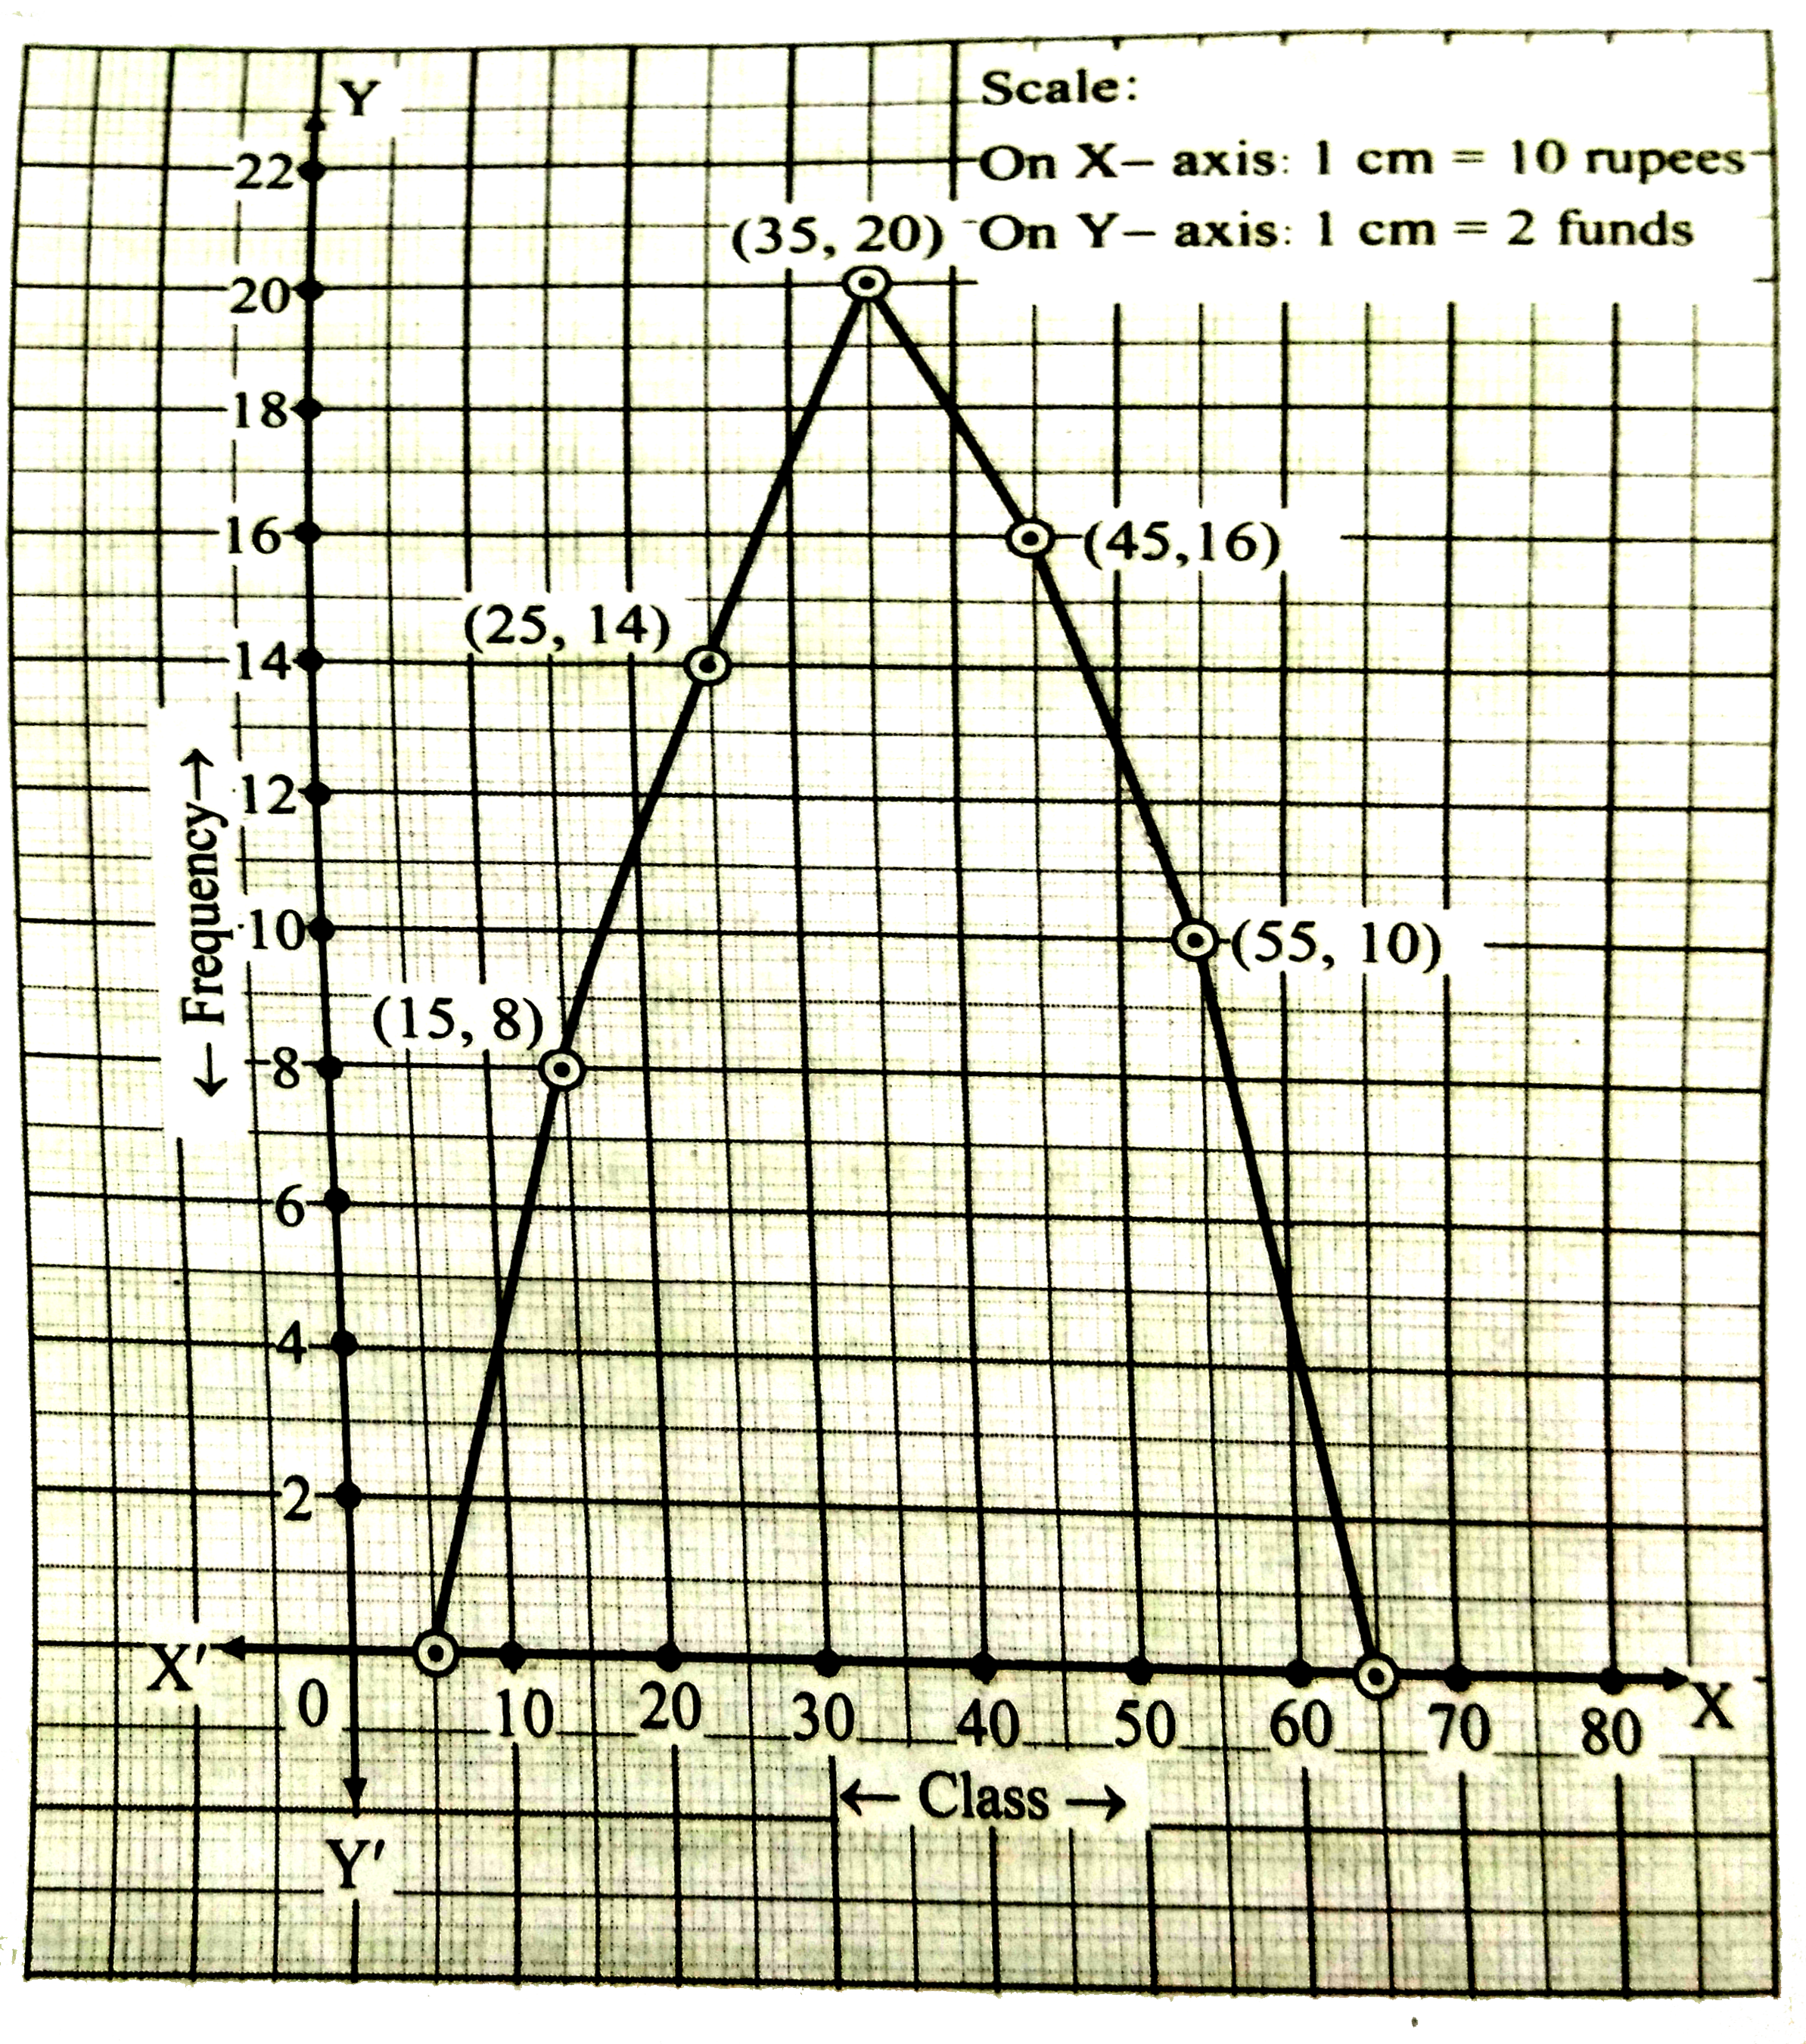
Answer the following questions based on the frequency polygon given in the figure.
i. Write frequency of the class 50−60.
ii State the class whose frequency is 14.
iii. State the class whose class mark is 55.
iv. Write the class in which the frequency is maximum.
v. Write the classes whose frequencies are zero.
 View Solution
Question 41
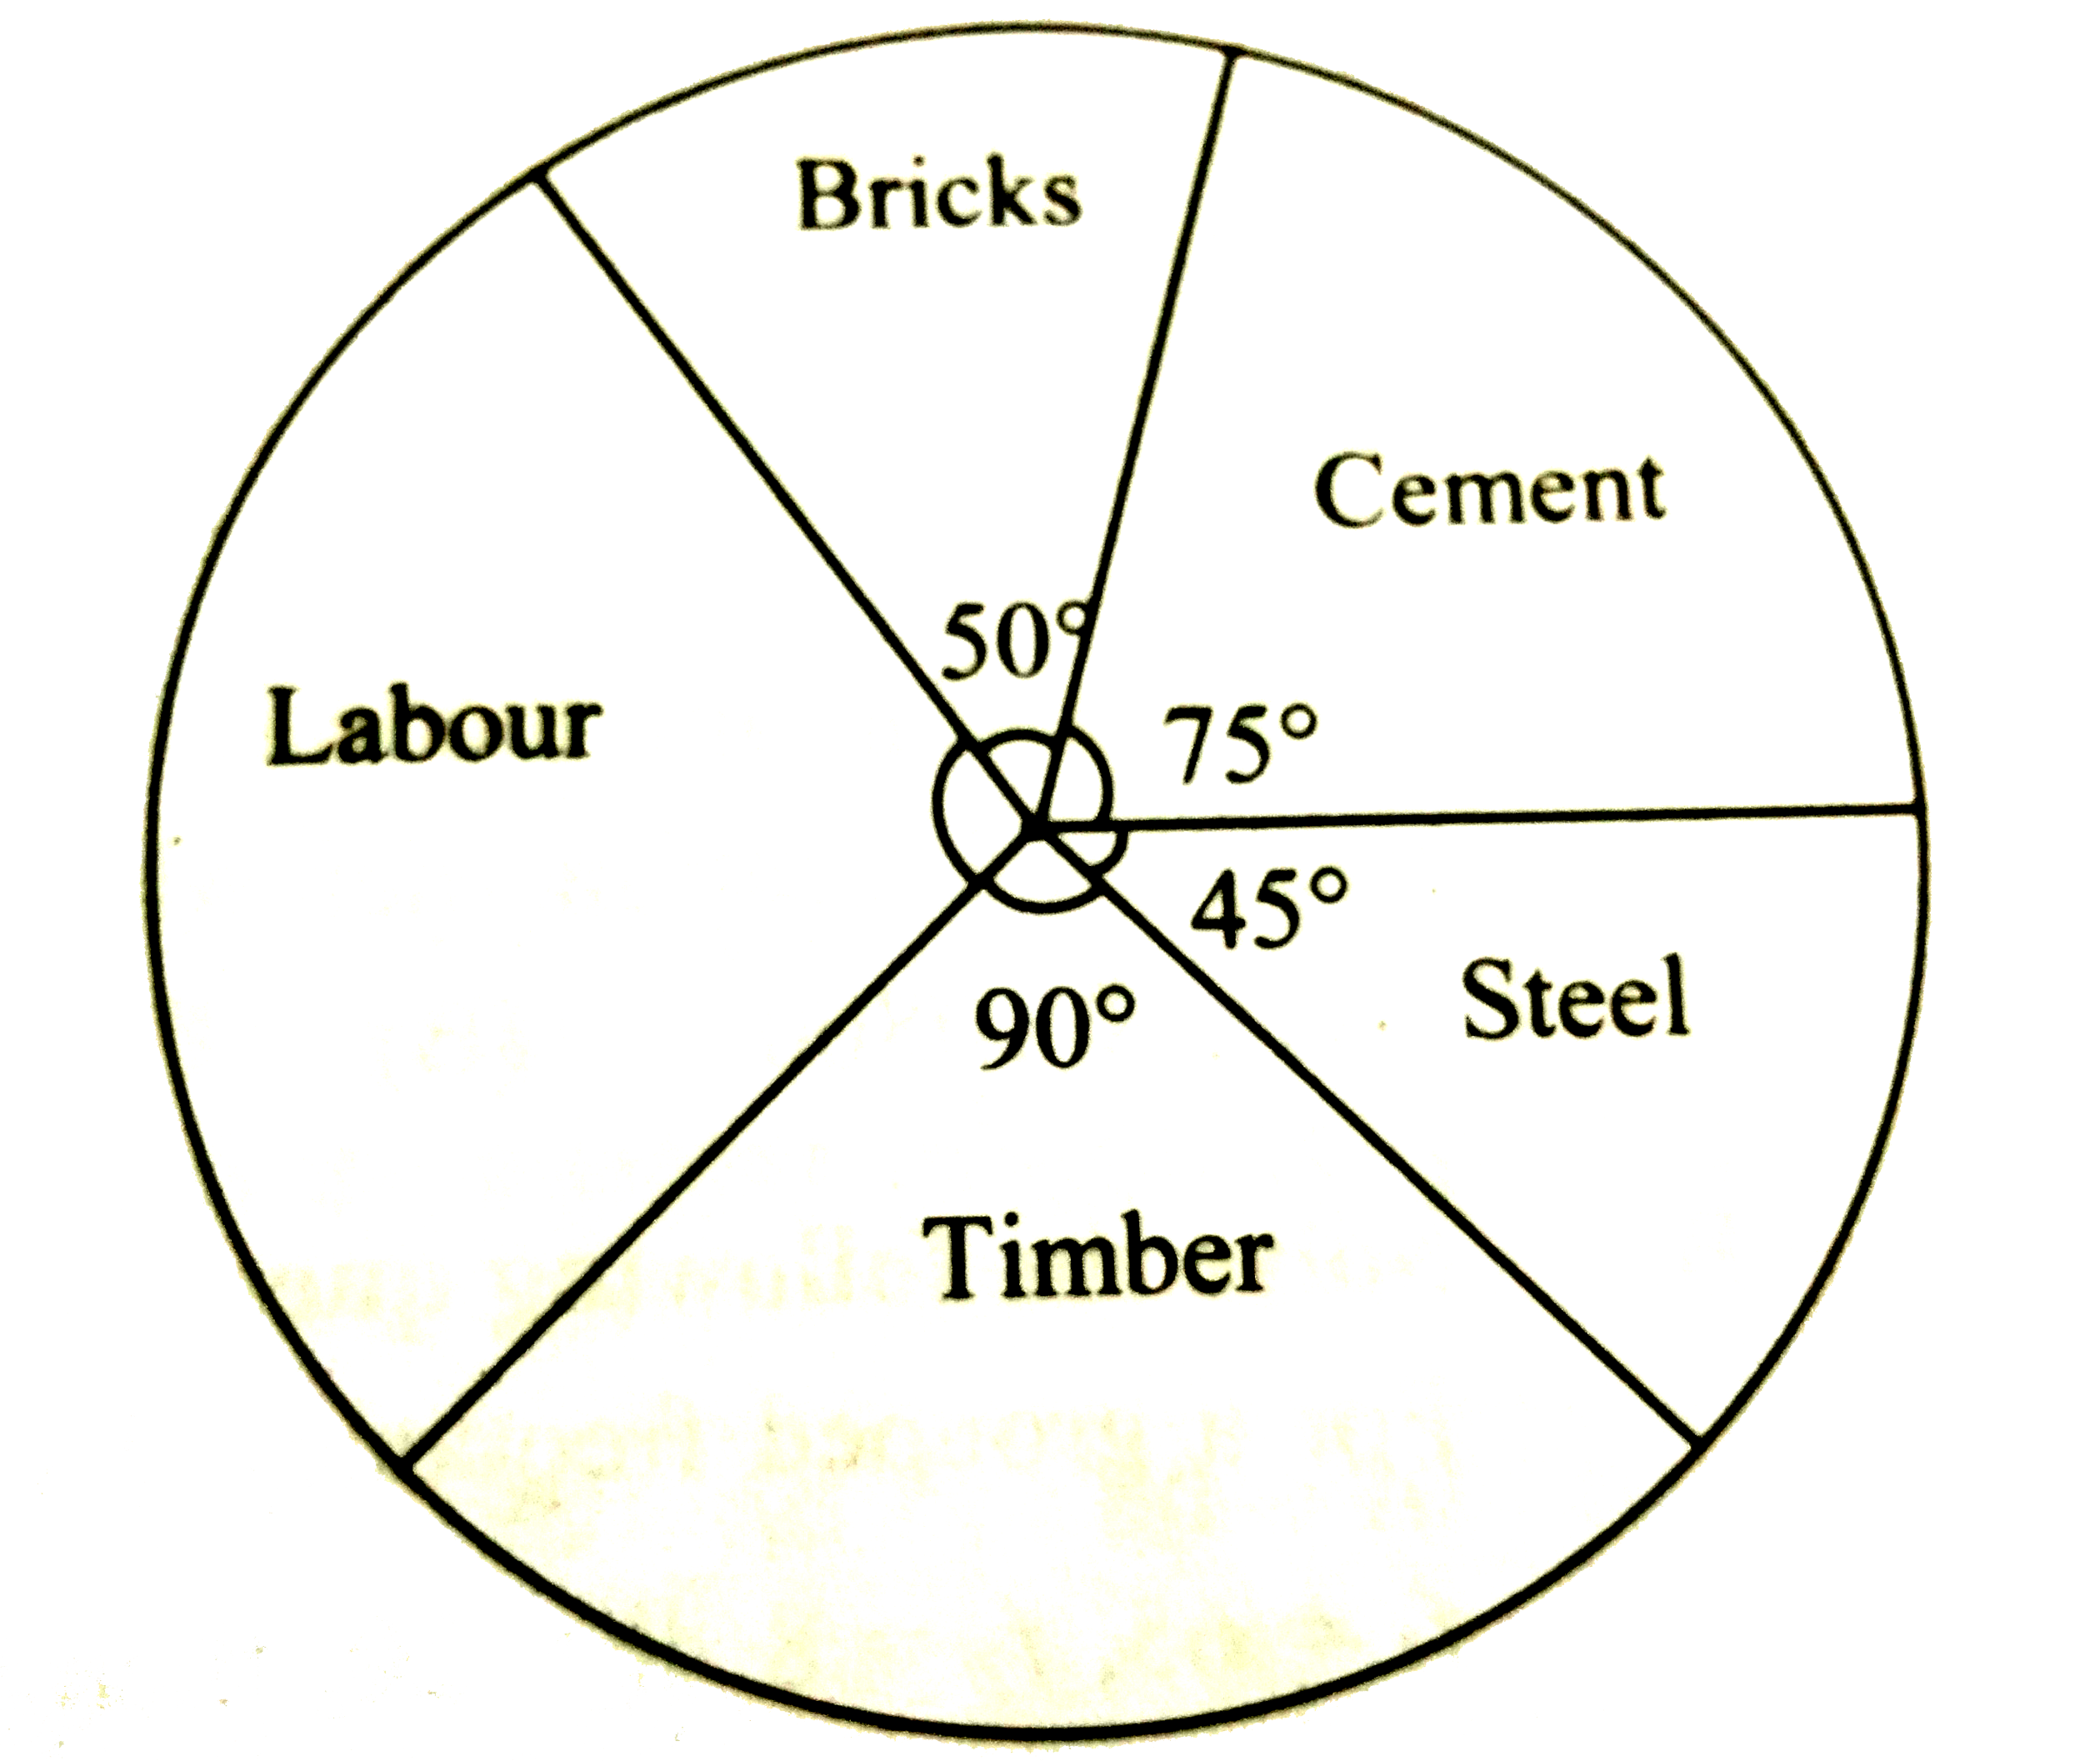
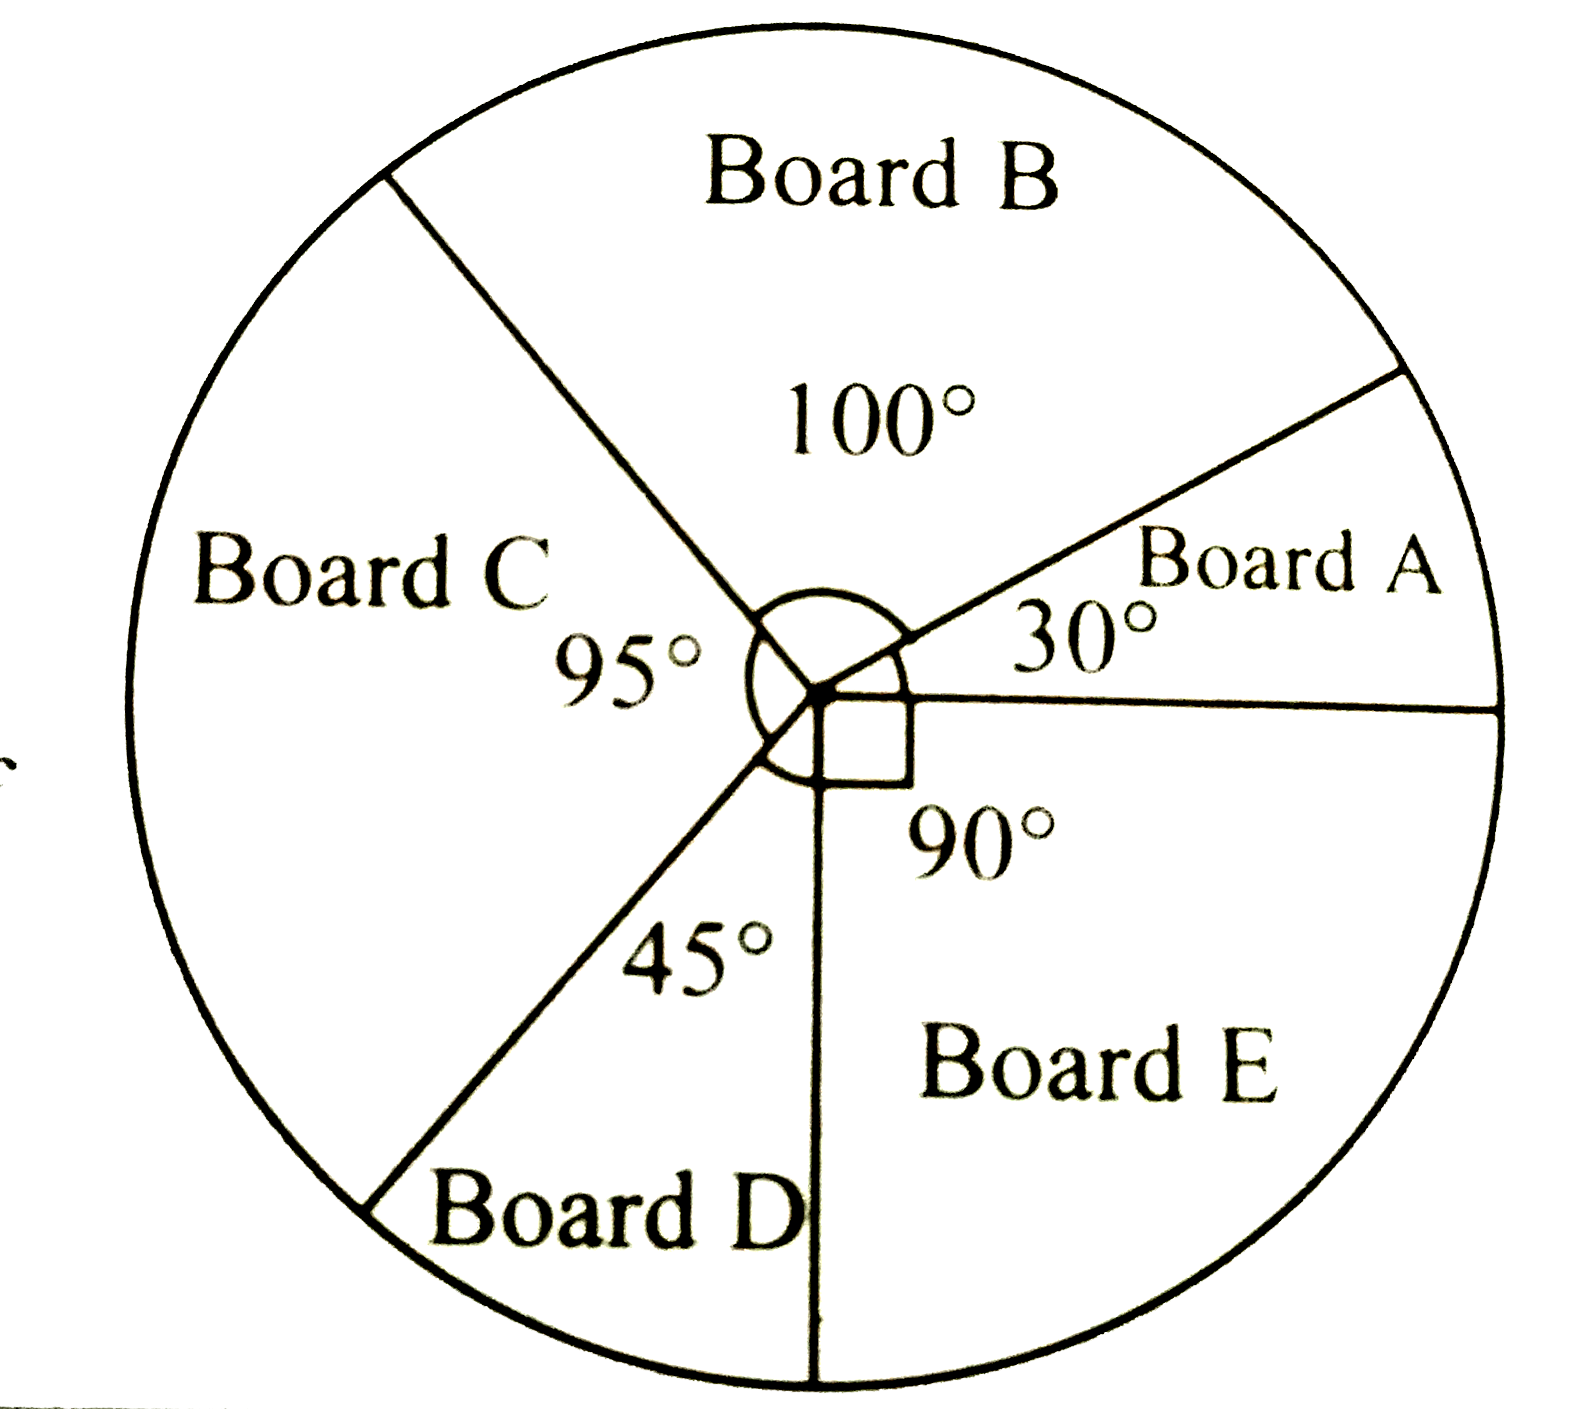
The adjoining pie-diagram shows the S.S.C result of 5 boards. Study the diagram and answer the following questions :
i. How many students have passed in board A if total number of students appeared was 540000?
ii. How many students have passed in board E if the total number of students appeared was 100000 ?
 View Solution
Question 42
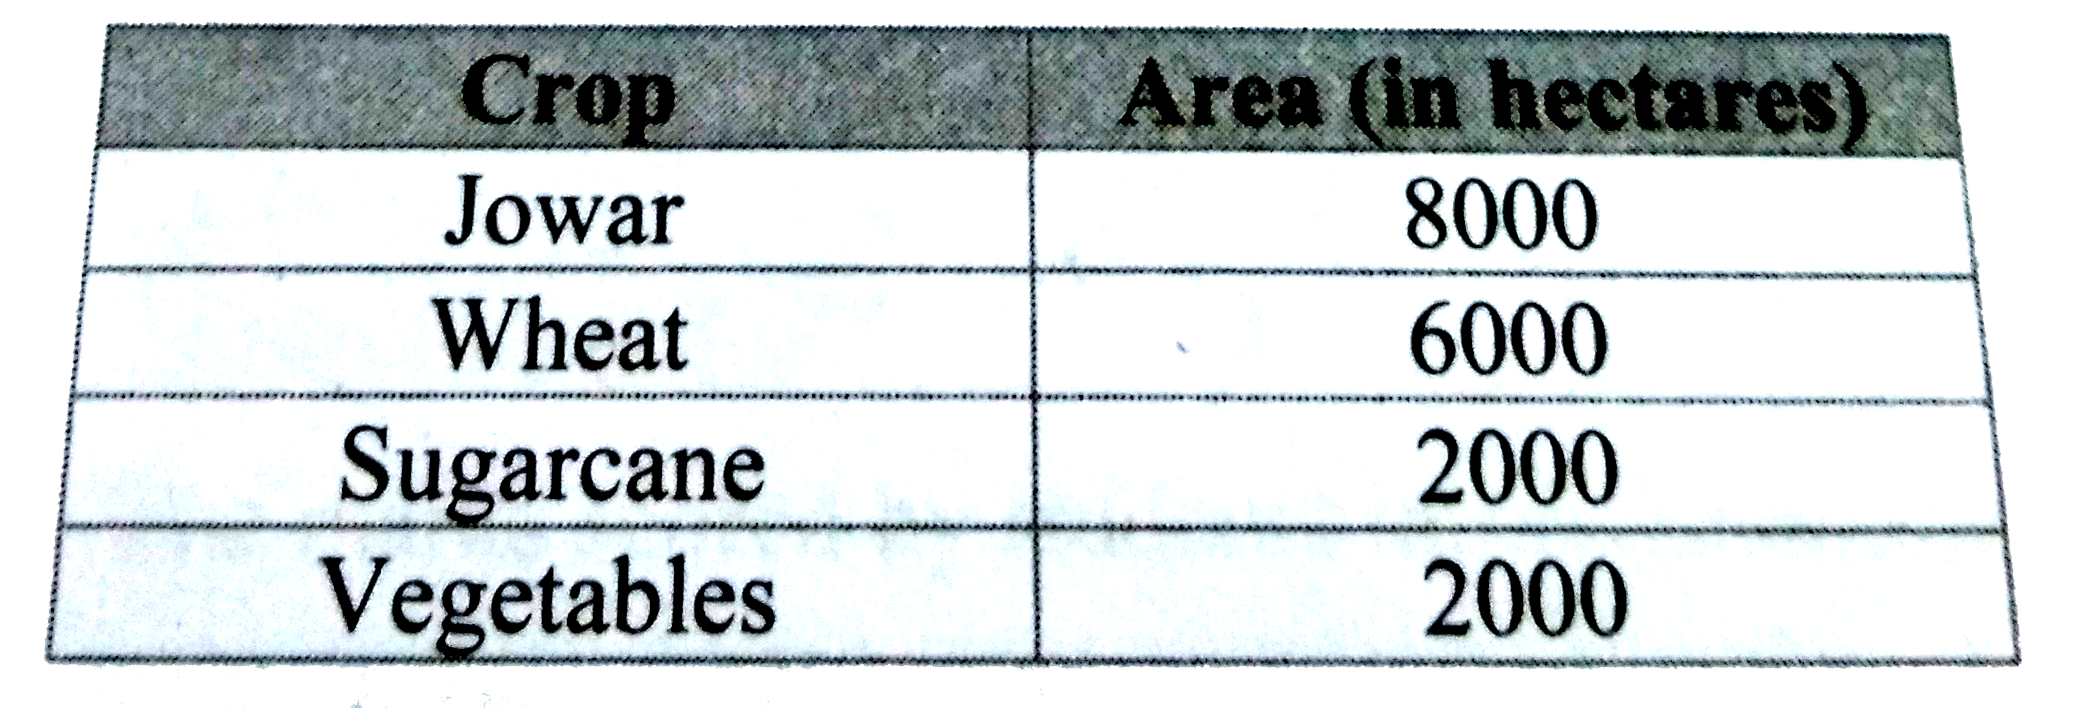
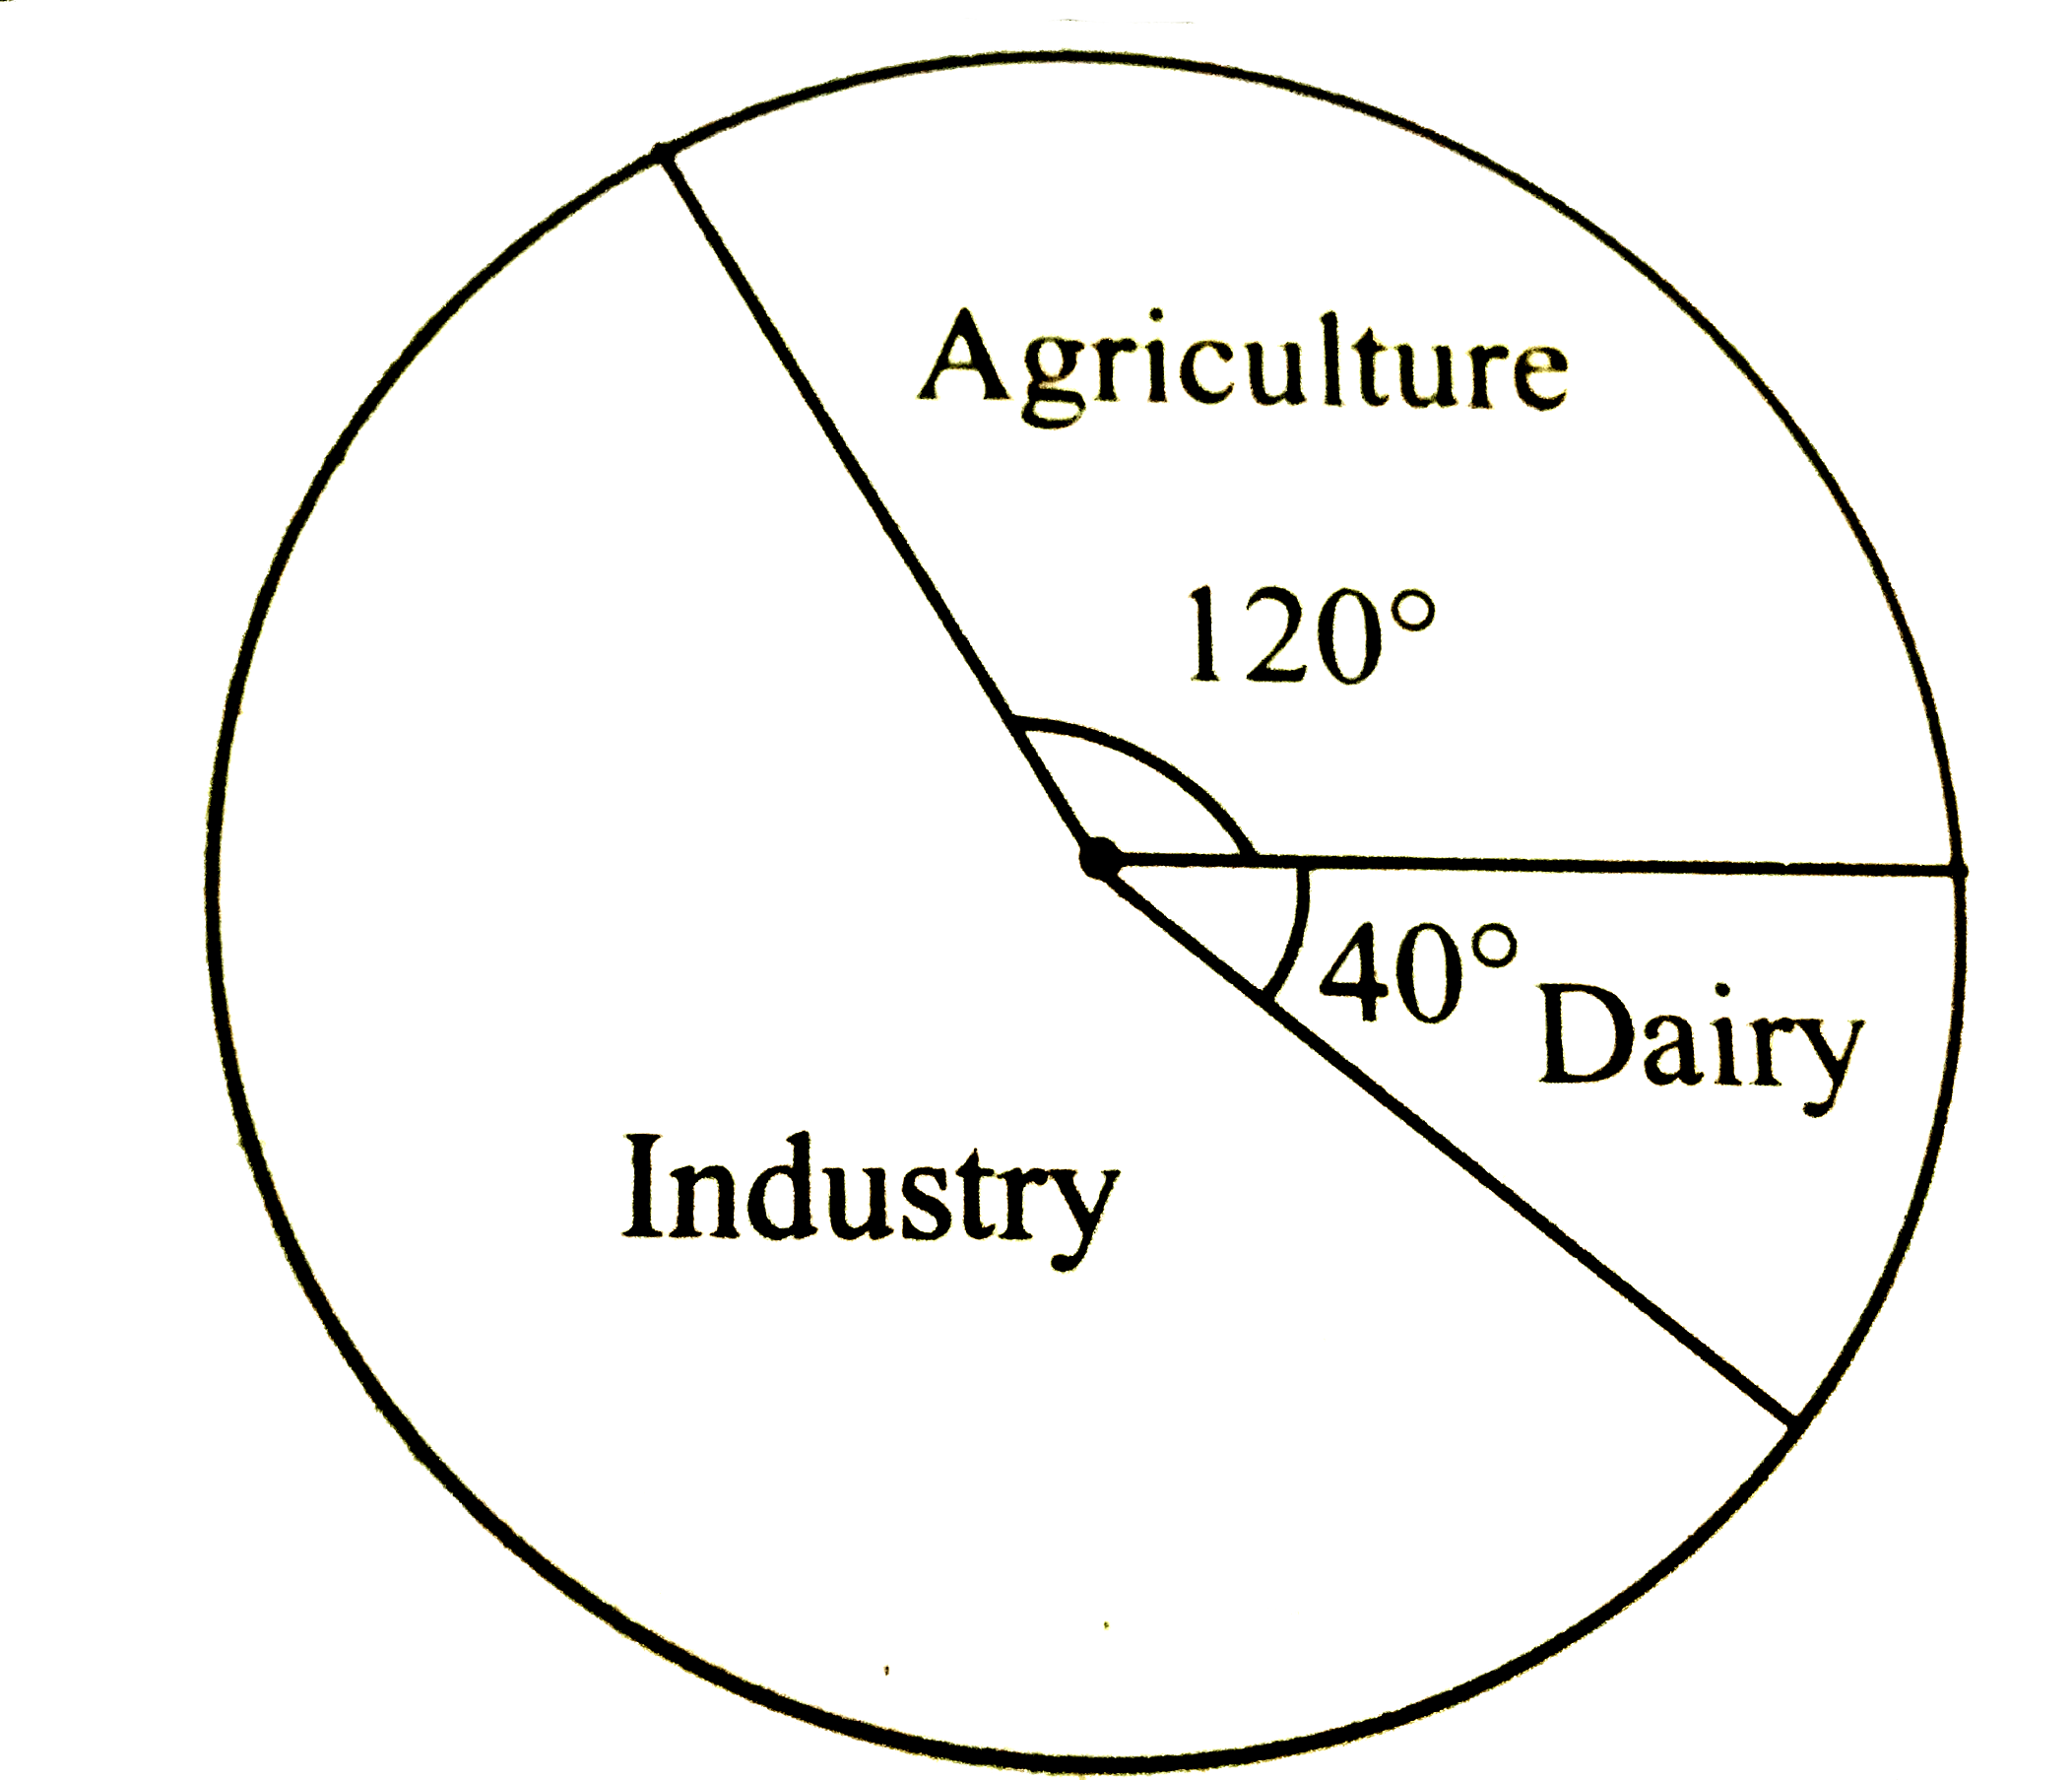
The following pie diagram represents the sectorwise loan amount in crores of rupees distributied by a bank. From the information answer the following questions:
i. If the dairy sector receives Rs20 crores, then find the total loan disbursed.
ii. Find the loan amount for agriculture sector and also for idustrial sector.
iii How much additional amount did industrial sector receive than agriculture sector?
 View Solution
Question 44
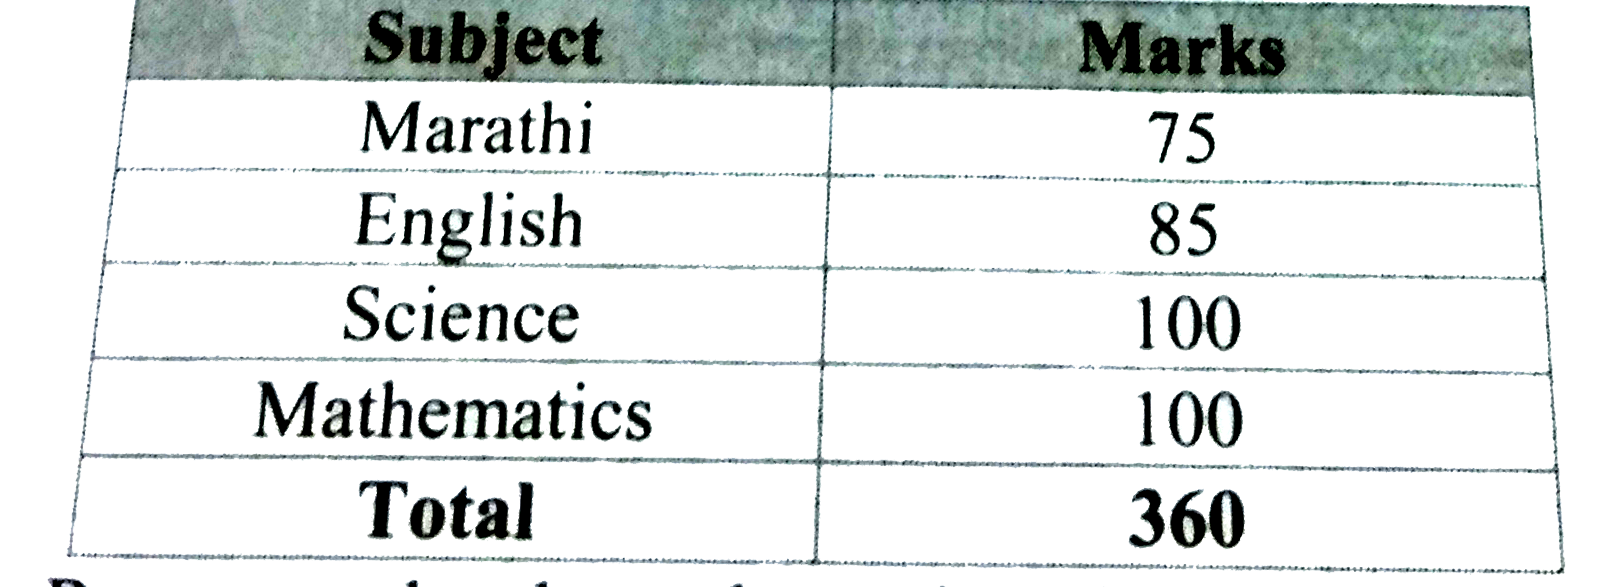
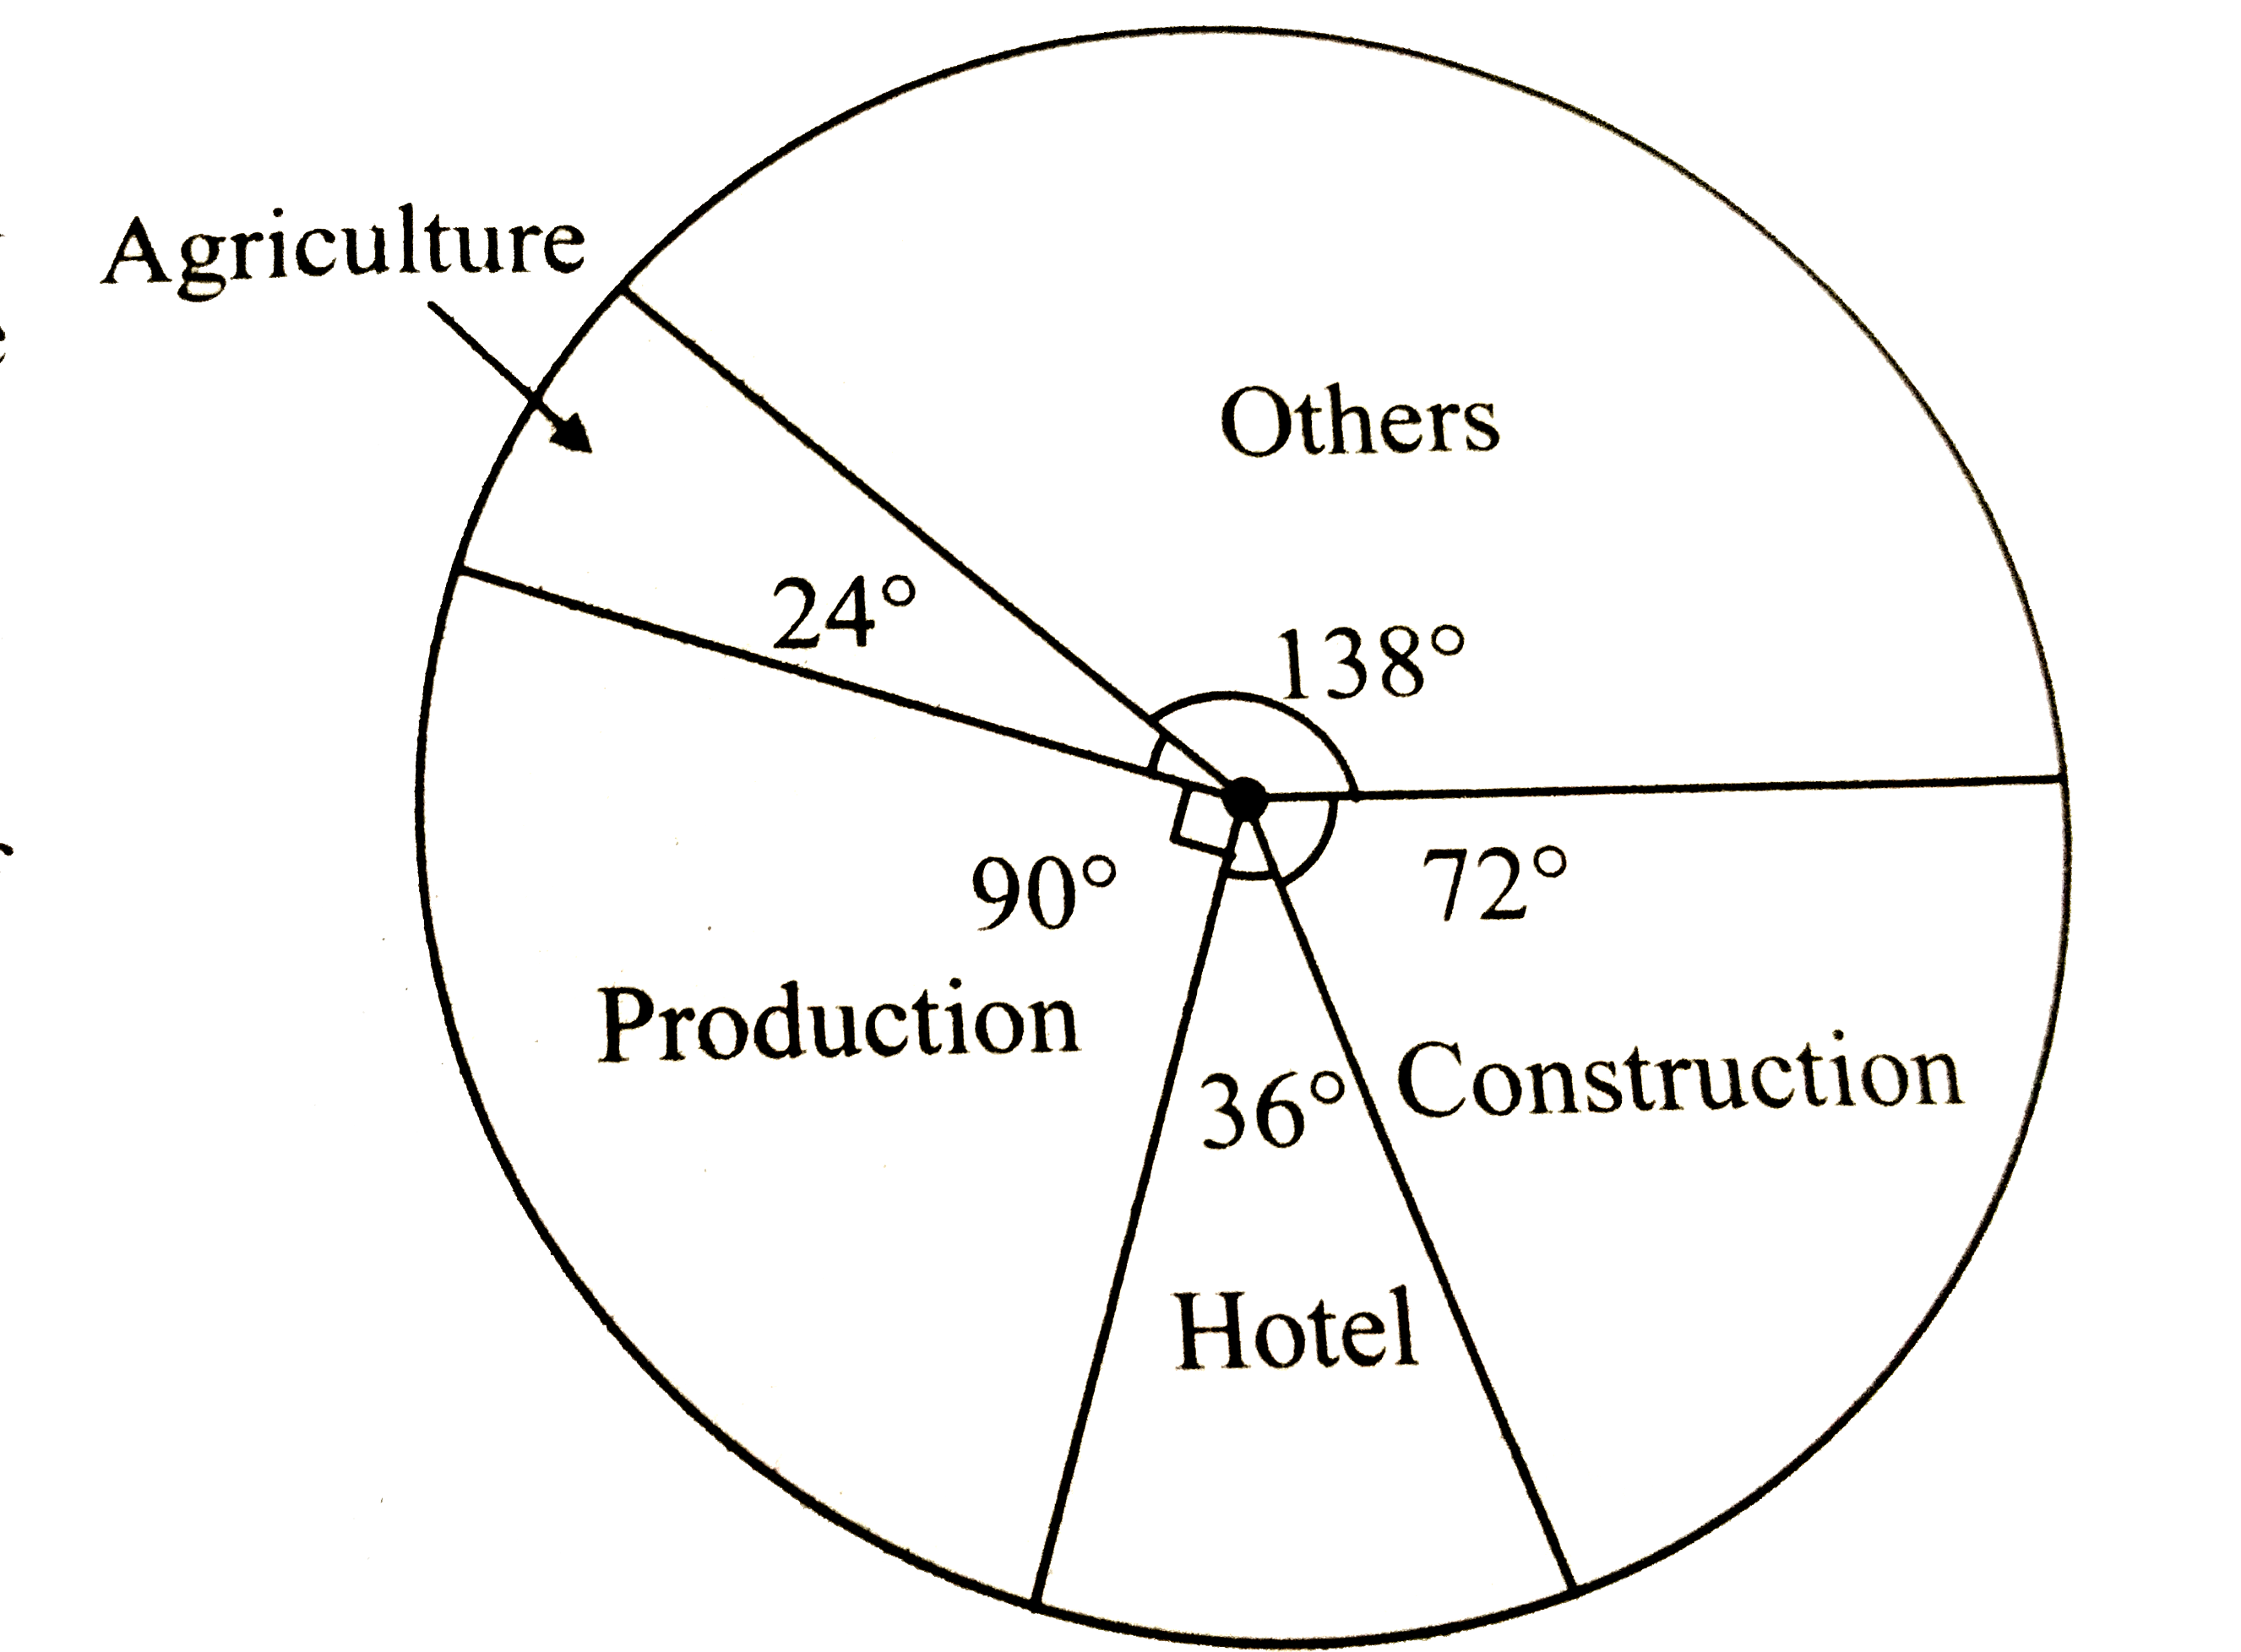
As deduced from a survey, the classification of skilled workers is shown in the pie diagram. If the number of workers in the production sector is 4500, answer the following questions.
i. What is the total number of skilled workers in all fields?
ii. What is the number of skilled workers in the field of constructions ?
iii. How many skilled workers are in agriculture?
iv. Find the difference between the number of workers in the field of production and construction.
 View Solution
All Exercises from TARGET MATHS (HINGLISH) Class 10 MATHS STATISTICS
- TRY THIS
- TRY THIS
- TRY THIS
- TRY THIS
- MULTIPLE CHOICE QUESTIONS
- MULTIPLE CHOICE QUESTIONS
- MULTIPLE CHOICE QUESTIONS
- MULTIPLE CHOICE QUESTIONS
- ADDITIONAL PROBLEMS FOR PRACTICE
- ADDITIONAL PROBLEMS FOR PRACTICE
- ADDITIONAL PROBLEMS FOR PRACTICE
- ADDITIONAL PROBLEMS FOR PRACTICE
- APPLY YOUR KNOWLEDGE
- APPLY YOUR KNOWLEDGE
- APPLY YOUR KNOWLEDGE
- APPLY YOUR KNOWLEDGE
- CHAPTER ASSESSMENT
- CHAPTER ASSESSMENT
- CHAPTER ASSESSMENT
- CHAPTER ASSESSMENT
- PRACTISE SET 6.1
- PRACTISE SET 6.1
- PRACTISE SET 6.1
- PRACTISE SET 6.1
- PRACTISE SET 6.2
- PRACTISE SET 6.2
- PRACTISE SET 6.2
- PRACTISE SET 6.2
- PRACTISE SET 6.3
- PRACTISE SET 6.3
- PRACTISE SET 6.3
- PRACTISE SET 6.3
- PRACTISE SET 6.4
- PRACTISE SET 6.4
- PRACTISE SET 6.4
- PRACTISE SET 6.4
- PRACTISE SET 6.5
- PRACTISE SET 6.5
- PRACTISE SET 6.5
- PRACTISE SET 6.5
- PRACTISE SET 6.6
- PRACTISE SET 6.6
- PRACTISE SET 6.6
- PRACTISE SET 6.6
- PROBLEM SET-6
- PROBLEM SET-6
- PROBLEM SET-6
- PROBLEM SET-6
- EXAMPLE
- EXAMPLE
- EXAMPLE
- EXAMPLE


