EXAMPLE from RS AGGARWAL MATHS (HINGLISH) BAR GRAPH, HISTOGRAM AND FREQUENCY POLYGON for Class 9
| Class 9 | MATHS |
| Chapter | BAR GRAPH, HISTOGRAM AND FREQUENCY POLYGON |
| RS AGGARWAL MATHS (HINGLISH) | EXAMPLE |
| Medium | English |
| Academic Year | 2023-2024 |
Question 6
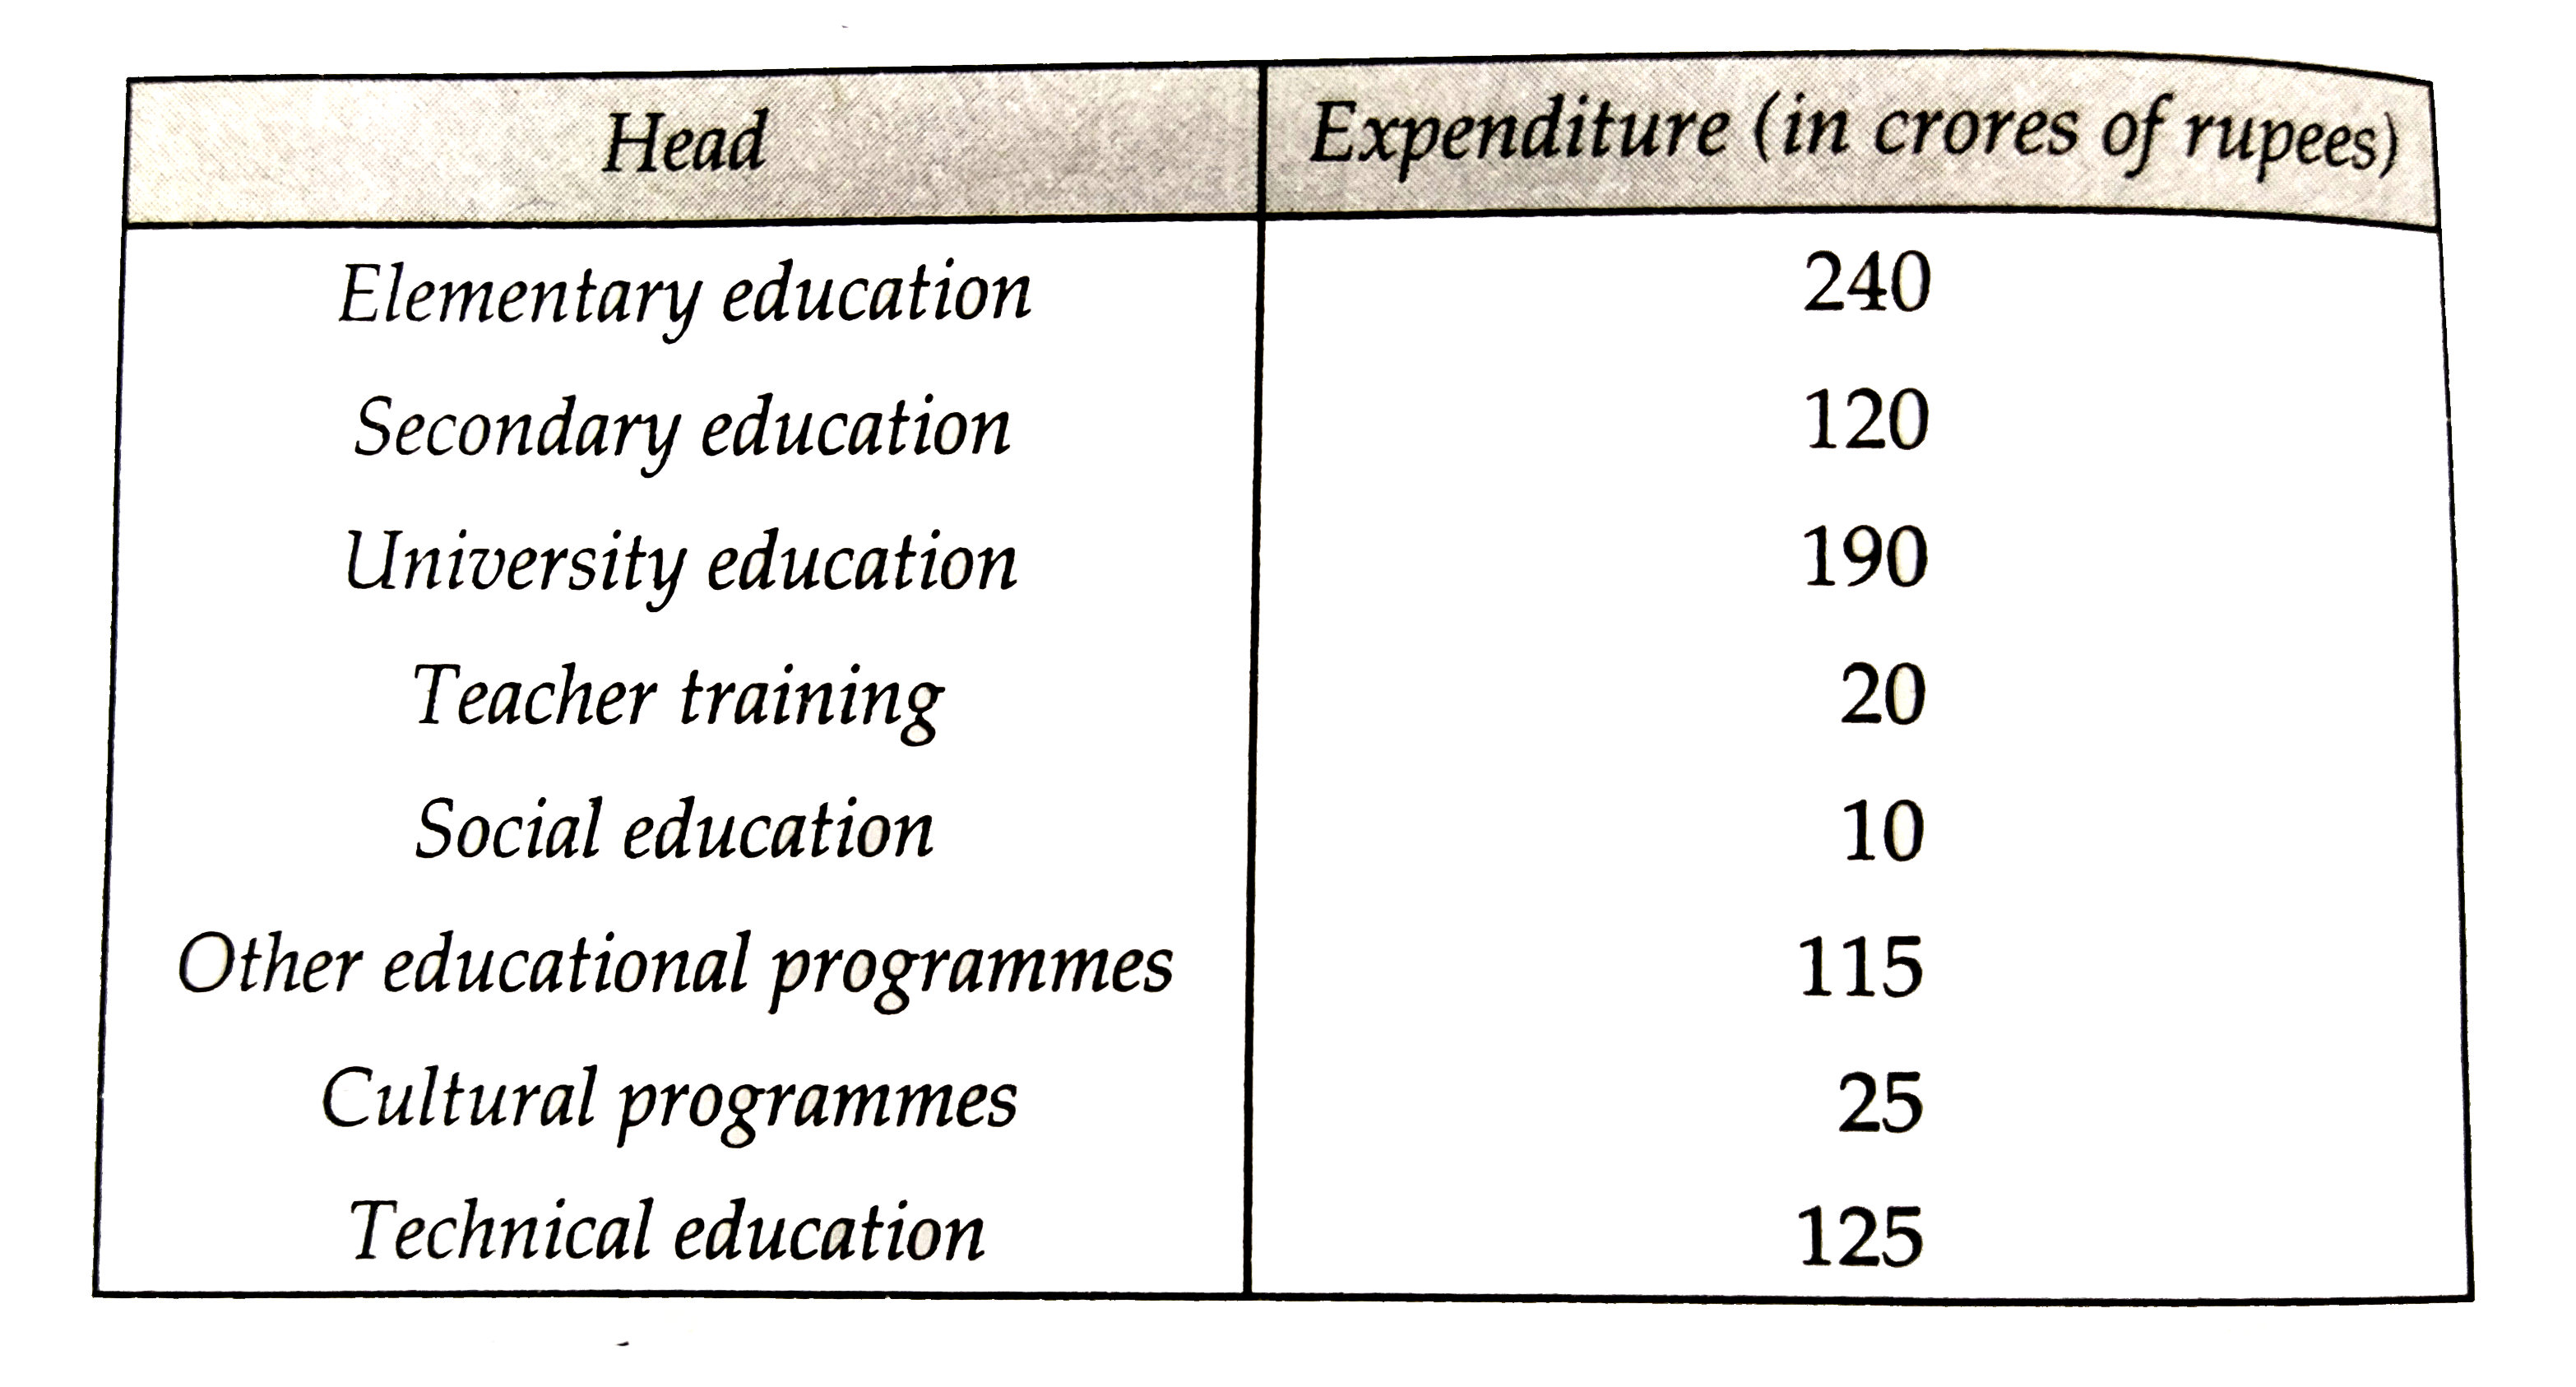
A survey conducted by an organisation for the cause of illness and death among the women between the ages 15−44 (in years) worldwide, found the following figure (in%):
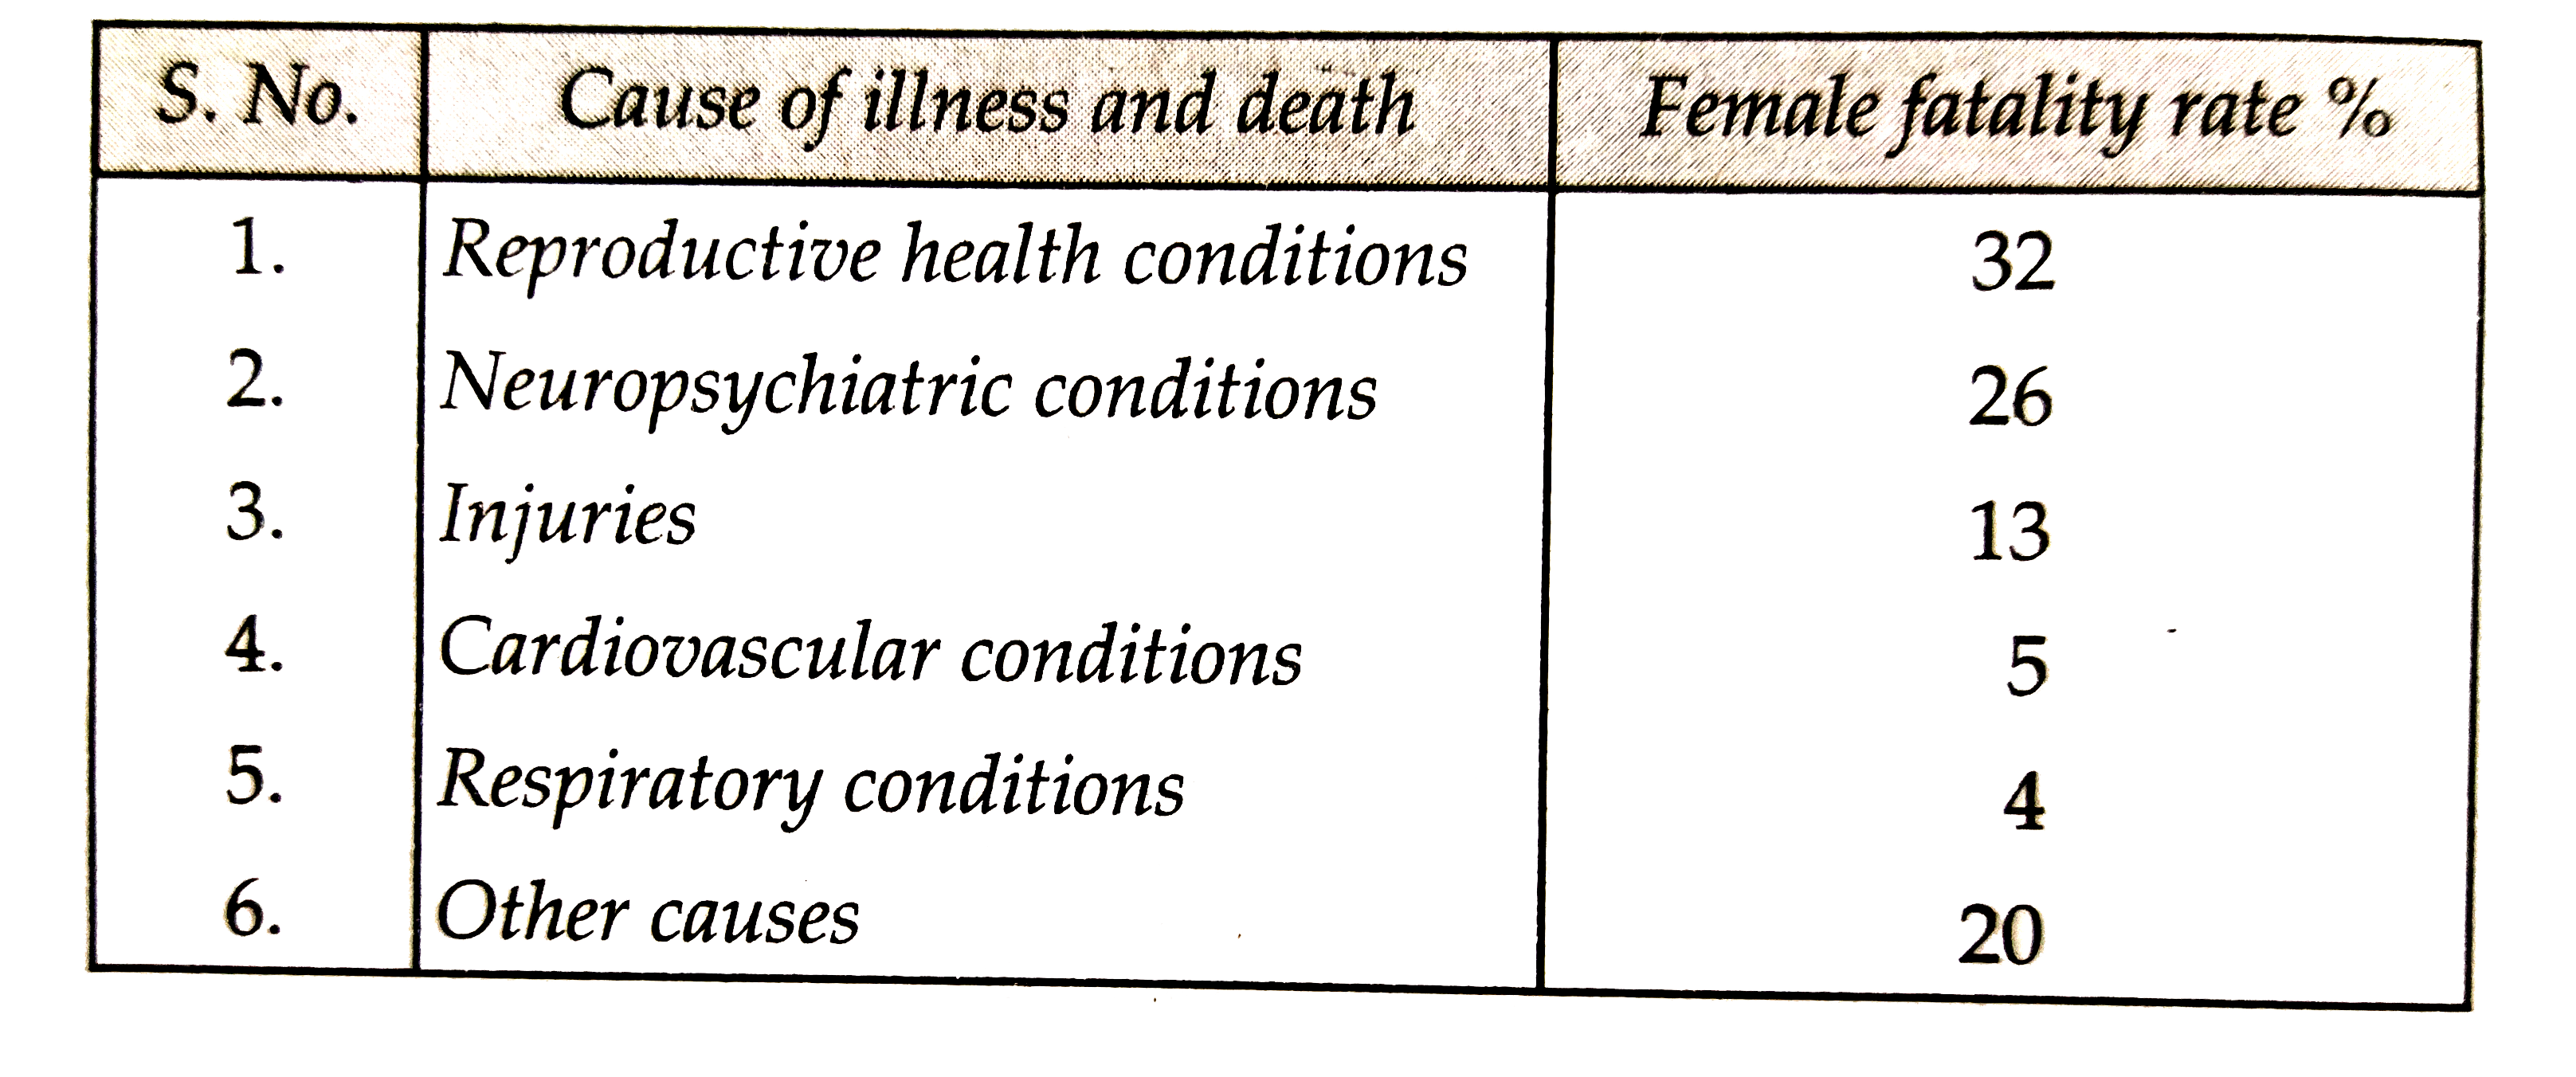
(i) Represent the information given above graphically.
(ii) Which condition is the major cause of women's ill health and death worldwide?View SolutionQuestion 8
Given below is a bar graph showing the heights of six mountain peaks.
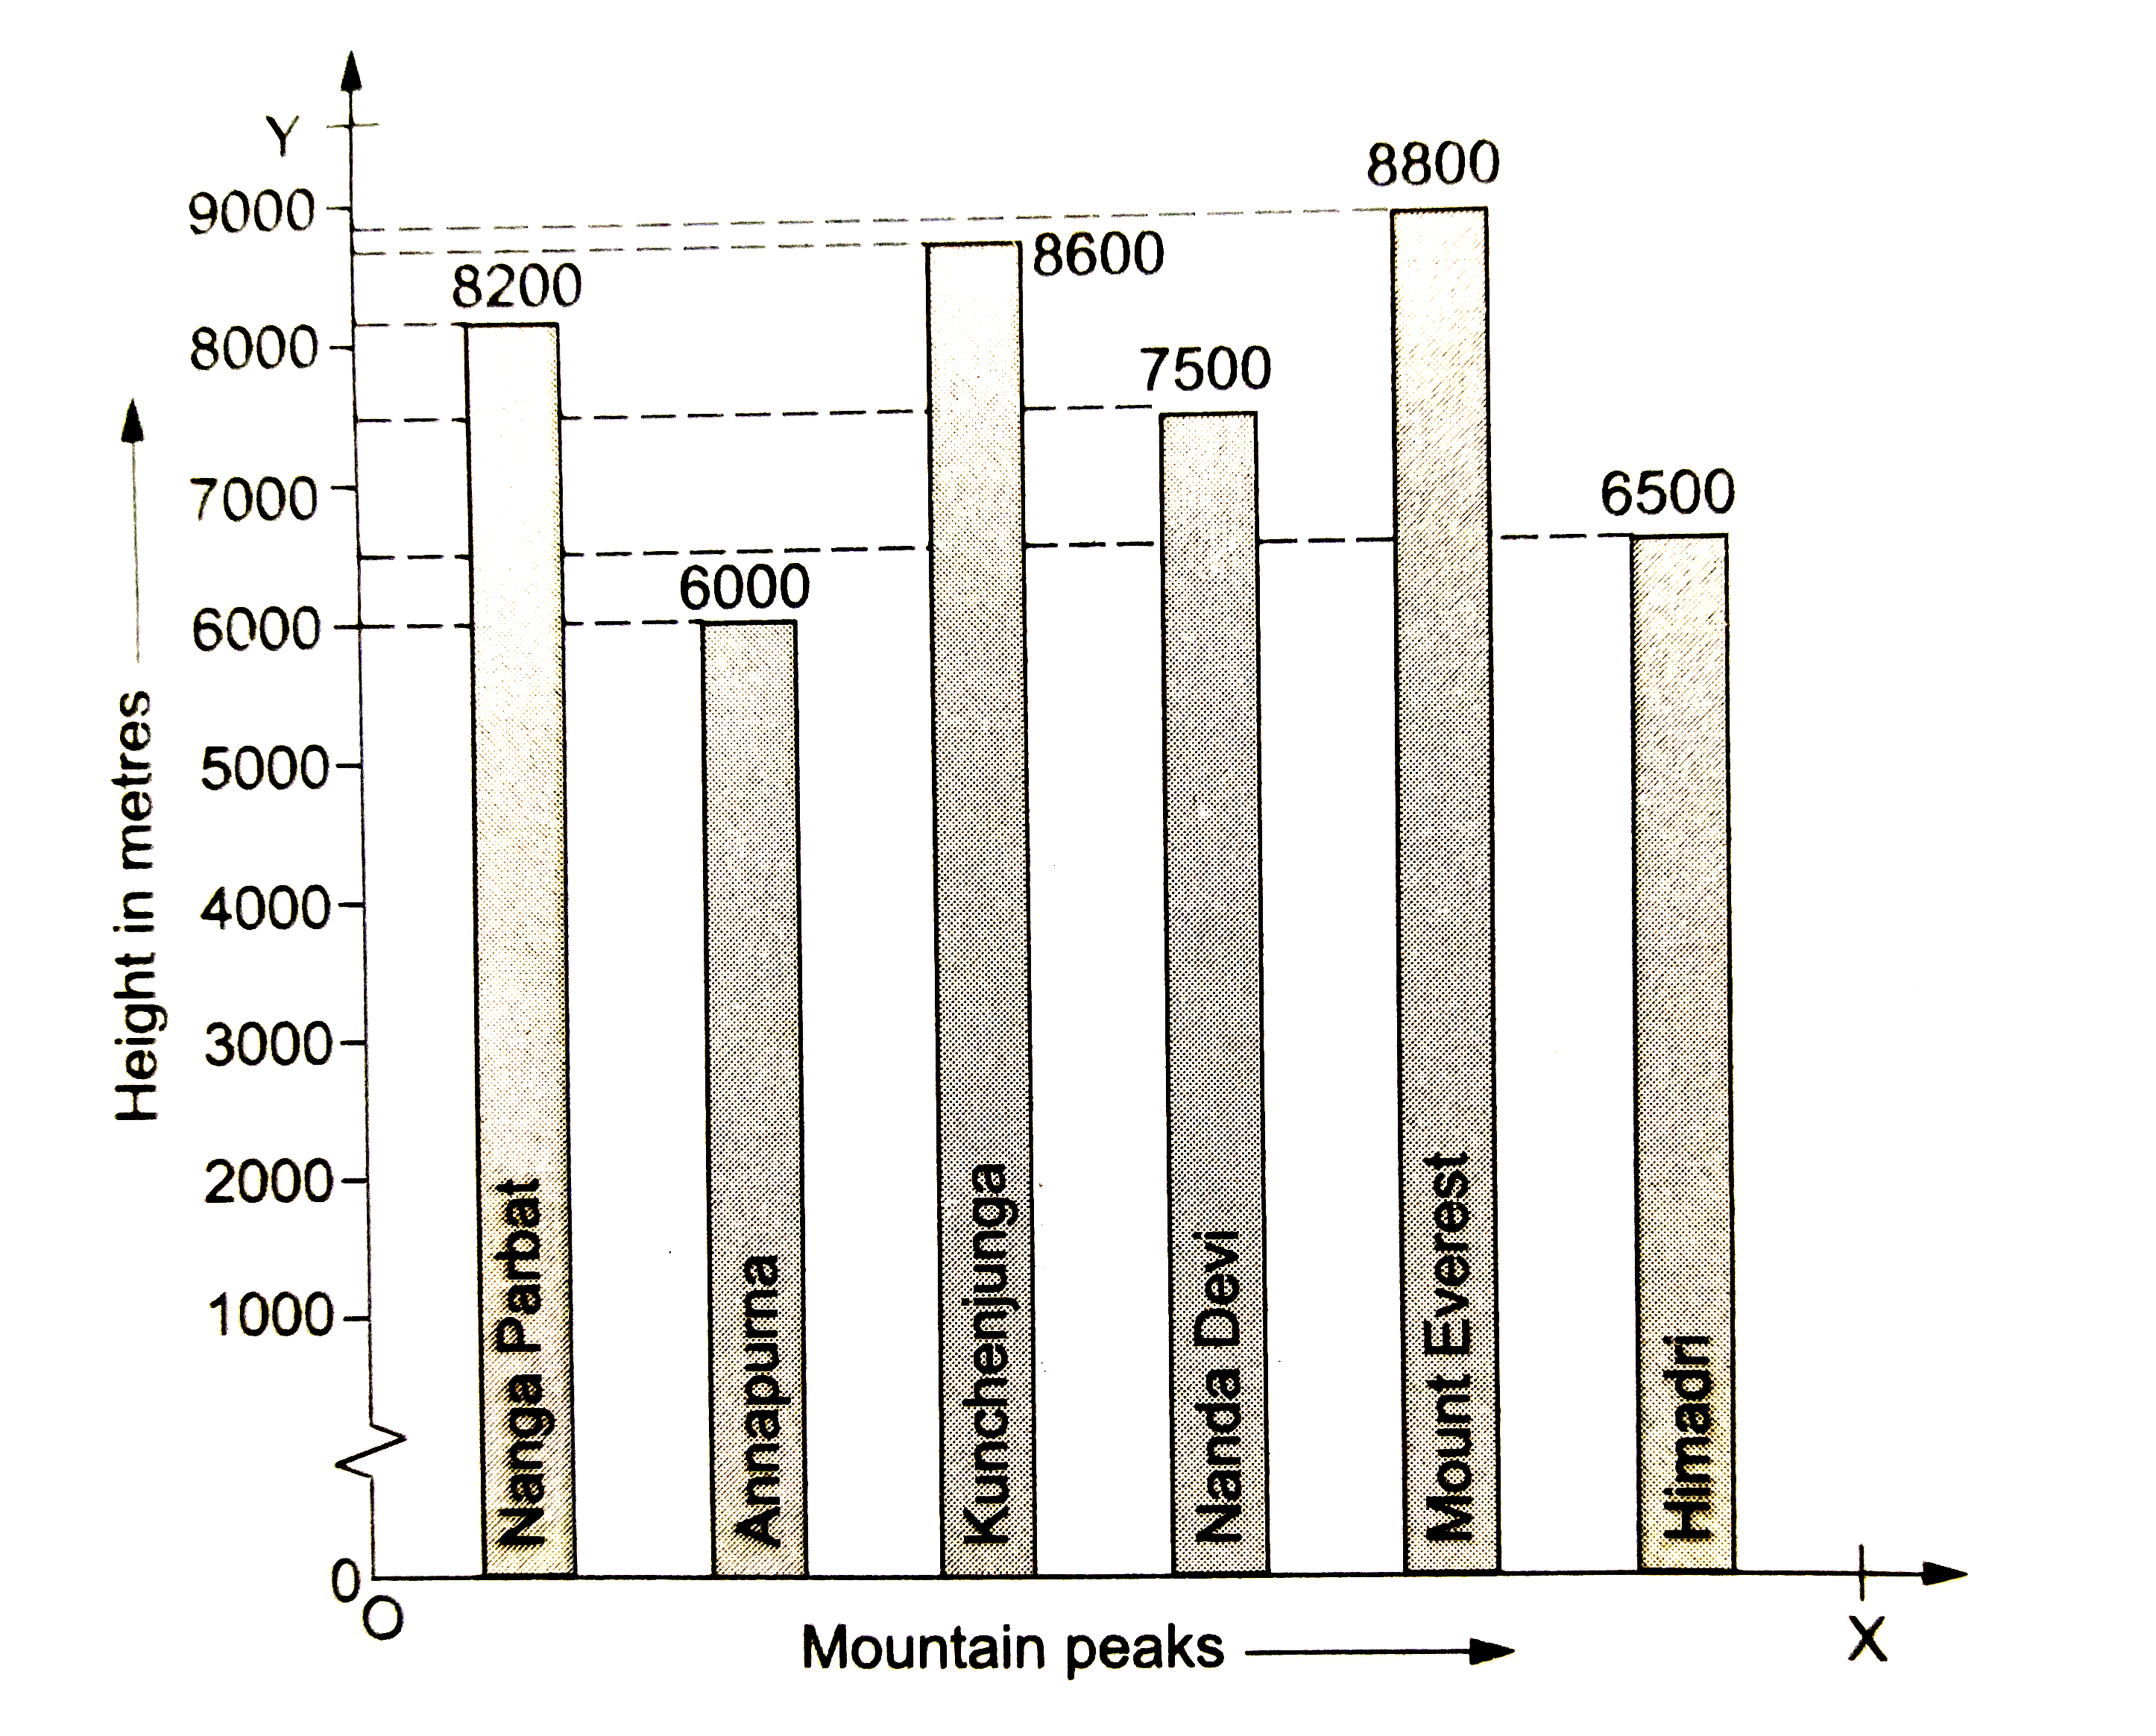
Read the above diagram and answer the following questions:
(i) Which is the highest peak and what is its height?
(ii) Write down the ratio of the heights of the highest peak and the lowest peak.
(iii) Write the heights of the given peaks in ascending order.
(iv) Which peak is the second highest and what is its height?View SolutionQuestion 9
In a survey of 85 families of a colony, the number of members each family was recorded and the data has been represented by the following bar graph:
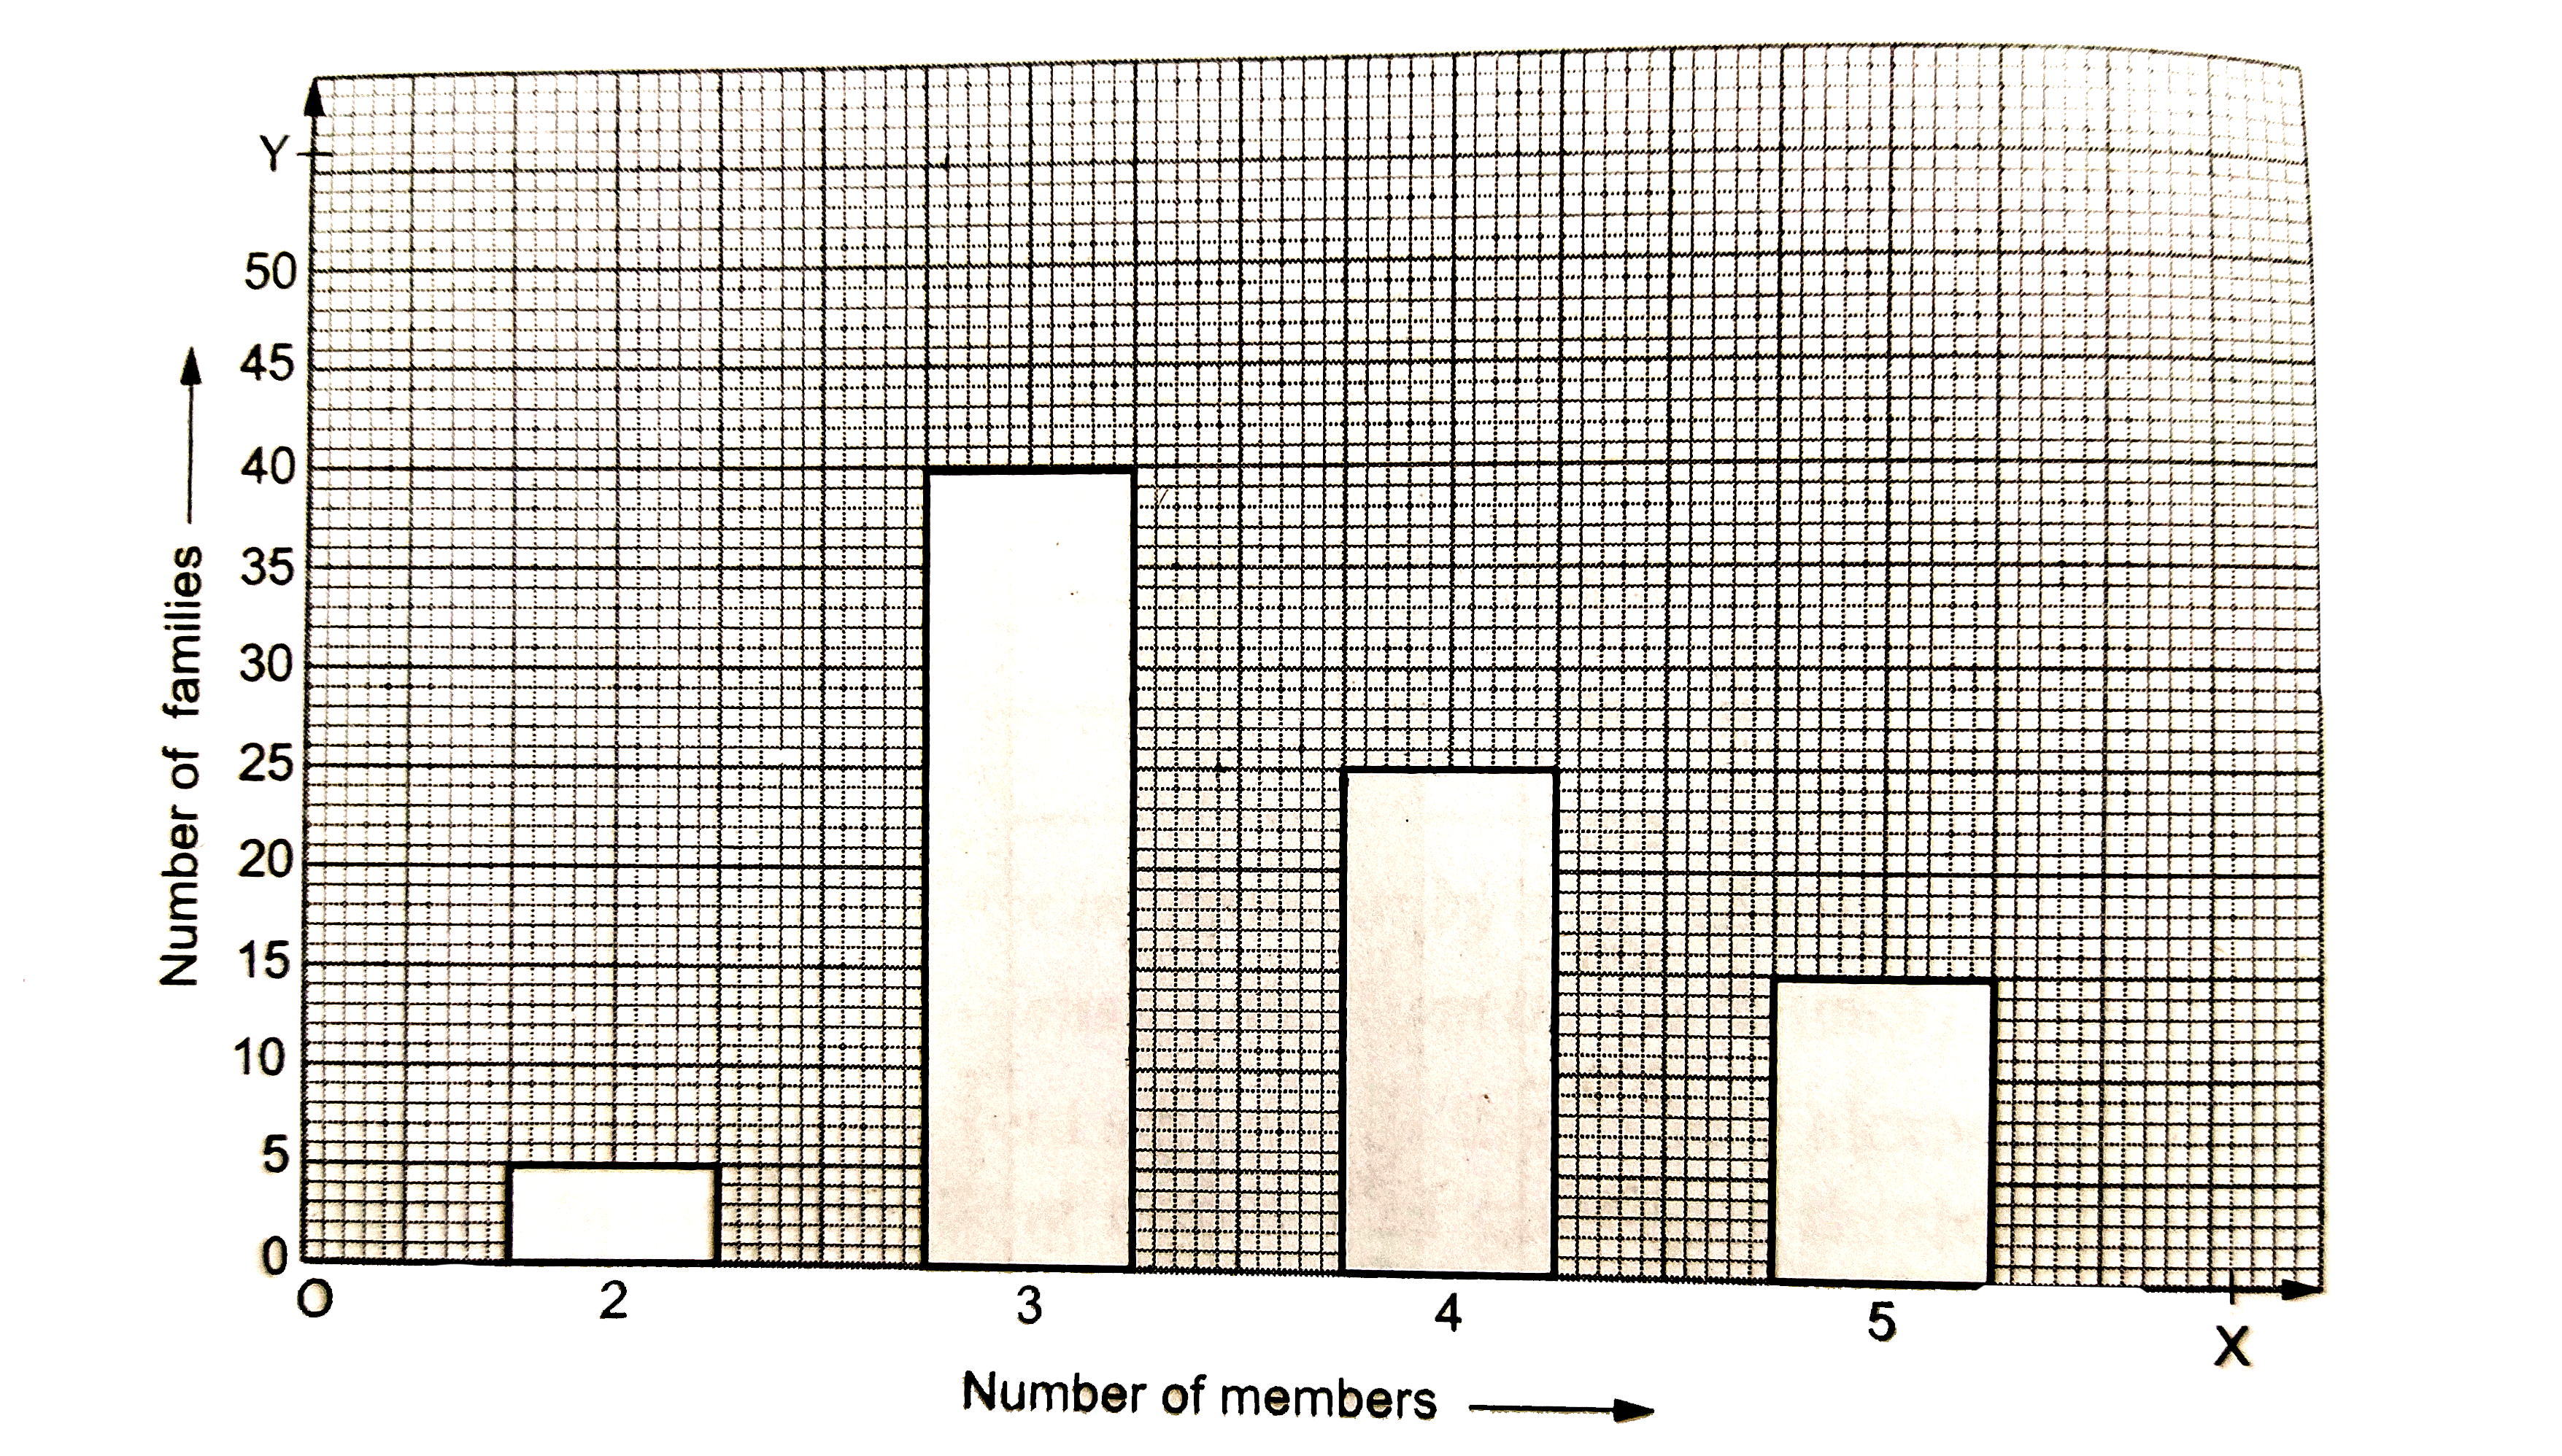
Read the bar graph carefully and answer the following questions:
(i) What information does the bar graph give?
(ii) How many families have 3 members?
(iii) How many people live alone?
(iv) Which type of family is the most common? How many members are there in each family of this kind?View SolutionQuestion 10
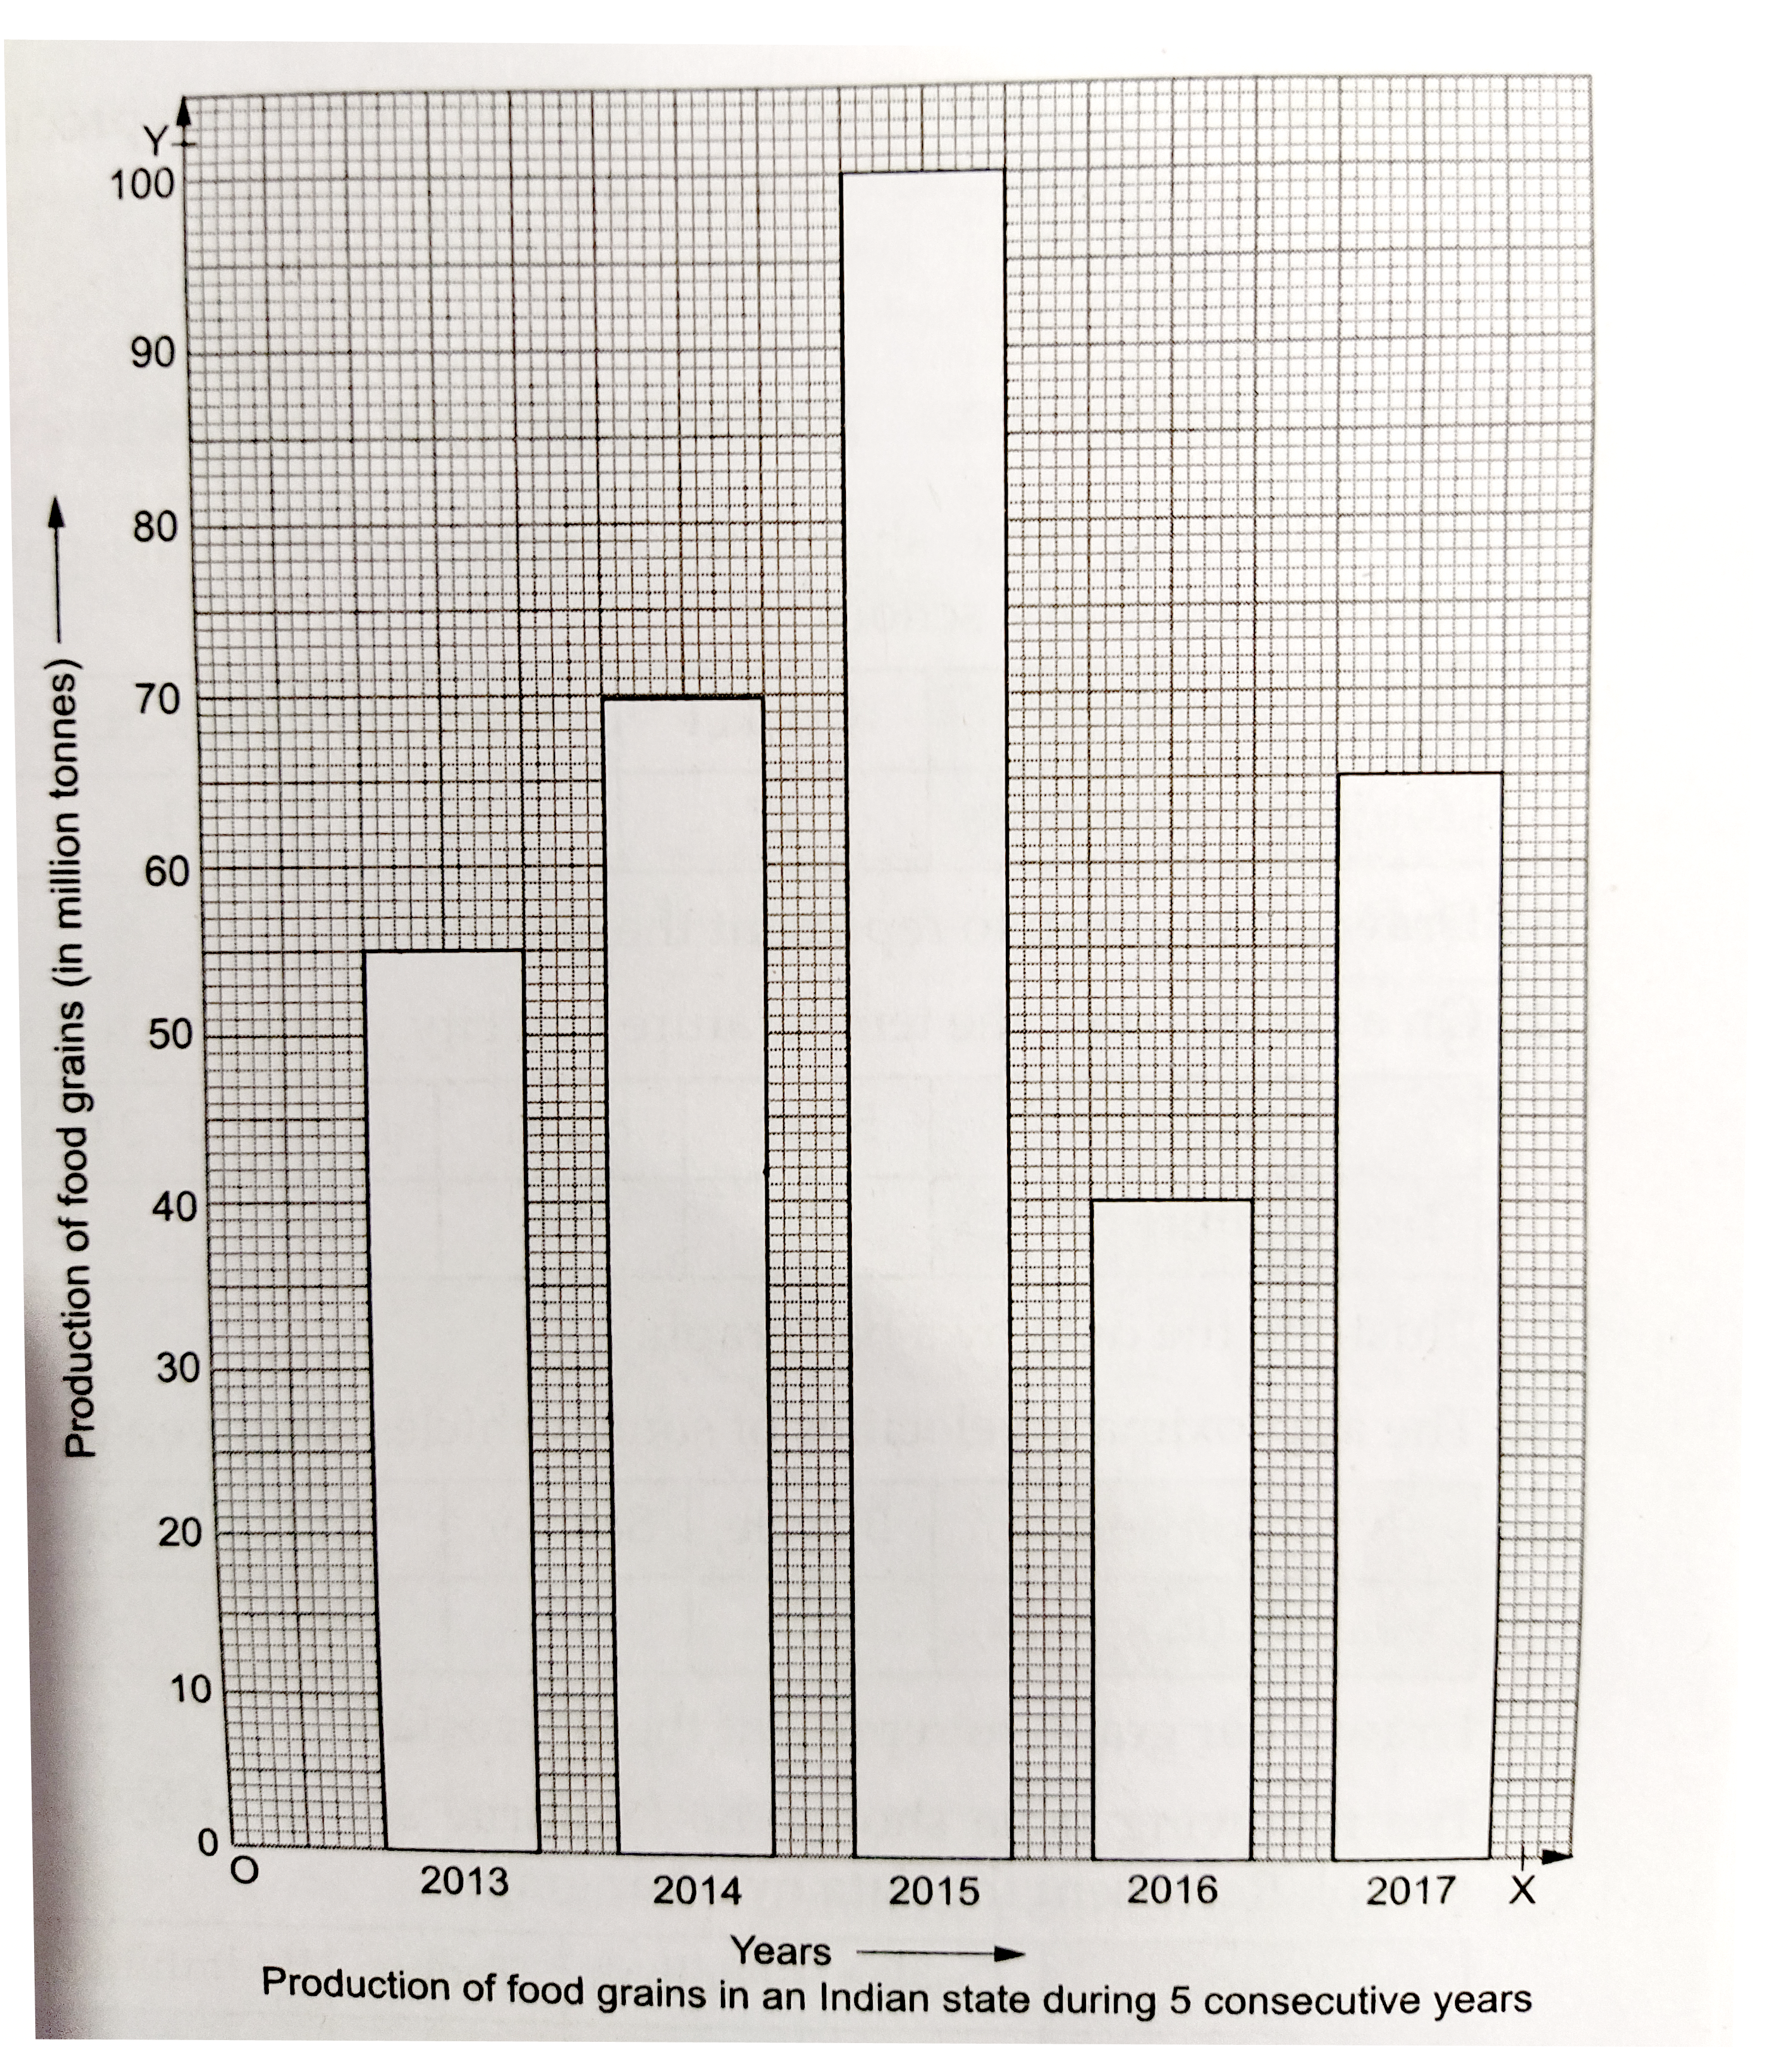
Read the given bar graph and answer the questions given below:
(i) What information is given by the bar graph?
(ii) In which year was the production maximum?
(iii) After which year was there a sudden fall in the production?
(iv) Find the ratio between the maximum production and the minimum production during the given period.
 View Solution


