Read the given bar graph and answer the questions given below:
(i) What information is given by the bar graph?
(ii) In which year was the production maximum?
(iii) After which year was there a sudden fall in the production?
(iv) Find the ratio between the maximum production and the minimum production during the given period.
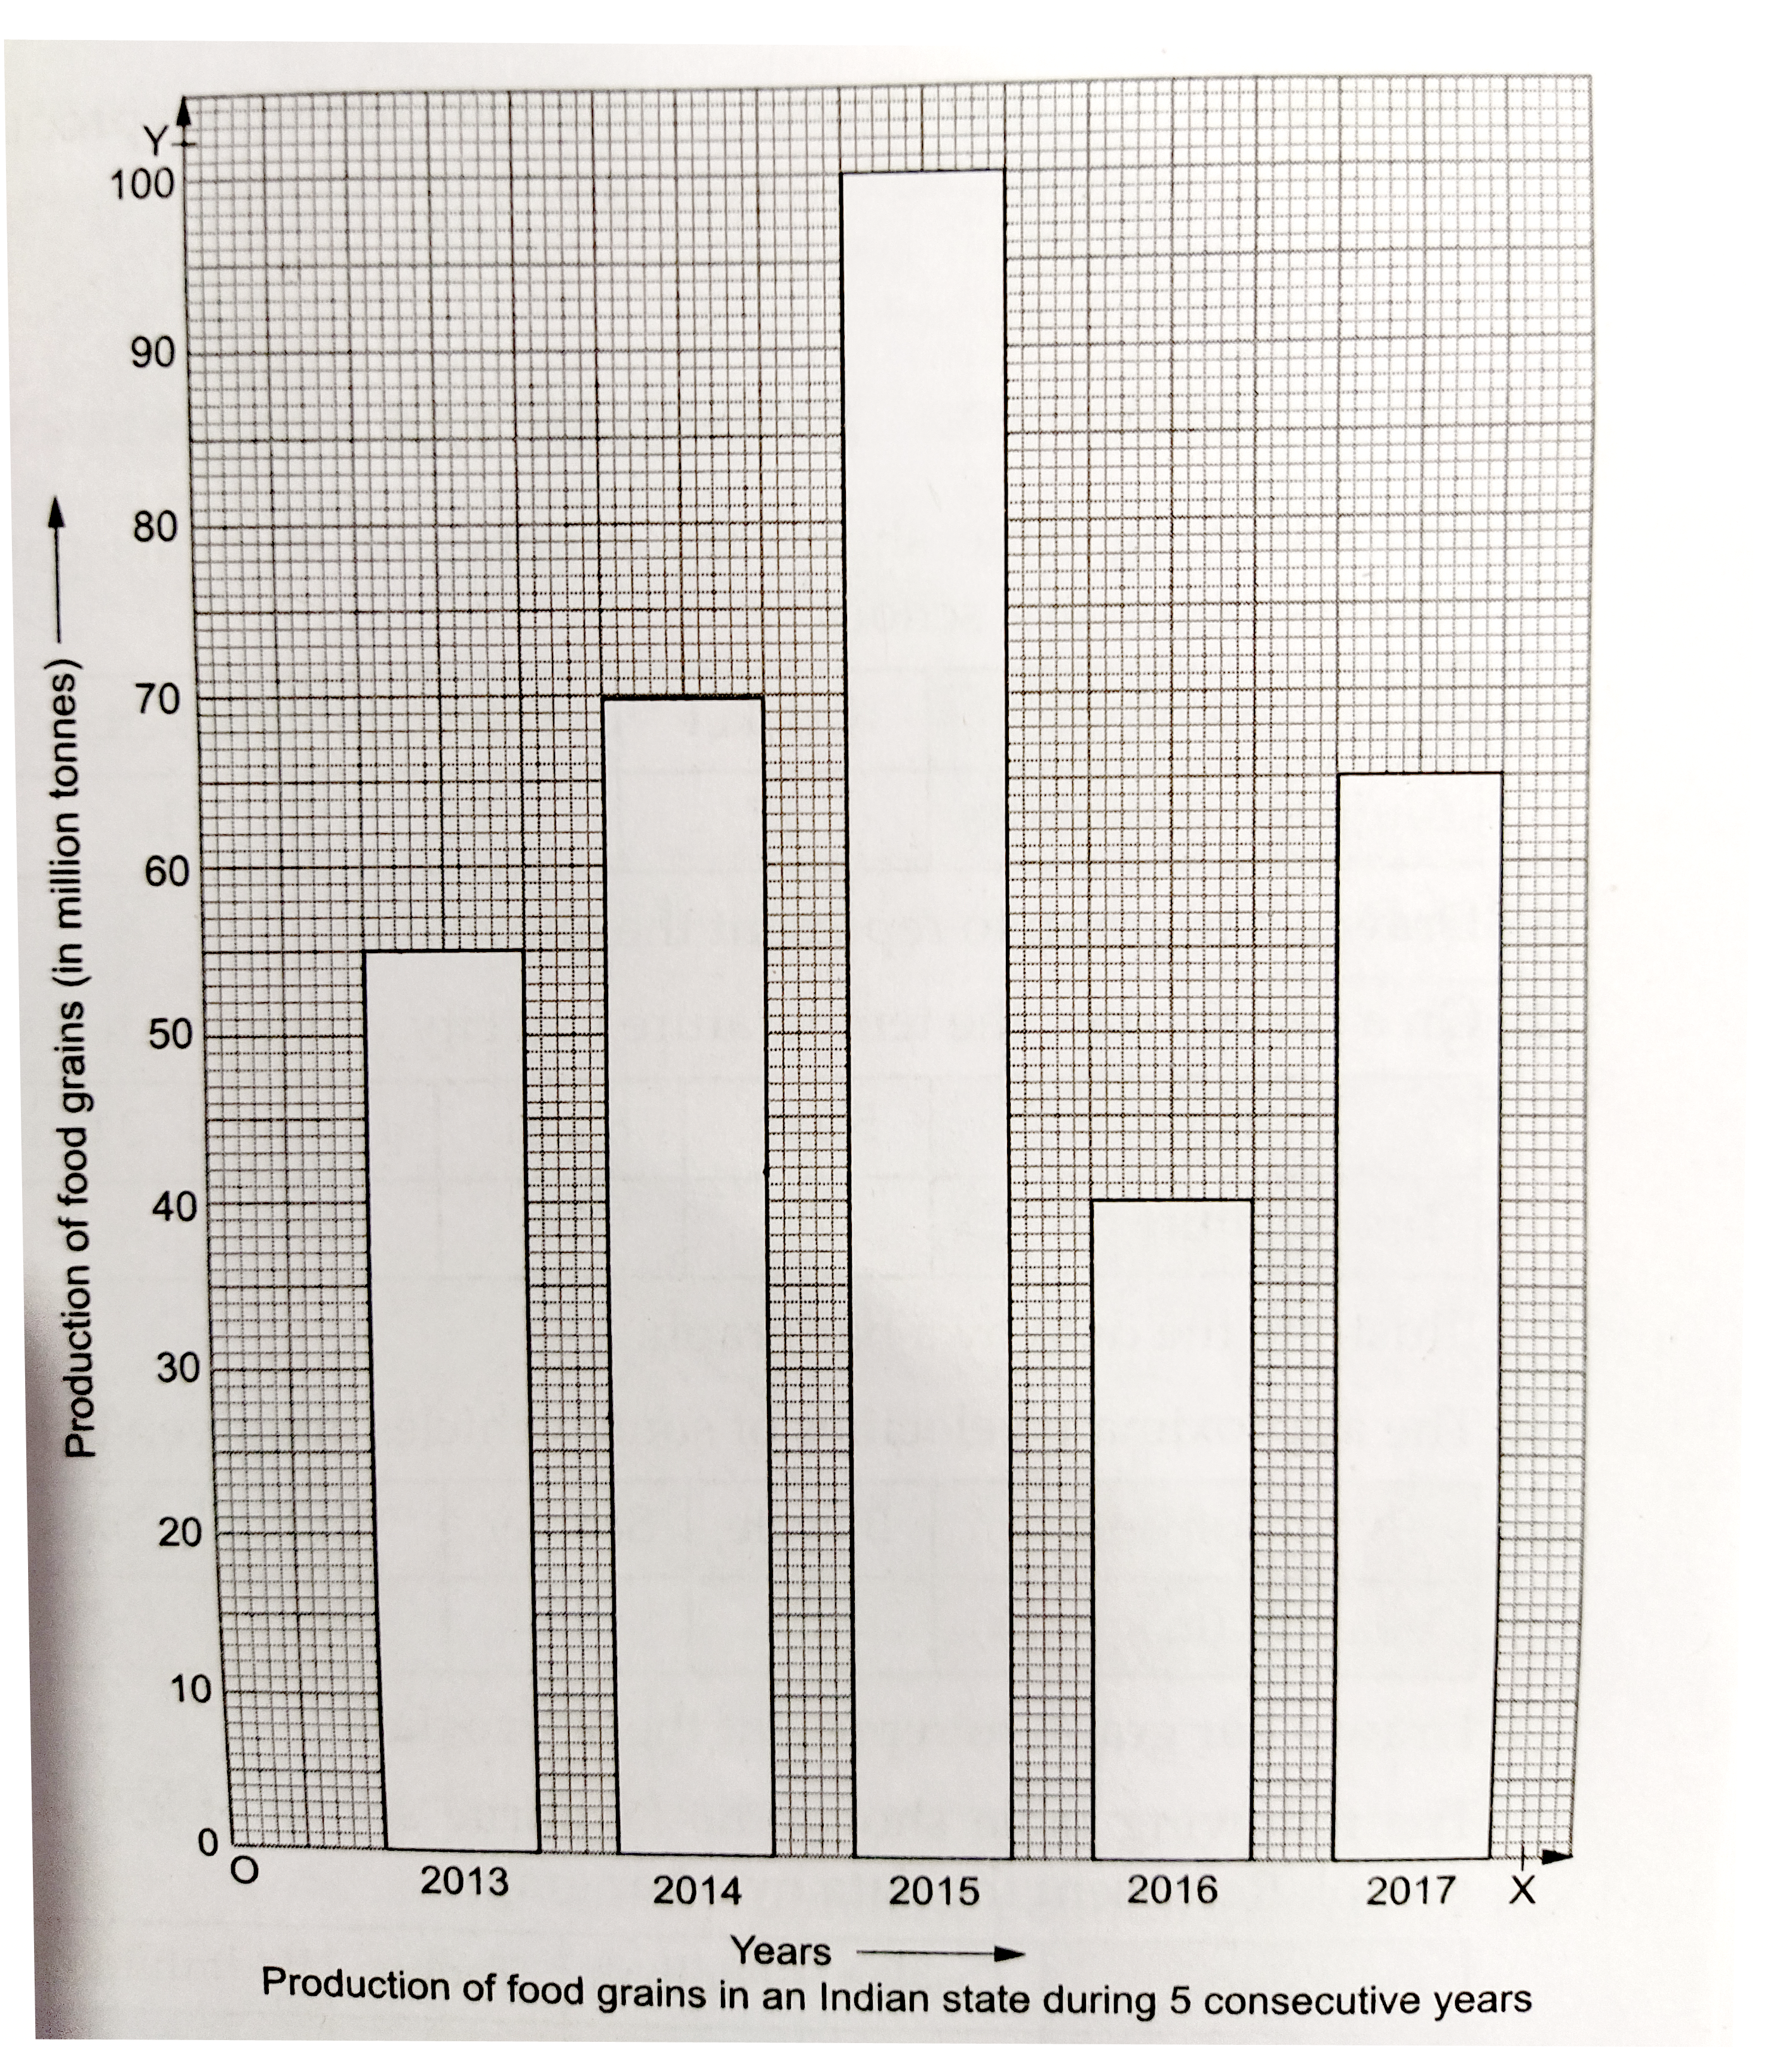
(i) The given bar graph shows the annual production (in million tonnes) of food grains in an Indian state during the period from 2013 to 2017.
(ii) (ii) It is clear that the bar of maximum height corresponds to the year 2015. So, the production was maximum in that year.
(iii)From the bar graph, we find that there was a sudden fall in the production after the year 2015.
(iv) The maximum production in a year during the given period 100 million tonnes.
The minimum production in a year during the given period=40million tonnes.
∴ maximum production: minimum production
=100:40=5:2
Topper's Solved these Questions
- BAR GRAPH, HISTOGRAM AND FREQUENCY POLYGONBOOK - RS AGGARWALCHAPTER - BAR GRAPH, HISTOGRAM AND FREQUENCY POLYGONEXERCISE - EXAMPLE
11 Videos
- BAR GRAPH, HISTOGRAM AND FREQUENCY POLYGONBOOK - RS AGGARWALCHAPTER - BAR GRAPH, HISTOGRAM AND FREQUENCY POLYGONEXERCISE - EXERCISE 17A
12 Videos
- AREAS OF TRIANGLES AND QUADRILATERALSBOOK - RS AGGARWALCHAPTER - AREAS OF TRIANGLES AND QUADRILATERALSEXERCISE - Multiple Choice Questions (Mcq)
16 Videos
- CIRCLES BOOK - RS AGGARWALCHAPTER - CIRCLES EXERCISE - MULTIPLE CHOICE QUESTION(MCQ)
37 Videos
Similar Questions
Read the bar graph given below
Read the bar graph carefully and answer the following questions
Q(i) What information is given by the bar graph
(ii) In which year was the production maximum
(iii) After which year was there a sudden fall in the production
(iv) Find the ratio between the maximum production and the minimum production during the given period
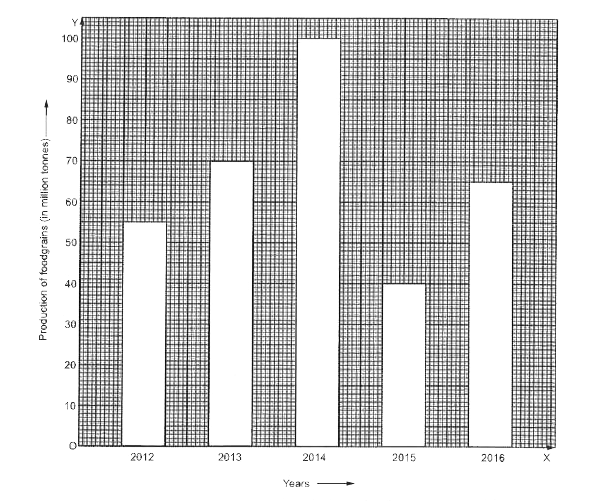
View SolutionRead the bar graph given below and answer the following questions:
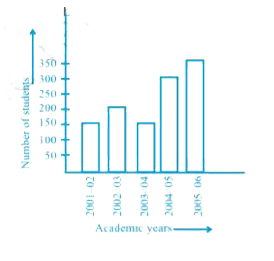
What information is given by the þar graph?
View Solution
Knowledge Check
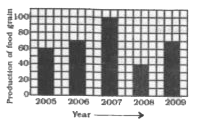
Study the bar graph showing the production of food grains (in million tons).
What is the ratio between the maximum production and the minimum production during the given period ?A1:2B2:3C3:4D5:2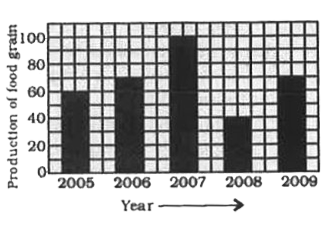
Study the above bar graph showing the production of food grains (in million tons). What is the ratio between the maximum production and the minimum production during the given period ?A1:2B2:3C3:4D5:2
Read the bar graph and answer the following questons.
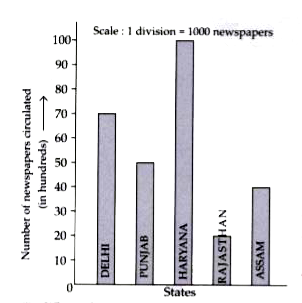
What information is given by graph ?
View SolutionRead the following bar graph given in figure and answer the following questions.
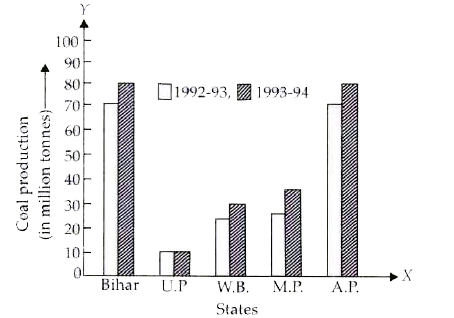
(i) What information is given by this bar graph?
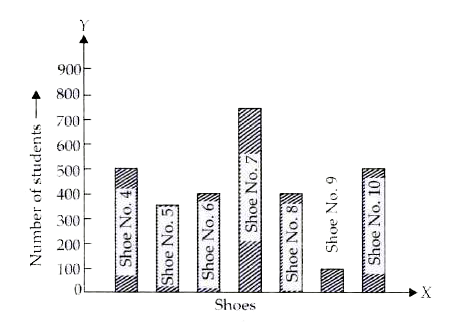
View SolutionRead the bar graph shown in figure and answer the following questions.
What is the information given by the bar graph?
View SolutionStudy the bar graph given below and answer the questions that follow.
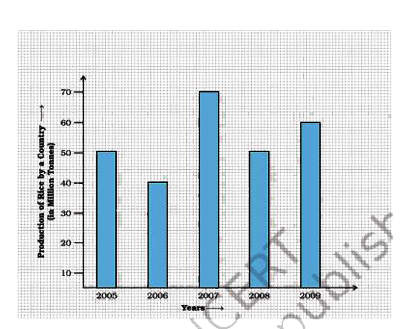
(a) What information does the above bar graph represent?
(b) In which year was production the least?
(c) After which year was the maximum rise in the production?
(d) Find the average production of rice during the 5 years.
(e) Find difference of rice production between years 2006 and 2008.
View SolutionRead the following bar graph and answer the following question: What information is given by the bar graph? In which year the export is minimum? In which year the import is maximum? In which year the difference of the values of export and import is maximum?
View SolutionRead the following bar graph (Figure) and answer the following questions: What information is given by the bar graph? What was the production of cement in the year 1980-81? What is the minimum and maximum productions of cement and corresponding years?
View Solution
