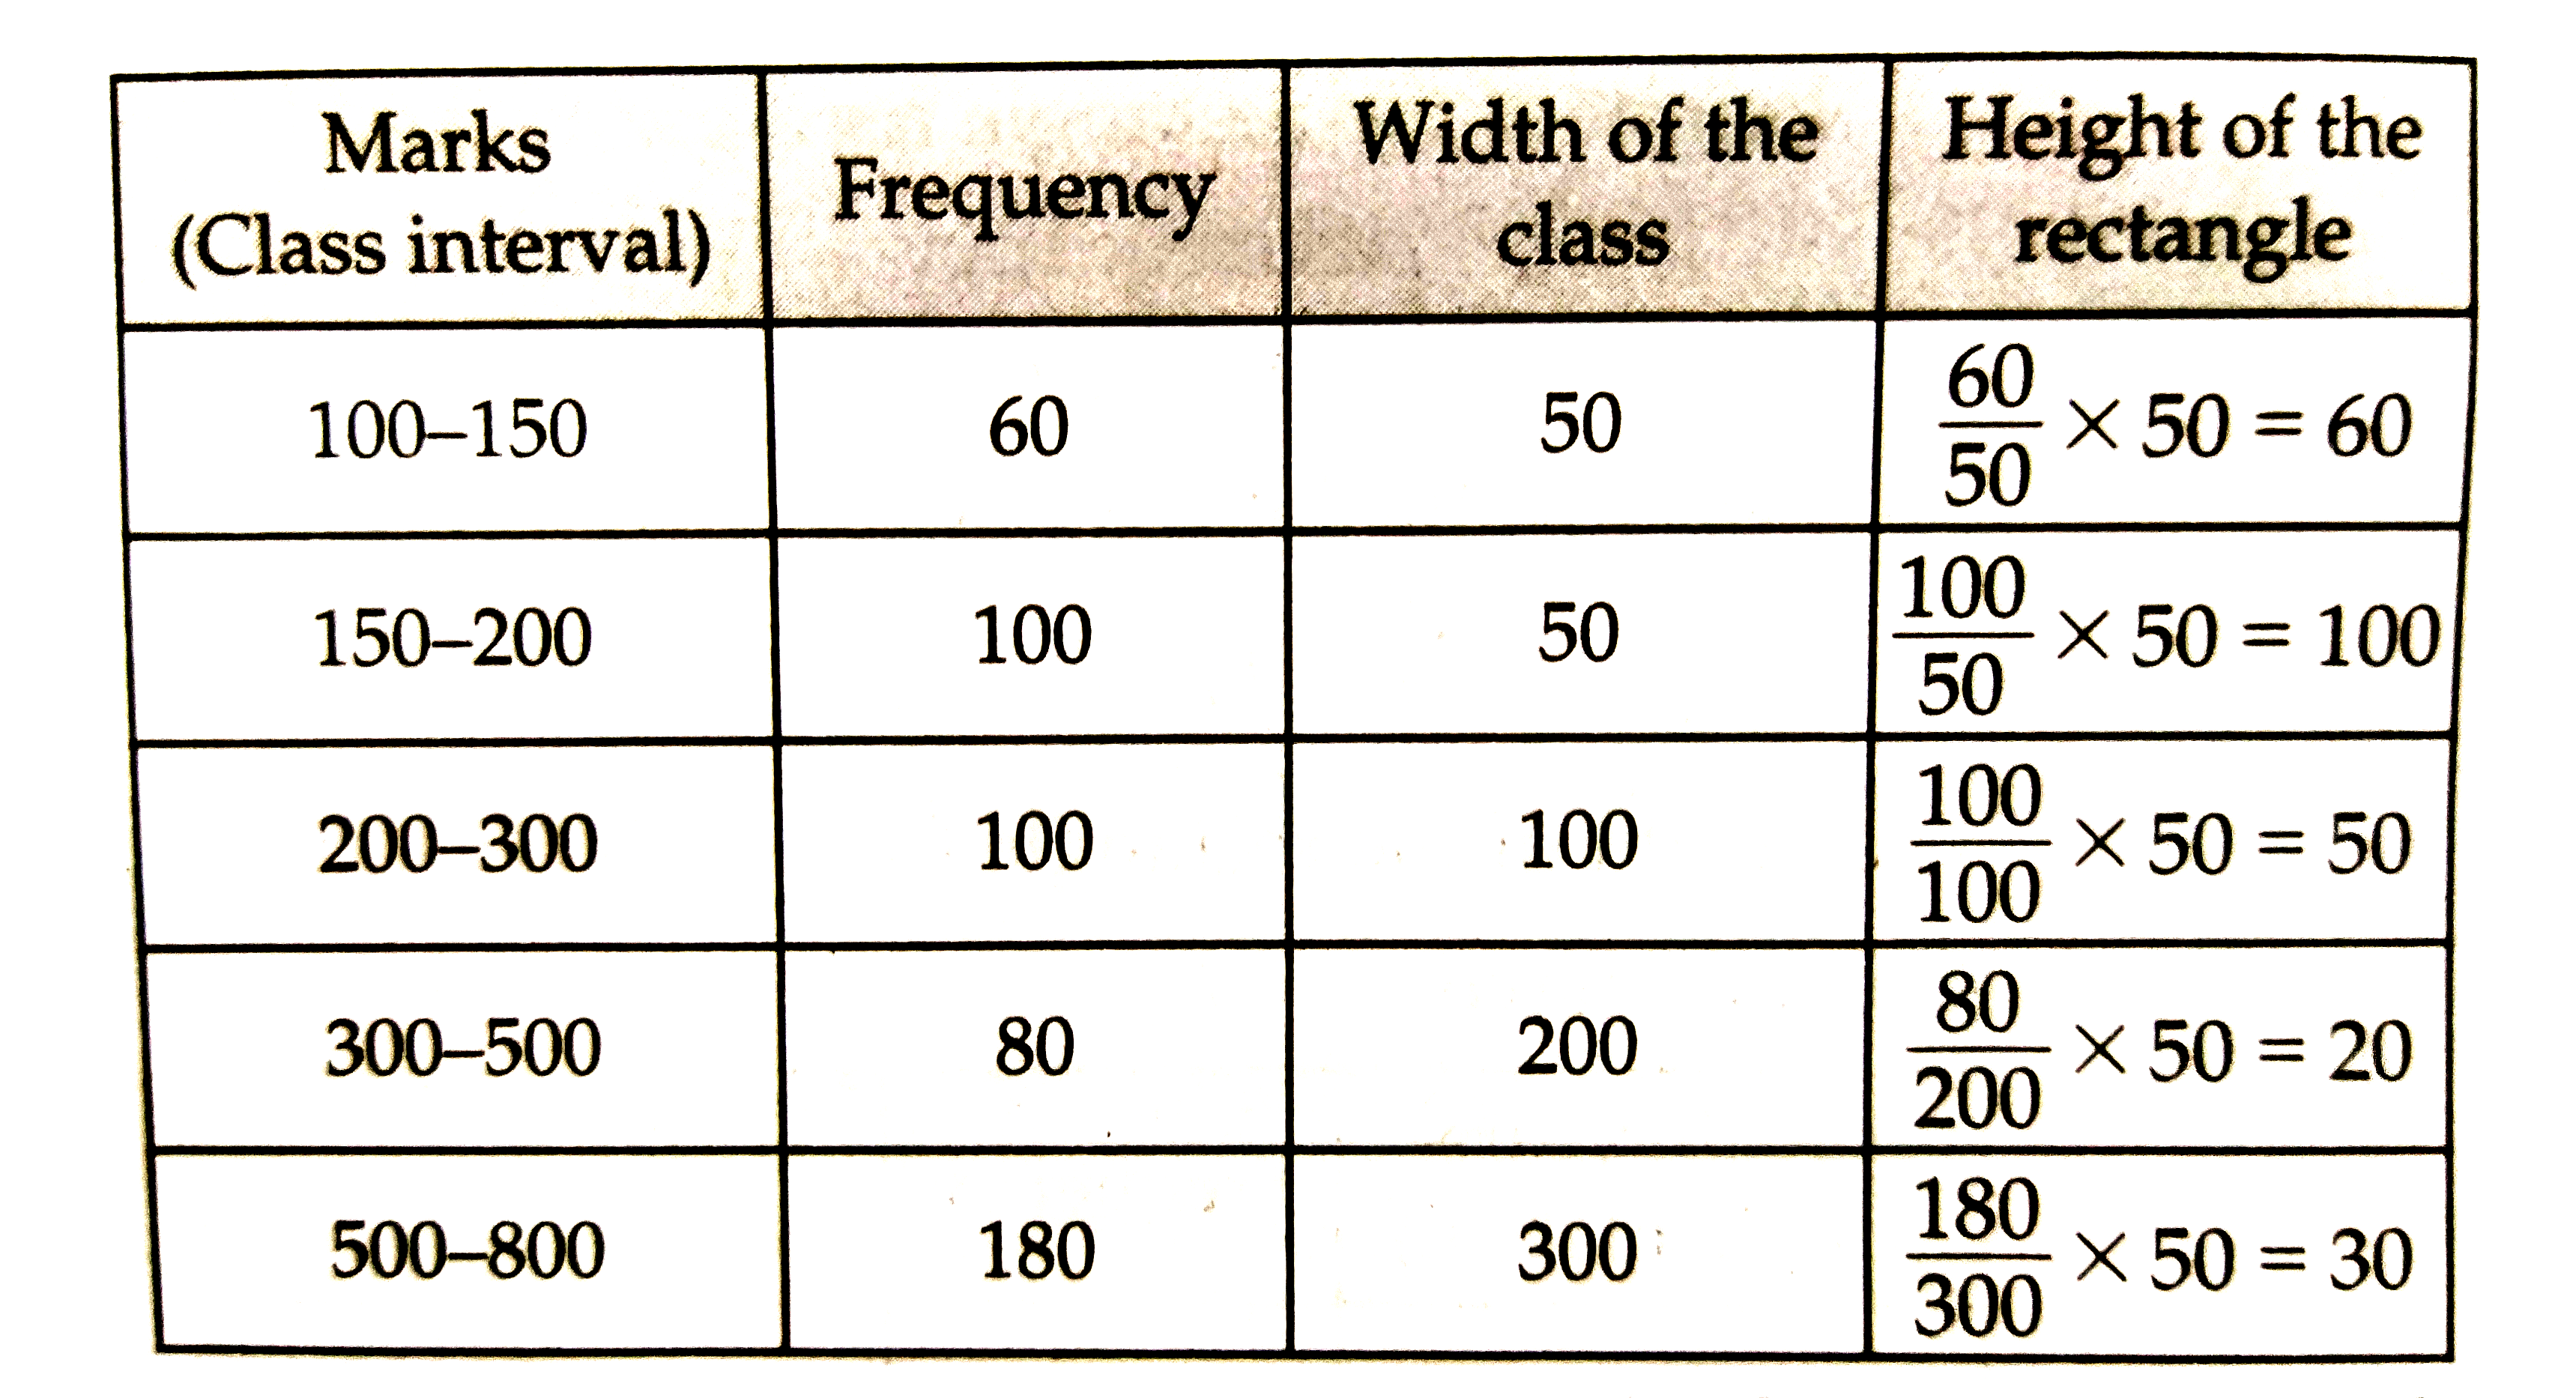
Following is the frequency distribution of the total marks obtained by the students of all sections of a class in an examination:

Draw a histogram for the above given distribution.
In the given frequency distribution, the class intervals are not of equal width. So, we would make modifications in the heights of rectangles in the histogram in such a way that the areas of rectangles are proportional to the frequencies.
Here, minimum class size =50.
Height of the rectangle for a given class interval
={its frequencyits width×50}
For example, the height for class interval 300-500 is =(80200×50)=20
Thus, we have
nce along the x-axis we do not start with 0, so we use a kink  in the beginning.
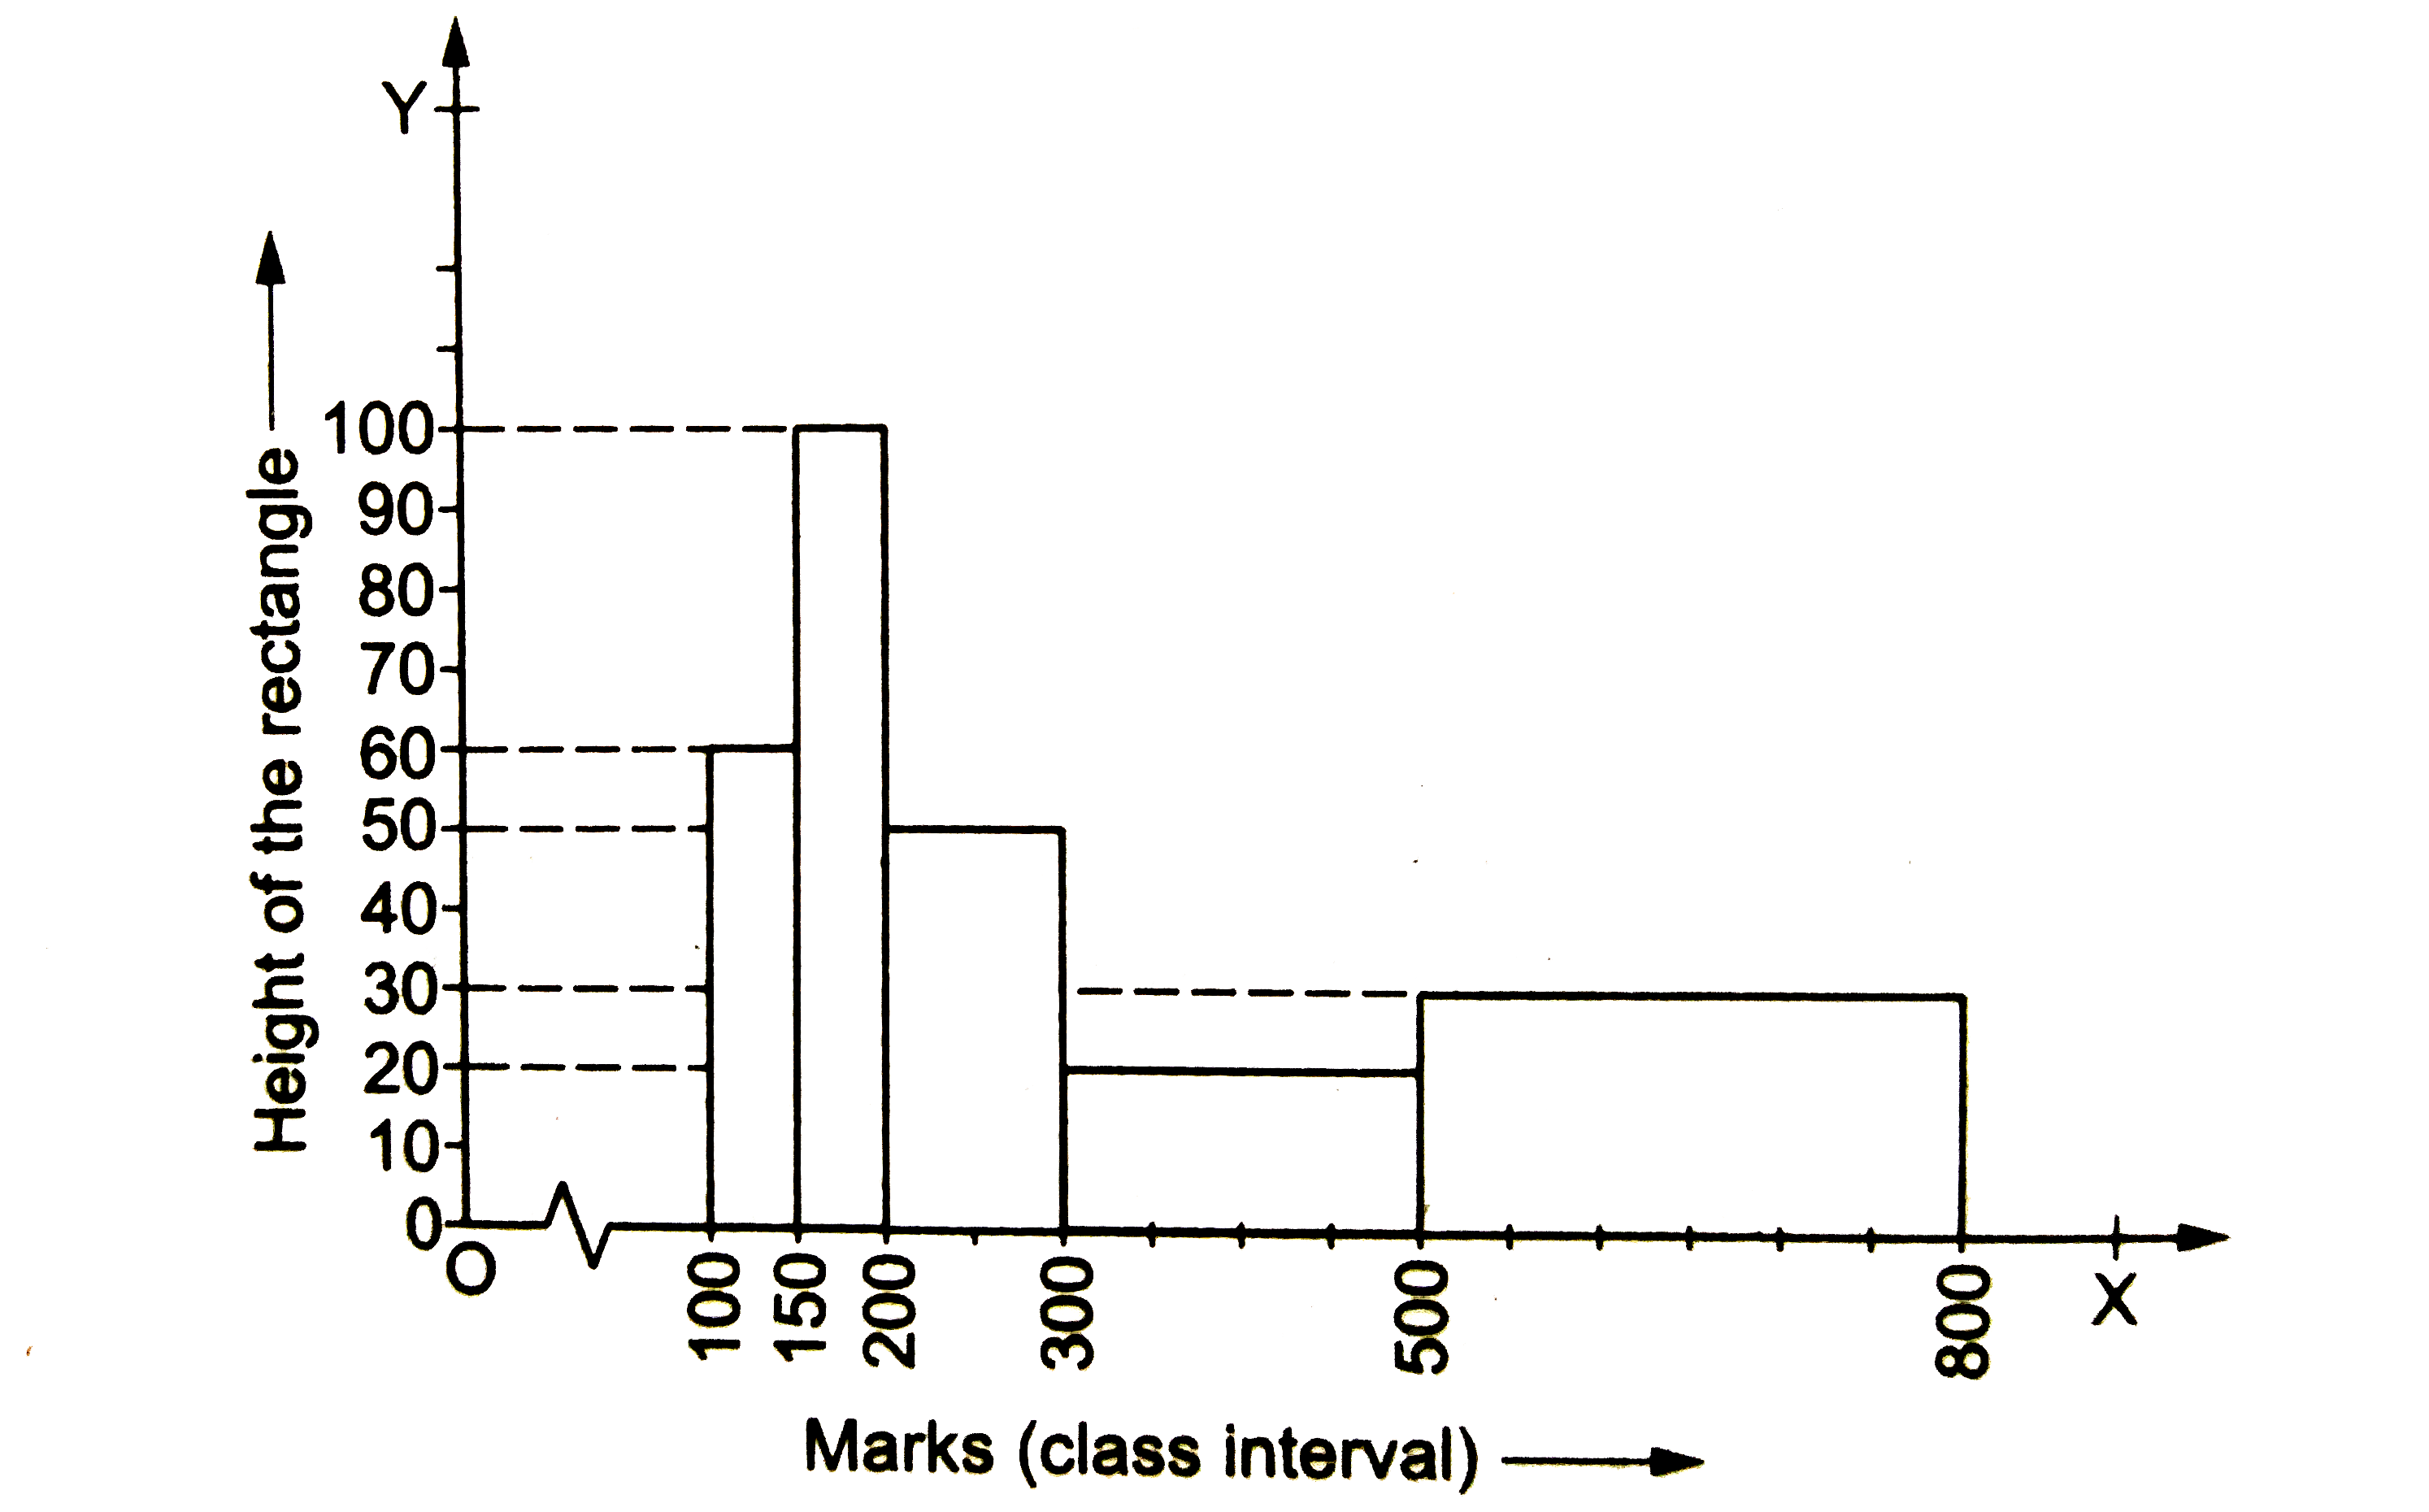
Now, we draw rectangles with given class intervals along the x-axis on a suitable scale and their corresponding heights along the y-axis on another suitable scale. Thus, we obtain the histogram of the given data, as shown below.
Topper's Solved these Questions
- BAR GRAPH, HISTOGRAM AND FREQUENCY POLYGONBOOK - RS AGGARWALCHAPTER - BAR GRAPH, HISTOGRAM AND FREQUENCY POLYGONEXERCISE - EXERCISE 17A
12 Videos
- BAR GRAPH, HISTOGRAM AND FREQUENCY POLYGONBOOK - RS AGGARWALCHAPTER - BAR GRAPH, HISTOGRAM AND FREQUENCY POLYGONEXERCISE - EXERCISE 17B
16 Videos
- BAR GRAPH, HISTOGRAM AND FREQUENCY POLYGONBOOK - RS AGGARWALCHAPTER - BAR GRAPH, HISTOGRAM AND FREQUENCY POLYGONEXERCISE - EXERCISE 17B
16 Videos
- AREAS OF TRIANGLES AND QUADRILATERALSBOOK - RS AGGARWALCHAPTER - AREAS OF TRIANGLES AND QUADRILATERALSEXERCISE - Multiple Choice Questions (Mcq)
16 Videos
- CIRCLES BOOK - RS AGGARWALCHAPTER - CIRCLES EXERCISE - MULTIPLE CHOICE QUESTION(MCQ)
37 Videos
Similar Questions
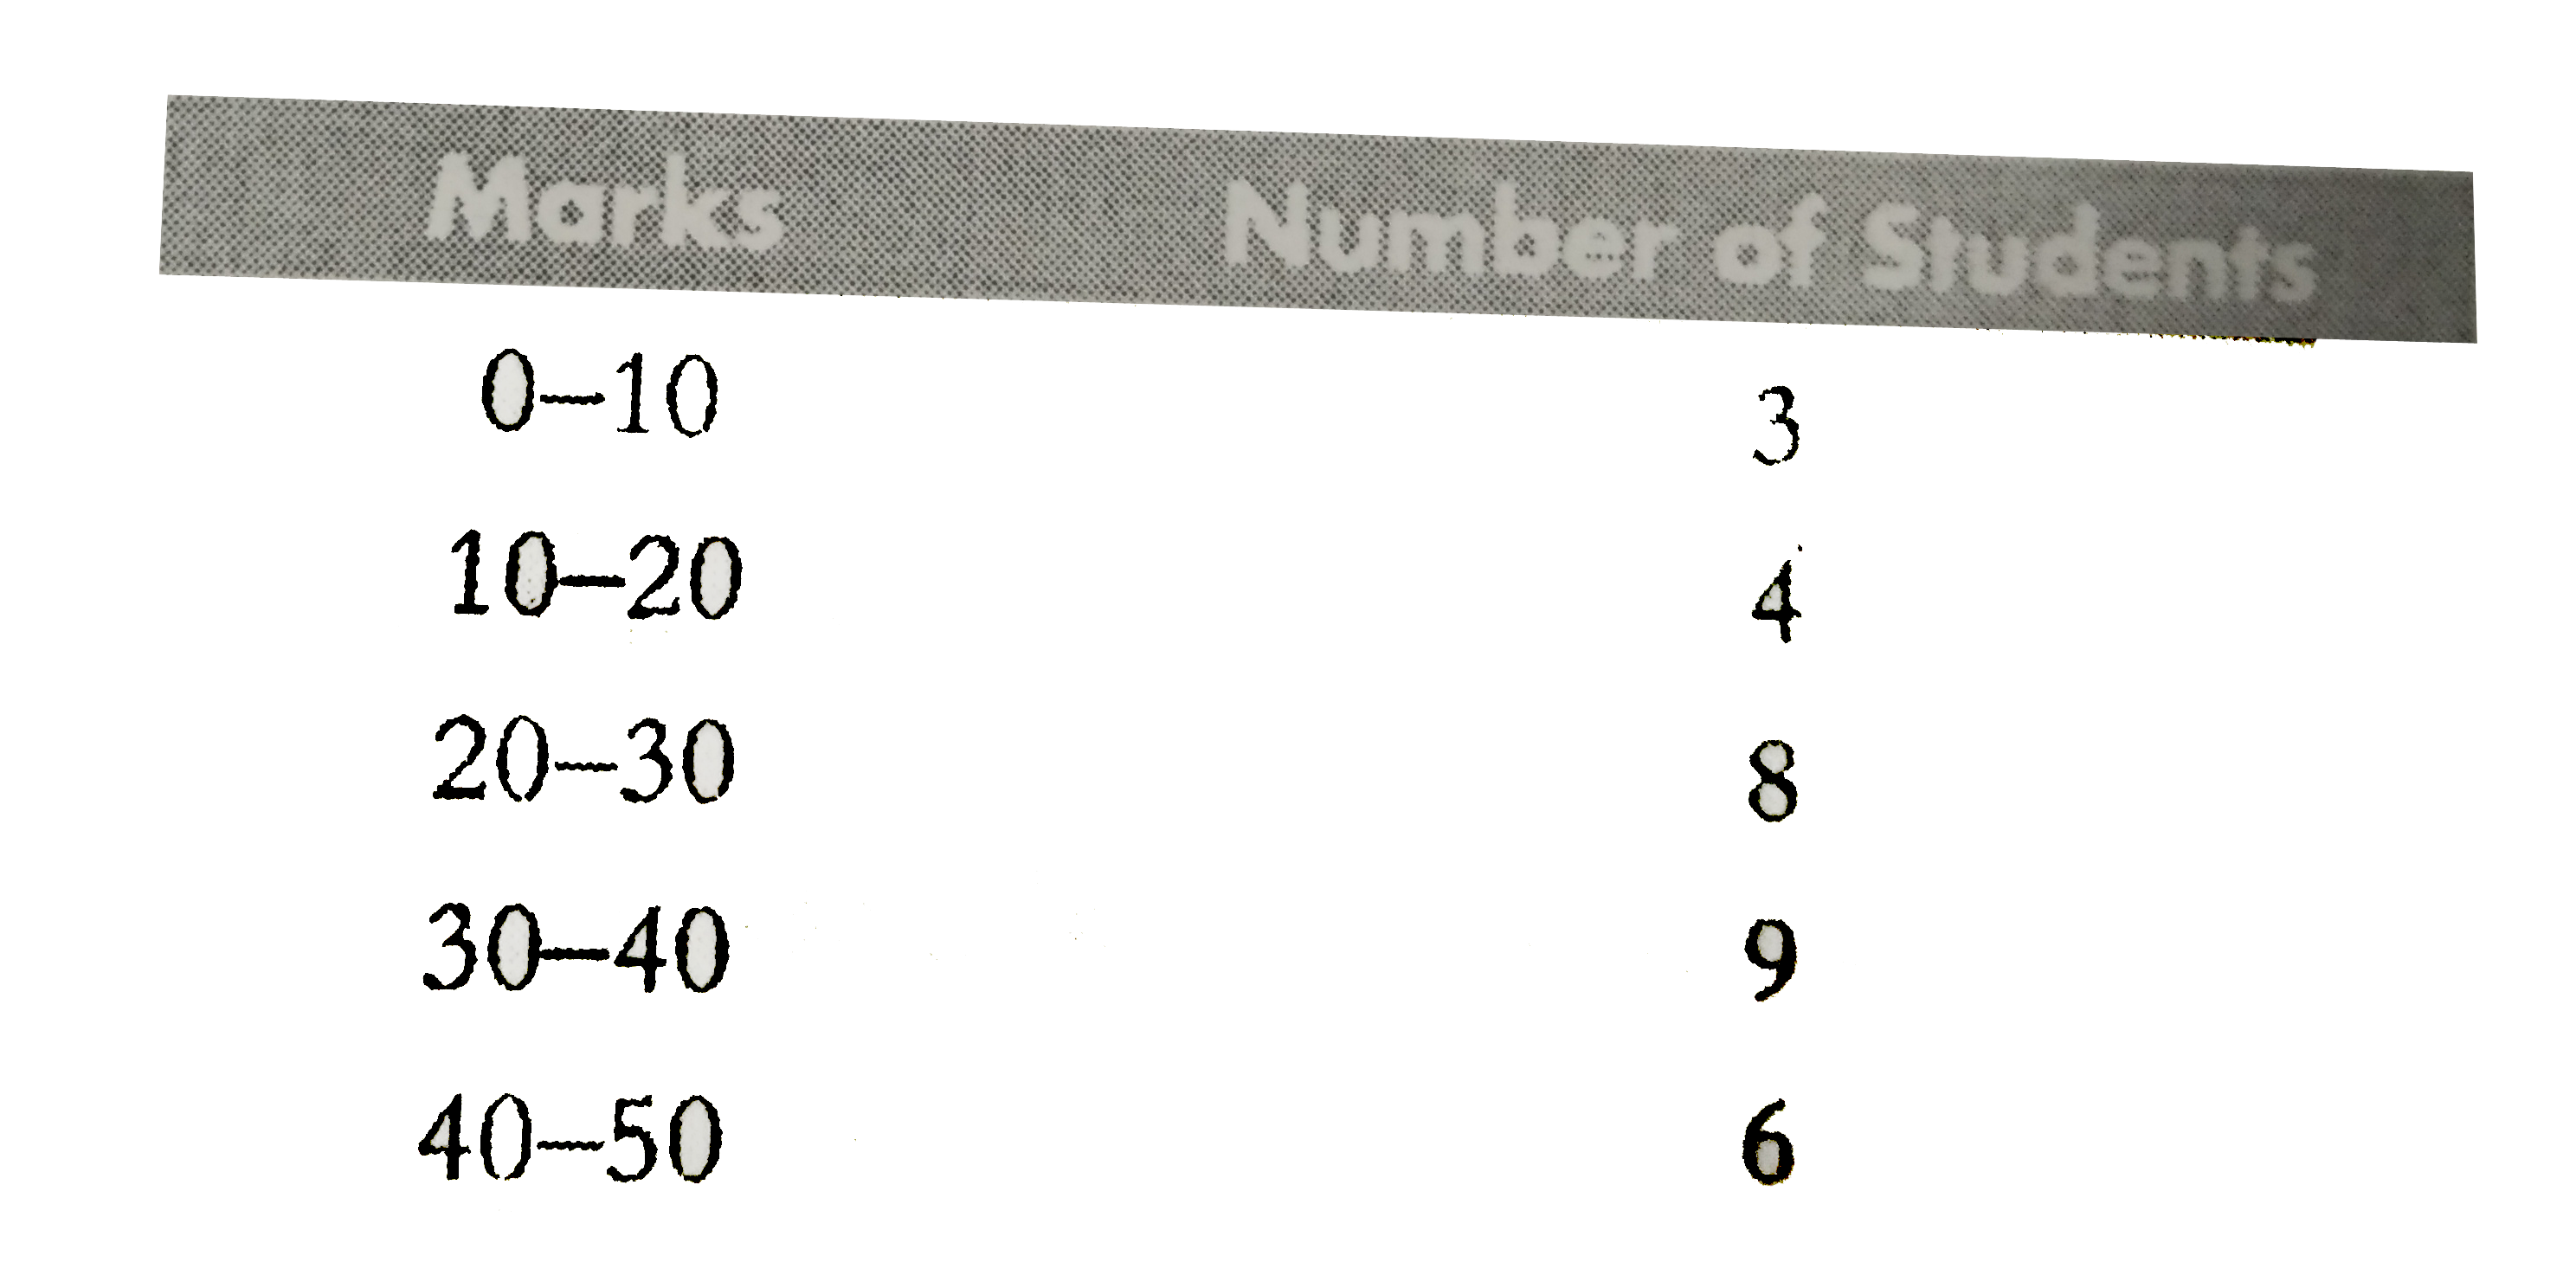
Draw the histogram for the following distribution :
View SolutionDraw a histogram of the following distribution.
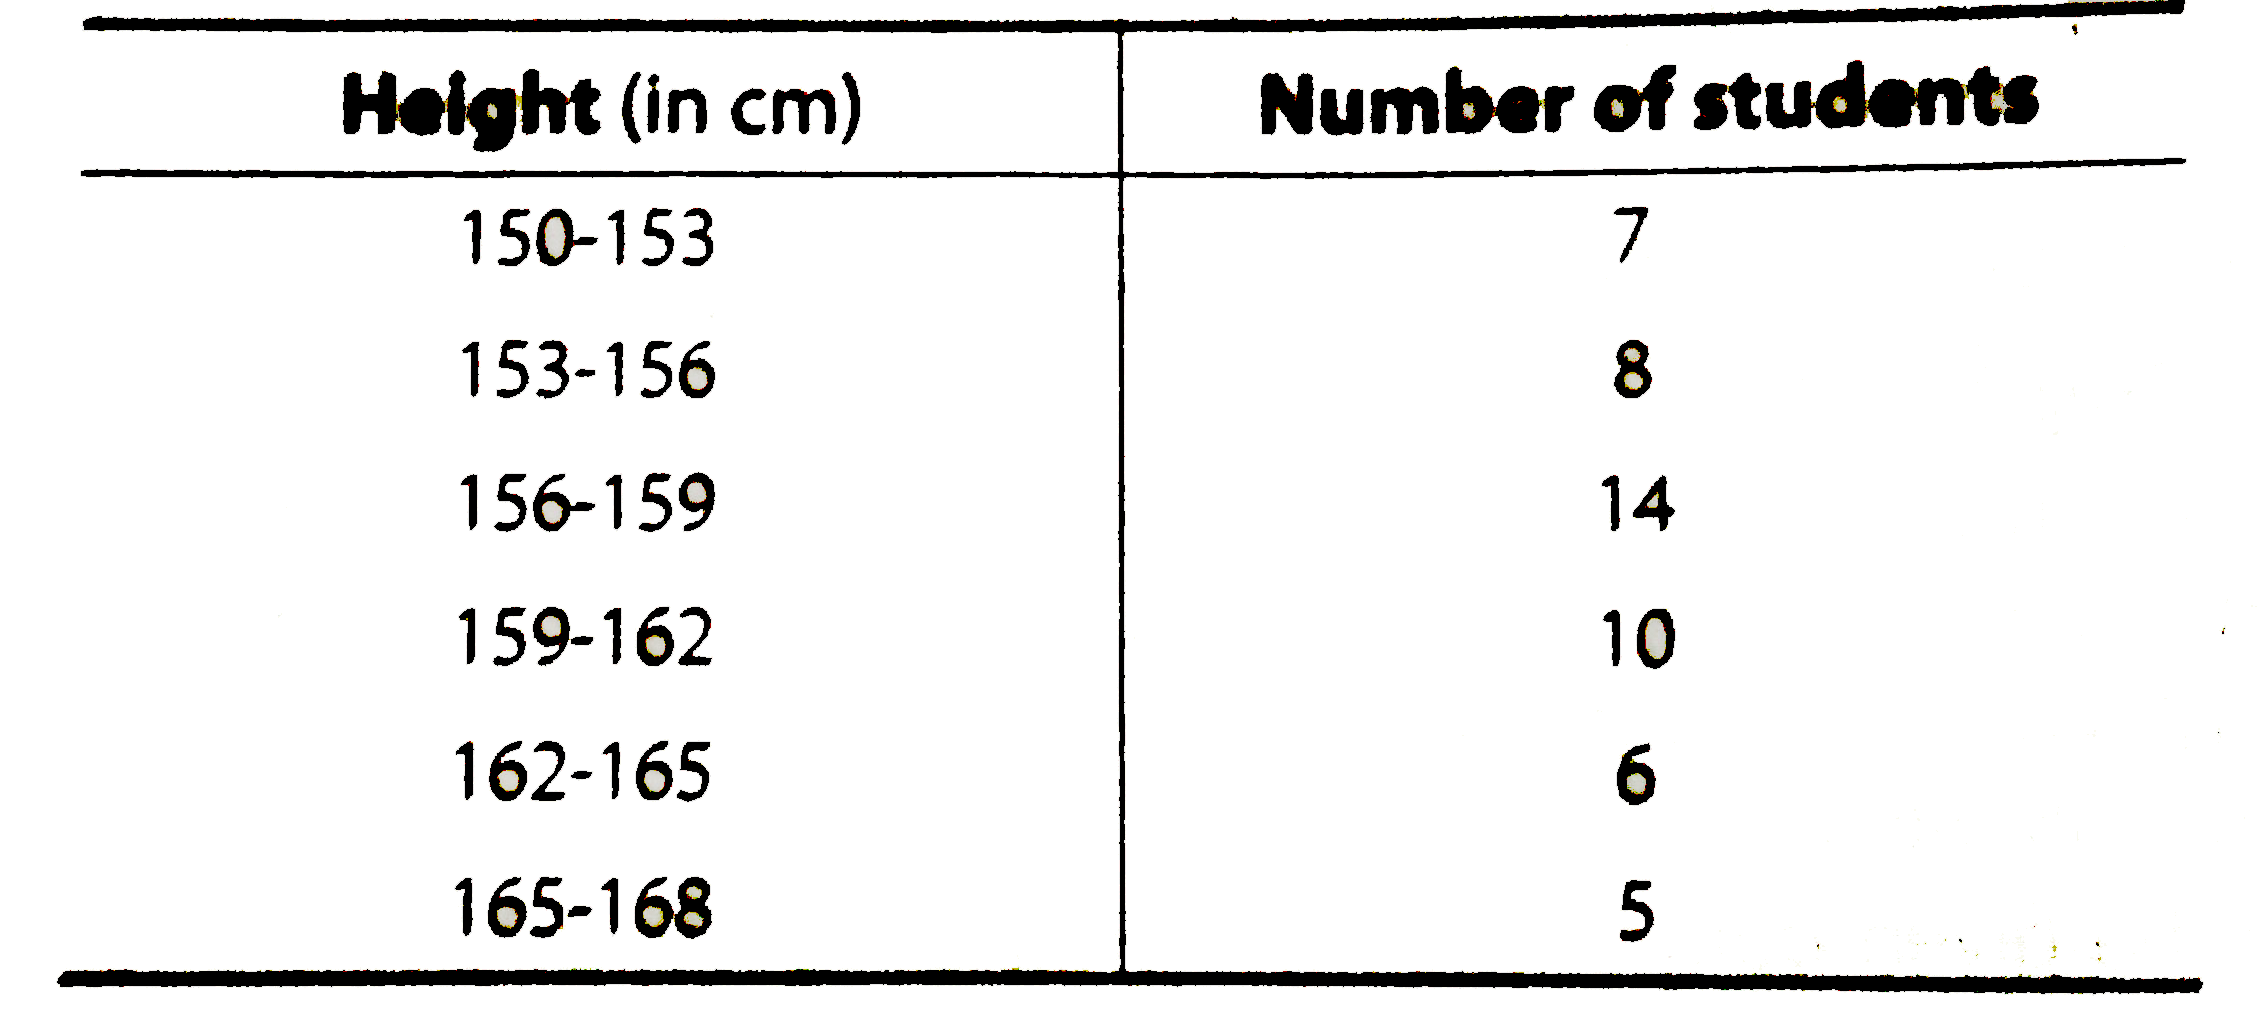
View SolutionDraw a histogram for the following frequency distribution.
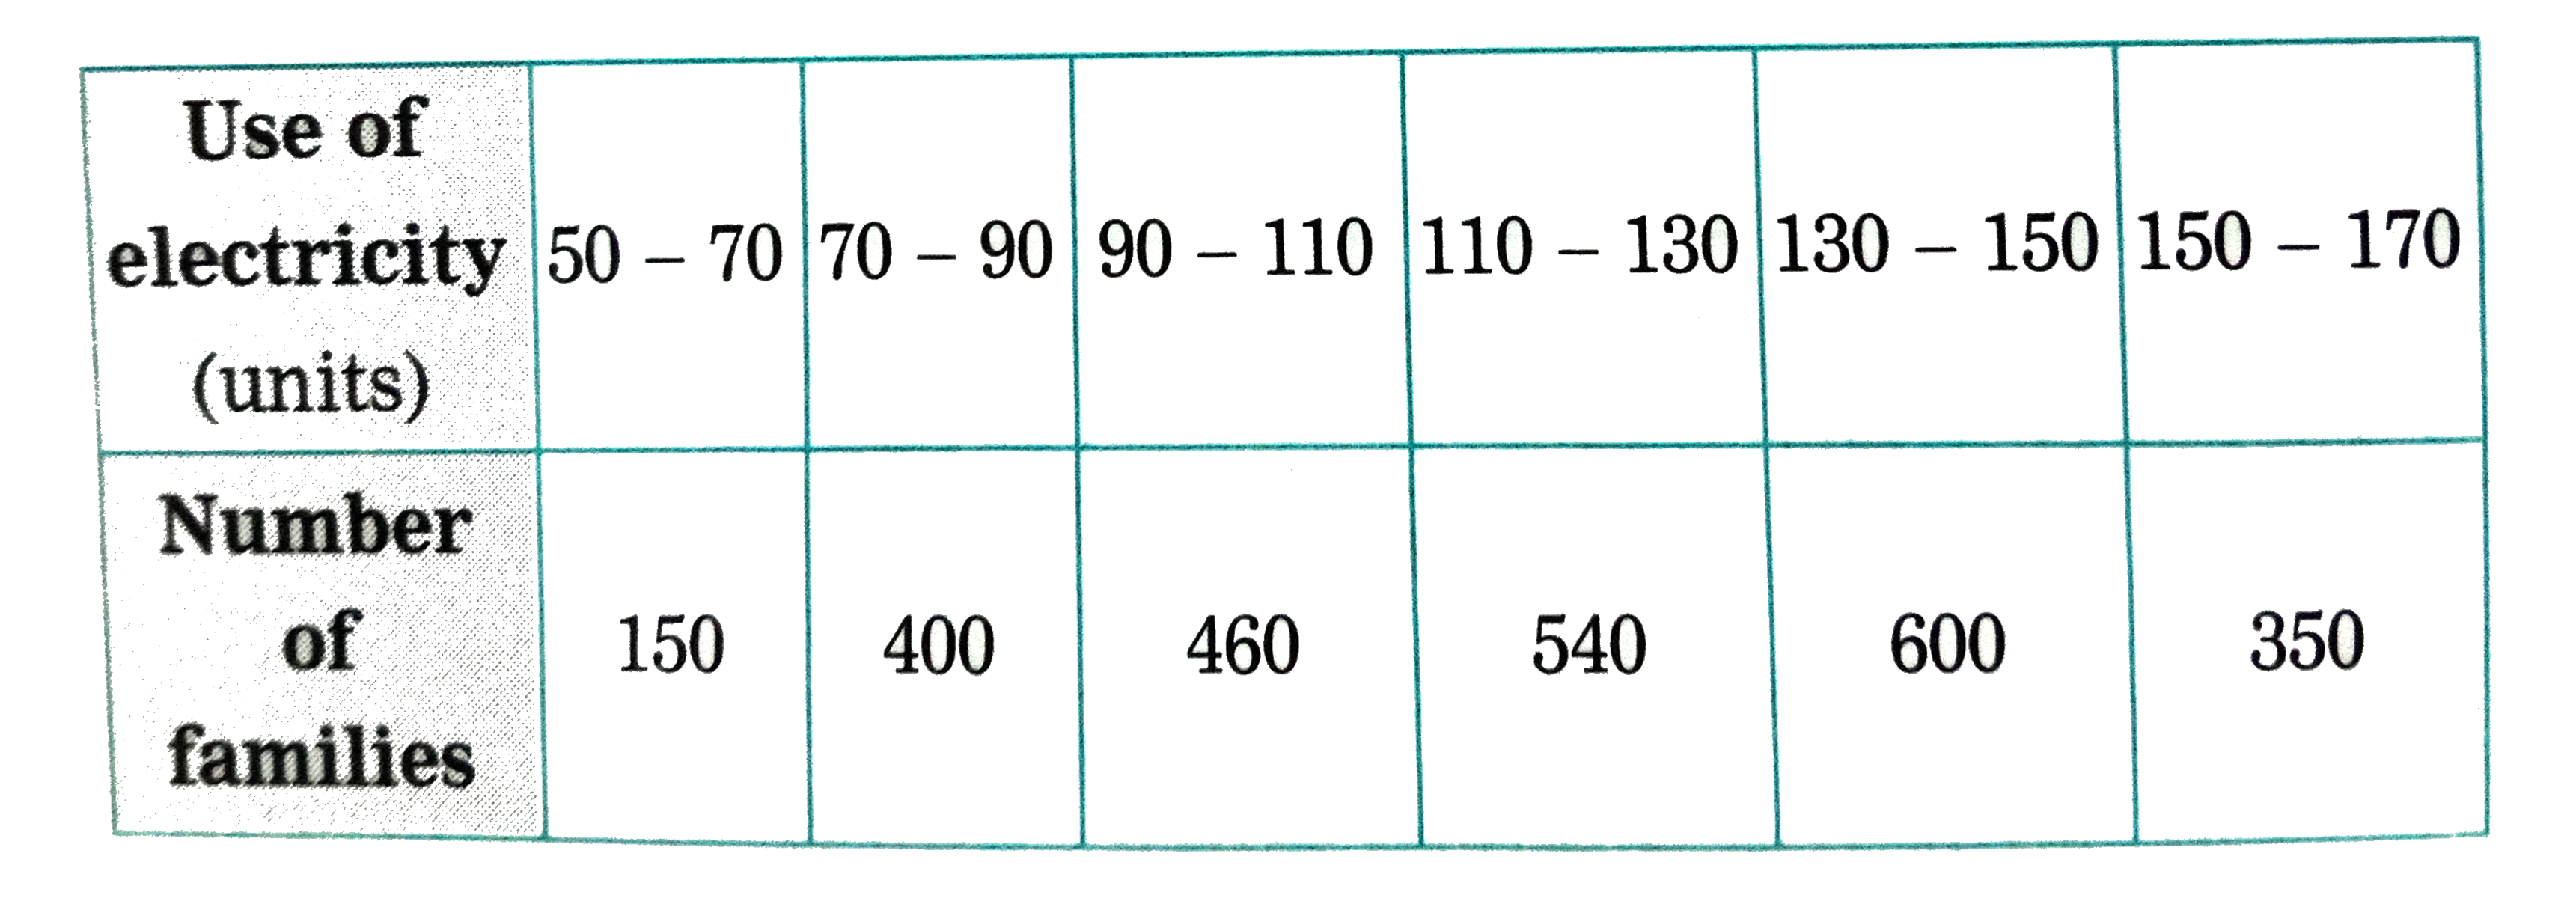
View SolutionDraw a histogram representing the following distribution.

View SolutionDraw a histogram representing the following distribution.

View SolutionThe marks scored by students in Mathematics in a certain examinations are given below:

Draw histogram for the above data.
View SolutionThe marks scored by students in Mathematics in a certain examinations are given below:

Draw histogram for the above data.
View SolutionThe following frequency distribution table shows marks obtained by 180 students in Mathematics examination :
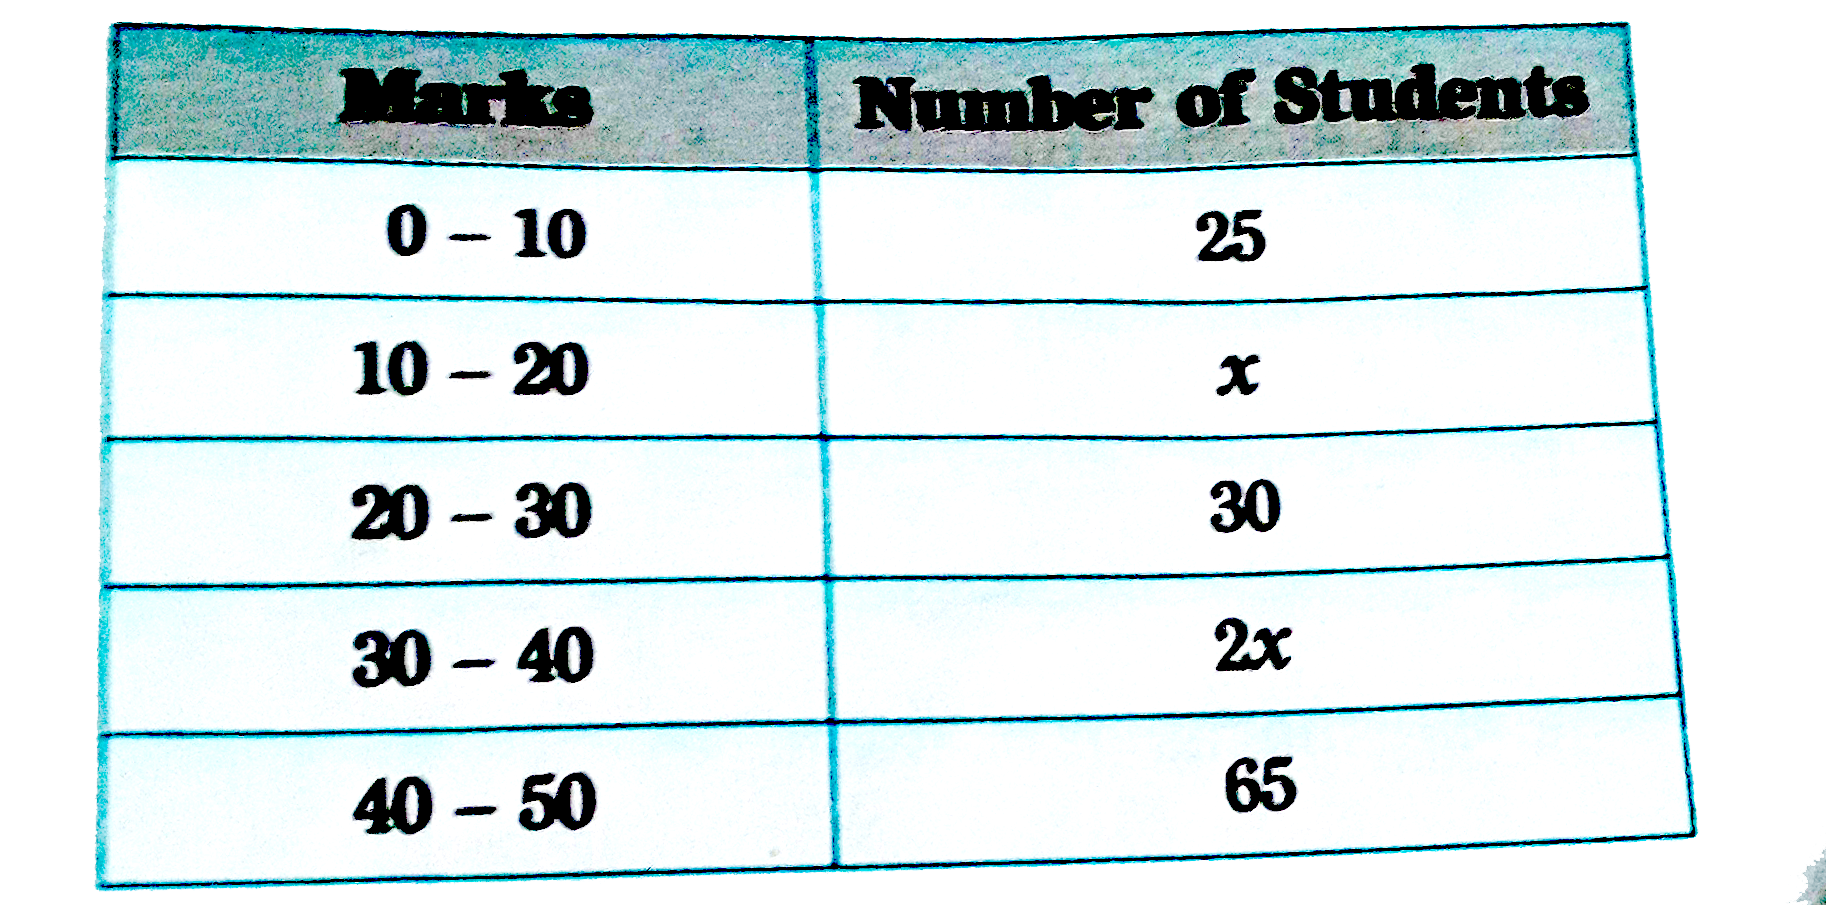
Find the value of x.
Also draw a histogram representing the above informations.
View SolutionDraw the Histogram for the following frequency distribution.

View SolutionDraw the histogram for the following frequency distribution :

View Solution
