In which year was the difference in number of students in Arts and Science exactly 130?
1 2001
2 2002
3 2004
4 2006
Answer : 2. "2002"
Related Solutions
दिया गया दंड आरेख (बार ग्राफ) विभिन्न वर्षो में एक स्कूल के विज्ञान और कला क्षेत्र के विद्यार्थियों की संख्या को दर्शाता है।
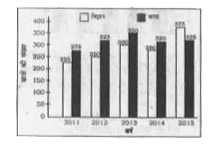
किस वर्ष में कला के विद्यार्थियों की संख्या विज्ञान की तुलना में से अधिक है ?
View SolutionThe given Bar graph presents the numbers of students from Science and Arts streams from a school in different years. In which year the number of Arts students is 30% more than that of Science?
View SolutionThe given Bar graph present the number of students from Science and Arts streams from a school in different years
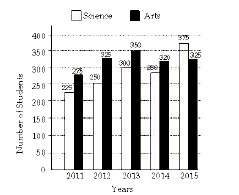
In which year the number of arts students is 30% more than that of science?
View Solutionदिया गया दंड आरेख (बार ग्राफ) विभिन्न वर्षो में एक स्कूल के विज्ञान और कला क्षेत्र के विद्यार्थियों की संख्या को दर्शाता है।
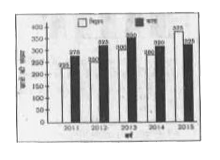
और में विज्ञान के विद्यार्थियों की कुल संख्या का और में कला के विद्यार्थियों की कुल संख्या से क्या अनुपात है।
View Solutionदिया गया दंड आरेख (बार ग्राफ) विभिन्न वर्षो में एक स्कूल के विज्ञान और कला क्षेत्र के विद्यार्थियों की संख्या को दर्शाता है।
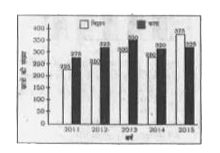
और में कला के विद्यार्थियों की कुल संख्या, दिए गए पाँच वर्षों में विज्ञान के विद्यार्थियों से कितने प्रतिशत कम है (एक दशमलव स्थान तक सही) ?
View SolutionThe given bar graph (bar graph shows the number of students in science and arts field of a school in different years. The total number of students of Arts in 2011, 2013 and 2015 is what percent less (correct to one decimal place) than the students of Science in the given five years?
View SolutionThe following graph shows the number of students admitted in different divisions of a school. If 1000 students got admission in science, then what is the ratio of science and arts students?
View Solutionदिया गया दंड आरेख (बार ग्राफ) विभिन्न वर्षो में एक स्कूल के विज्ञान और कला क्षेत्र के विद्यार्थियों की संख्या को दर्शाता है।
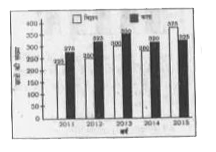
और में विज्ञान के विद्यार्थियों की औसत संख्या में कला के विद्यार्थियों की संख्या से कितने प्रतिशत अधिक है ?
View SolutionThe given Bar graph present the number of students from Science and Arts streams from a school in different years

The total number of Arts students in 2011, 2013 and 2015 is what percentage less than that of science in the given five years
View Solutionनिम्नलिखित बार ग्राफ में वर्ष 2004-2005 से 2007-2008 तक के सत्र में किसी कॉलेज में विद्यार्थियों की कला,विज्ञान और वाणिज्य विषयों में दर्शायी गई है। ग्राफ का अध्ययन कीजिए
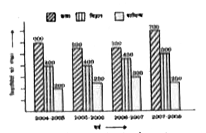
विज्ञान में विद्यार्थियों की औसत संख्या का वाण्जिय विषय में विद्यार्थियों की औसत संख्या में अनुपात ज्ञात कीजिए।
View SolutionThe following bar graph shows the number of students in Arts, Science and Commerce subjects in a college for the year 2004-2005 to 2007-2008. study the graph Find the ratio of the average number of students in Science to the average number of students in Commerce.
View SolutionThe following pie-chart shows the number of students admitted in different feculties of a college. If 1000 students are admitted in Science answer the following:
(i) What is the total number of students?
(ii) What is the ratio of students in science and arts?
View SolutionThe given Bar graph presents the numbers of students from Science and Arts streams from a school in different years. The average of number of Science stu- dents in 2011, 2013 and 2015 is what percentage more than the number of Arts students in 2011?
View Solutionएक स्कुल में 40% विज्ञान के विद्यार्थी तथा शेष 60% कला के विद्यार्थी है। विज्ञान के विद्यार्थियों में 10% लड़कियाँ है। यादृच्छिक एक विद्यार्थी के चयन करने पर वह लड़की है, तो इस बात की प्रायिकता है कि यह कला की विद्यार्थी है?
View SolutionIn a school there are 40% science students and the remaining 60% are arts students. It is known that 5% of the science students are girls and 10% of the arts students are girls. One student selected at random is a girl. What is the probability that she is an arts student?
View SolutionThe table given below shows the number of students studying Arts, Science, Commerce and Vacancy in a college in a given 5 years. What is the ratio of the annual average of the number of students studying Arts and the annual average of the number of students studying Science?
View SolutionThe given Bar graph present the number of students from Science and Arts streams from a school in different years

The average number of science students in 2011,2013 and 2015 is what percentage more than the number of Arts students in 2011?
View SolutionThe following bar graph shows the number of students in Arts, Science and Commerce subjects in a college for the year 2004-2005 to 2007-2008. study the graph Find the percentage of students in Science subject in the session 2005-2006.
View SolutionThe following bar graph shows the number of students in Arts, Science and Commerce subjects in a college for the year 2004-2005 to 2007-2008. study the graph Find the percentage of students in Science subject in the session 2005-2006.
View SolutionThe following bar graph shows the number of students in Arts, Science and Commerce subjects in a college for the year 2004-2005 to 2007-2008. study the graph What was the percentage increase in the number of arts students in the year 2007-2008 as compared to the year 2005-2006?
View Solution