The following pie-chart shows the number of
students admitted in different feculties of a
college. If 1000 students are admitted in Science answer the following:
(i) What is the total number of students?
(ii) What is the ratio of students in science and
arts?
To solve the problem step by step, we will follow the instructions given in the video transcript.
Step 1: Understand the Given Information
We know that:
- The number of students admitted in Science is 1000.
- The central angle for Science in the pie chart is 100 degrees.
- The total angle in a pie chart is 360 degrees.
Step 2: Find the Total Number of Students
We can set up a proportion based on the angles and the number of students.
Using the formula:
Number of students in Science=(Central angle for ScienceTotal angle)×Total number of students
We can rearrange this to find the total number of students:
Total number of students=(Number of students in Science×Total angleCentral angle for Science)
Substituting the values:
Total number of students=(1000×360100)
Calculating this gives:
Total number of students=360000100=3600
Step 3: Find the Number of Students in Arts
Next, we need to find the number of students in Arts. The central angle for Arts is given as 120 degrees. We can use the same formula:
Number of students in Arts=(Central angle for ArtsTotal angle)×Total number of students
Substituting the values:
Number of students in Arts=(120360)×3600
Calculating this gives:
Number of students in Arts=120×3600360=1200
Step 4: Find the Ratio of Students in Science to Arts
Now, we can find the ratio of students in Science to students in Arts:
Ratio of Science to Arts=Number of students in ScienceNumber of students in Arts=10001200
To simplify this ratio:
Ratio of Science to Arts=1000÷2001200÷200=56
Final Answers
(i) The total number of students is 3600.
(ii) The ratio of students in Science to Arts is 5:6.
---
We know that:
- The number of students admitted in Science is 1000.
- The central angle for Science in the pie chart is 100 degrees.
- The total angle in a pie chart is 360 degrees.
We can set up a proportion based on the angles and the number of students.
Number of students in Science=(Central angle for ScienceTotal angle)×Total number of students
We can rearrange this to find the total number of students:
Total number of students=(Number of students in Science×Total angleCentral angle for Science)
Substituting the values:
Total number of students=(1000×360100)
Calculating this gives:
Total number of students=360000100=3600
Next, we need to find the number of students in Arts. The central angle for Arts is given as 120 degrees. We can use the same formula:
Number of students in Arts=(Central angle for ArtsTotal angle)×Total number of students
Substituting the values:
Number of students in Arts=(120360)×3600
Calculating this gives:
Number of students in Arts=120×3600360=1200
Now, we can find the ratio of students in Science to students in Arts:
Ratio of Science to Arts=Number of students in ScienceNumber of students in Arts=10001200
To simplify this ratio:
Ratio of Science to Arts=1000÷2001200÷200=56
(i) The total number of students is 3600.
(ii) The ratio of students in Science to Arts is 5:6.
Topper's Solved these Questions
Similar Questions
The following bar graph represents the data for different sizes of shoes worn by the students in a school. Read the graph and answer the following questions.
(i)What are the different numbers of the shoe-worn by the students?
(ii)What is the number of students wearing shoe No. 6?
(iii)Which shoe number is worn by the maximum number of students?
(iv)Which shoe number is worn by the minimum number of students?
View SolutionTotal number of students of a school in different years is shown in the following table
View SolutionThe following pictograph shows the number of absentees in a class of 30 students during the previous week
View SolutionIn a class of 60 students, 30 students like Mathematics, 25 like Science and 15 like both. Then, the number of students who like either Mathematics or Science is
View SolutionThe following pie-chart gives the marks scored in an examination by a student in various subjects. If the total marks obtained by the student were 540, answer the following questions.
View SolutionIn a class of 36 students, 20 are girls and the rest are boys. Find the ratio of:
the number of boys to the total number of students in the class.
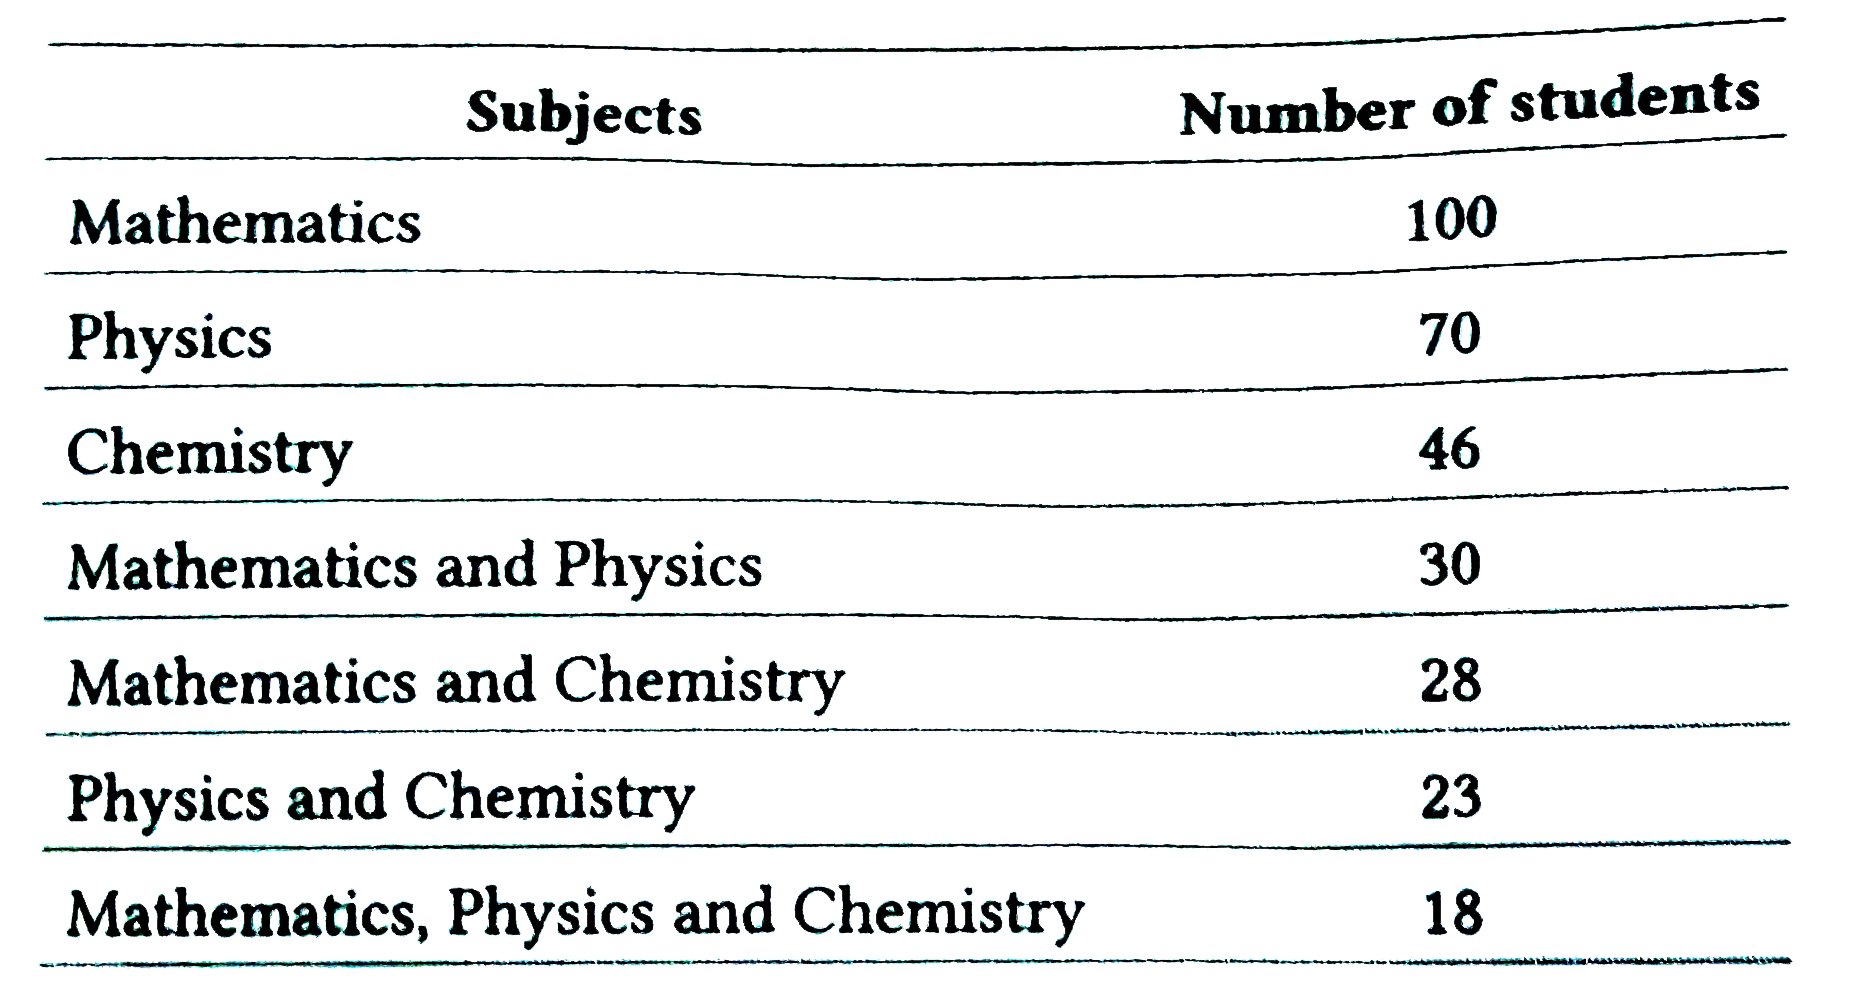
View SolutionA class has 175 students. The following table shows the number of students studying one or more of the following subjects in this case.

How many students are enrolled in Mathematics alone, Physics alone and Chemistry alone? Are there students who have not offered any one of these subjects?
View SolutionGiven below (figure) is the bar graph indicating the marks obtained out of 50 in mathematics paper by 100 students. Read the bar graph and answer the following questions: It is decided to distribute work books on mathematics to the students obtaining less then 20 marks, giving one workbook to each of such students. If a work book costs Rs.5, what sum is required to buy the work books? Every student belonging to the highest mark group is entitled to get a prize of Rs. 10. How much amount of money is required for distributing the prize money? Every student belonging to the lowest mark-group has to solve 5 problems per day. How many problems, in all, will be solved by the students of this group per day? State whether true or false. 17% students have obtained marks ranging from 40 to 49. 59 students have obtained marks ranging from 10 to 29. What is the number of students getting less than 20 marks? What is the number of students getting more than 29 marks? What is the number of students getting marks between 9 to 40? What is the number of students belonging to the highest mark group? What is the number of students obtaining more than 19 marks?
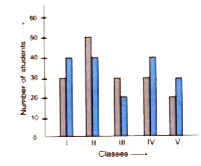
View SolutionExmine the given graph carefully.

In the graph show above represents the number of girls in a particular class and represents the number of boys in the same class.
Read and answer the following questions.
(i) Which class has the least number of students ?
(ii) Which class has maximum number of students ?
(iii) What is the ratio between the number of girls and the number of boys of class V.
View SolutionThe following bar graph (Figure) represents the heights (in cm) of 50 students of Class XI of a particular school. Study the graph and answer the following questions: What percentage of the total number of students have their heights more than 149 cm? How many students in the class are in the range of maximum height of the class? The school wants to provide a particular type of tonic to each student below the height of 150cm to improve his height. If the cost of the tonic for each student comes out to be Rs. 55, how much amount of money is required? How many students are in the range of shortest height of the class? State whether true or false: There are 9 students in the class whose heights are in the range of 155-159 cm. Maximum height (in cm) of a student in the class is 17. There are 29 students in the class whose heights are in the range of 145-154 cm. Minimum height (in cm) of a student is the class is in the range of 140-144cms. The number of students in the class having their heights less than 150cm is 12. There are 14 students each of whom has height more than 154 cm.
View Solution
