What was approximate percentage increase in the number of students in Commerce discipline from 2003 to 2004?
1 14
2 18
3 20
4 9
Answer : 4. "9"
Related Solutions
Study the following graph carefully to answer the questions that follow-----
Number of students studying Commerce in the year 2004 forms approximately what percent of the total number of students studying Commerce in all the years together ?
View SolutionThe table given below shows the number of students studying Arts, Science, Commerce and Vacancy in a college in a given 5 years. What is the percentage increase in the number of commerce students from 2012 to 2016?
View SolutionNumber of students studying Commerce from institute is what per cent of the total number of students studying all the disciplines together from this institutes?
View Solutionएक विद्यालय में एक वर्ष 10% छात्र बढ़ जाते है दूसरे वर्ष 10% छात्र घट जाते है और यह क्रम चलता रहता है, यदि वर्ष 2000 में छात्रों की संख्या में वृद्धि हुई हो तो, 2003 में छात्रों के संख्या 2000 की तुलना में वृद्धि या कमी का प्रतिशत क्या रहा ?
View Solutionनिम्न सारणी भारत से वर्ष 2000-2001 से 2005-2006 तक मिठाइयों के निर्यात की विवरण दर्शाती है।
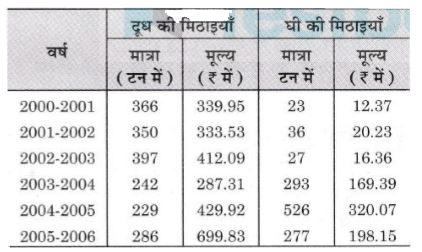
वर्ष 2002-2003 से 2003-2004 तक घी की मिठाइयों के निर्यात में कितने प्रतिशत वृद्धि हुई है?
View SolutionStudy the following graph and answer the questions given below it. What was the percentage decline in the product of salt from 2003 to 2004 ?
View SolutionStudy the following graph and answer questions What was the percentage decline in the production of salt from 2003 to 2004 ?
View SolutionThe following bar graph shows the number of students in Arts, Science and Commerce subjects in a college for the year 2004-2005 to 2007-2008. study the graph Find the approximate percentage of increase in the total number of students in the session 2007-2008 over the session 2005-2006.
View SolutionThe number of students from the discipine of Economics from college B is approximately what percentagee of the number of students from the discipline of science from the college C?
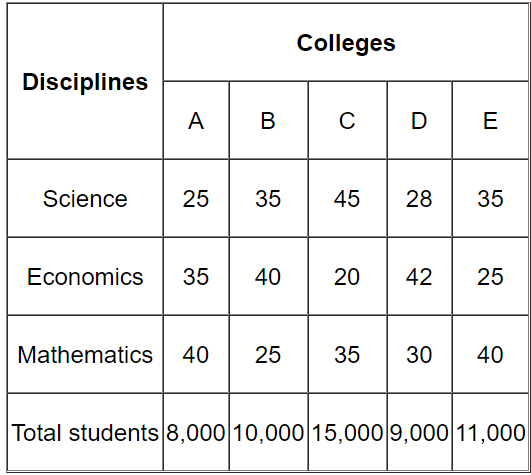
View SolutionThe following table shows the number of students studying in three subjects in five colleges. What is the ratio of the number of students of science discipline to the number of students of commerce discipline in all the five colleges together?
View SolutionThe following bar graph shows the number of students admitted and passed out per year in a college from the year 2000 to the year 2004. study the bar graph What is the percentage increase in the number of students admitted in the year 2003 as compared to the year 2001?
View Solutionनिम्नलिखित आकृति मे किसी कॉलेज में वर्ष 2000 से वर्ष 2004 तक प्रति वर्ष भर्ती हूए और उत्तीर्ण हूए छात्रों की संख्या ( हजार में ) दर्शायी गई है। आकृति का अध्ययन कर प्रश्नों उत्तर दिजिए ?
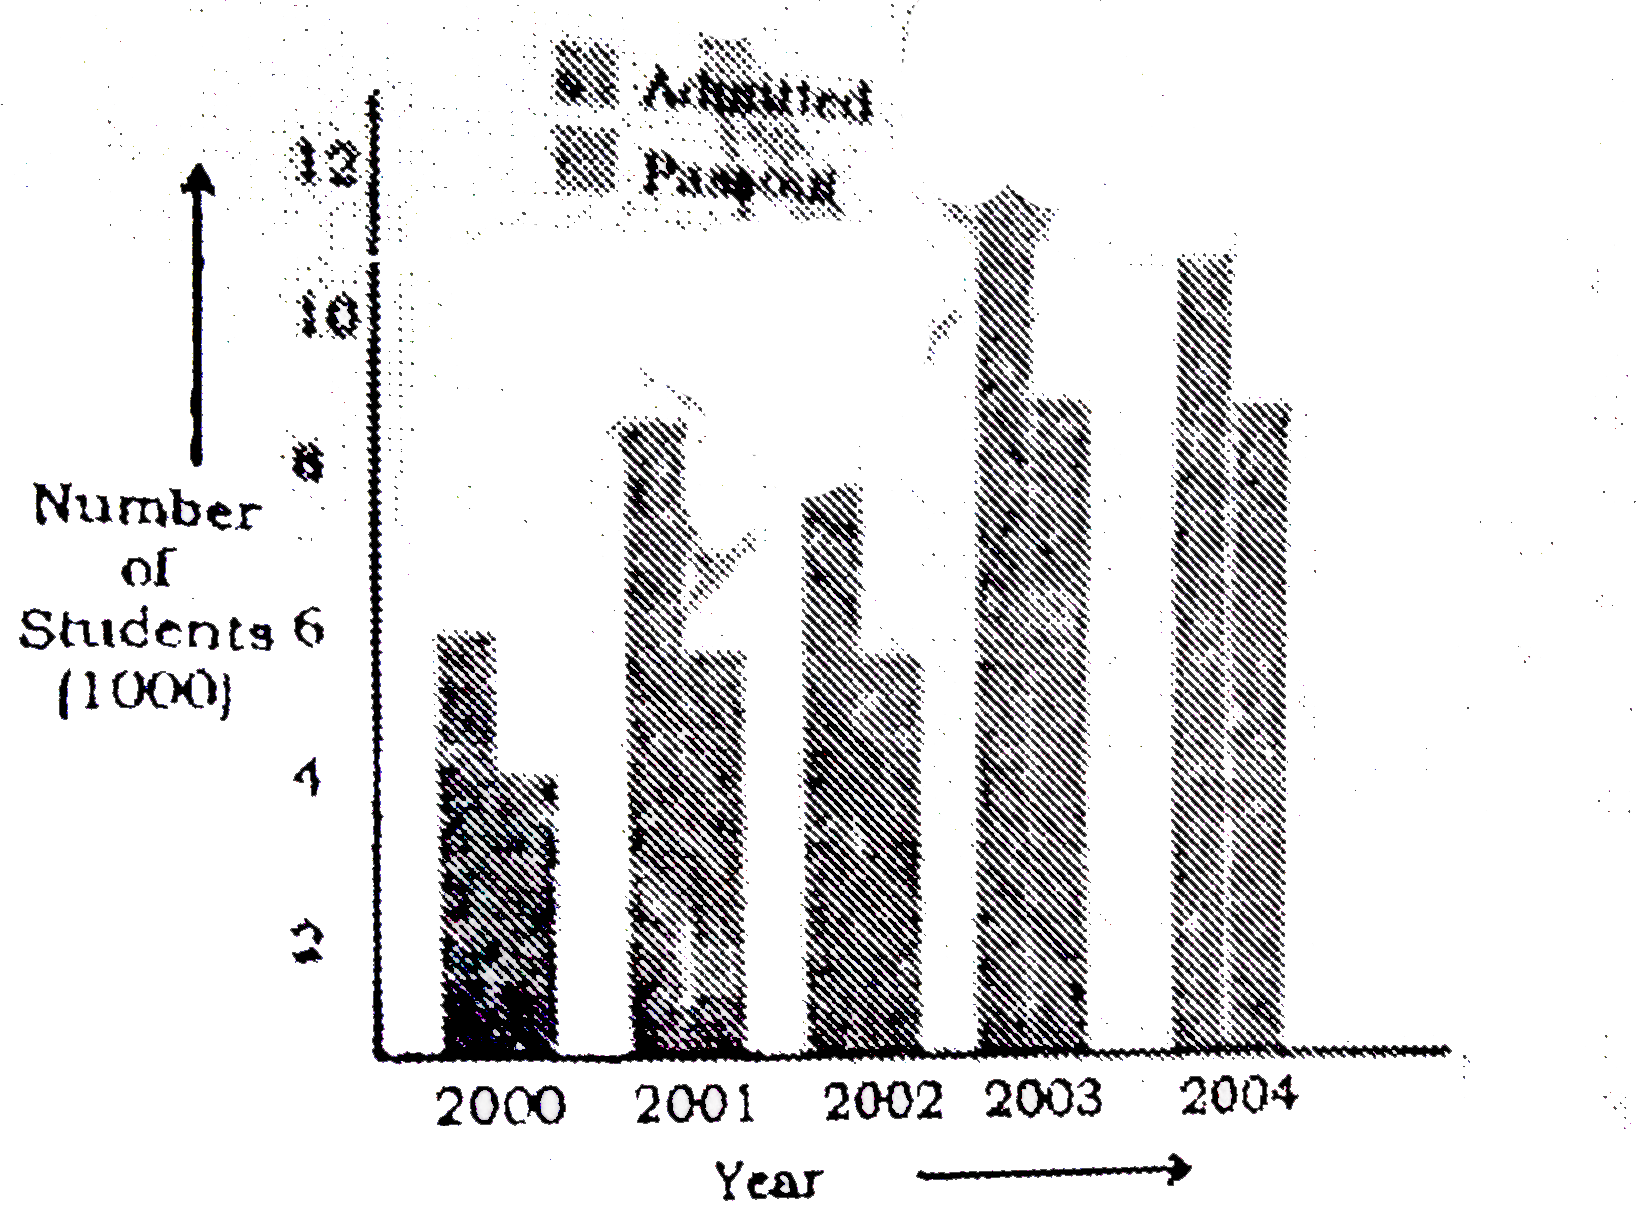
वर्ष 2001 की तुलना में वर्ष 2003 में भर्ती हूए छात्रों की संख्या में हूई प्रतिशत वृदिध कितनी है ?
View SolutionA table below shows the production and imports of circle oil (in '000 tonnes). Domestic production of crude oil is total of on-share and off-shore production, which is supplemented by imports to meet the total demand of crude oil in the country.

What was the approx-percentage increase in imports of crude oil from 2001 to 2003 :
View SolutionThe following table indicates the number of students studying in three disciplines in five colleges:
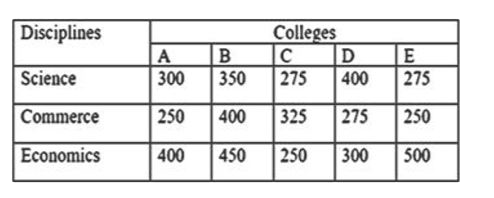
What percentage of total students are studying in the commerce stream in all five colleges together?
View SolutionShown below is the multiple bar diagram depicting then changes in the roll strength of a college infour facilities from 2001-02 to 2003-04.
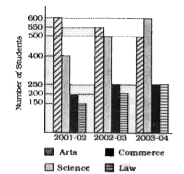
The percentage of students in Law faculty in 2003 - 2004 is
View SolutionNumber of students appeared (A) and passed (Q) in different subjects in an examination What is the percentage increase in the number of students passed in 'Commerce' from the year 1999 to 2000 (Q)?
View Solution
What approximate percentage of candidates qualified for the post of A in the year 2003 ?
View SolutionThe number of students of semi-discipline of college B is approximately what percent of the number of students of science subject of college C?
View Solutionनिम्नलिखित बार ग्राफ में वर्ष 2004-2005 से 2007-2008 तक के सत्र में किसी कॉलेज में विद्यार्थियों की कला,विज्ञान और वाणिज्य विषयों में दर्शायी गई है। ग्राफ का अध्ययन कीजिए
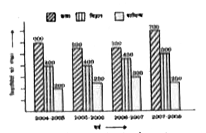
विज्ञान में विद्यार्थियों की औसत संख्या का वाण्जिय विषय में विद्यार्थियों की औसत संख्या में अनुपात ज्ञात कीजिए।
View SolutionThe following bar graph shows the number of students in Arts, Science and Commerce subjects in a college for the year 2004-2005 to 2007-2008. study the graph Find the ratio of the average number of students in Science to the average number of students in Commerce.
View Solution