The total expenses of the family on transport is equal to those spent on:
1 savings
2 clothing
3 food
4 others
Answer : 3. "food "
Related Solutions
The bar graph given below shows the spending of a family income on various items and savings during 1993. Observe the graph and answer the following questions :
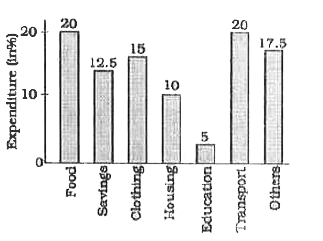
The total expenses of the family on transport are equal to those spent on :
View SolutionThe pie chart given below shows the monthly expenses on various heads of a family . The total expenditure of the family is Rs 30000. What is the amount (in Rs) spent on food ?
View SolutionThe following pie chart shows the distribution of expenses (in degrees) of a family during 2016. Total income of the family in 2016 = Rs. 1080000
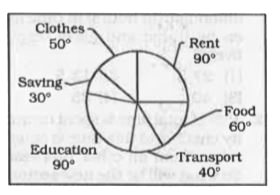
What will be the average (in Rs.) of total income spent by the family on Education, Savings and Rent?
View SolutionThe pie chart given below shows the monthly expenses on various heads of a family . The total expenditure of the family is Rs 30000. Amount spent on fuel is what percent of amount spent on food ?
View SolutionA part of monthly expenses of a family is constant and the remaining vary with the number of members in the family. For a family of 4 persons, the total monthly expenses are < 10,400, whereas for a family of 7 persons, the total monthly expenses are 15,800. Find the constant expenses per month and the monthly expenses on each member of a family.
View SolutionThe total expenses of a birthday party of 30 boys were Rs. 15,000. All shared the expenses equally. How much money was spent by each boy in the party?
View SolutionThe pie chart given below shows the monthly expenses on various heads of a family . The total expenditure of the family is Rs 30000. What is the total amount (in Rs) spent on fuel and education ?
View SolutionThe following pie chart shows the distribution of expenses (in degrees) of a family during 2016. Total income of the family in 2016 = Rs. 1080000
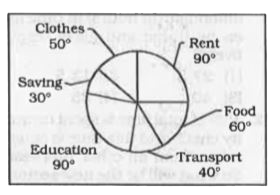
What is the total expenditure (in Rs.) on Rent, Food and Transport together?
View SolutionThe pie chart, given here shows monthly expenses on various heads and savings of the family of Mr. Rao. Study the chart and answer the questions based on it.
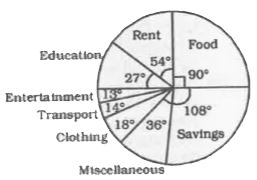
The amount spent on food exceeds the total amount spent on education and clothing by
View SolutionThe pie chart, given here shows monthly expenses on various heads and savings of the family of Mr. Rao. Study the chart and answer the questions based on it. The amount spent on food exceeds the total amount spent on education and clothing by
View Solutionदिया गया पाई आरेख, एक महीने में किसी परिवार के व्यय का डिग्री-वार विवरण दर्शाता है। परिवार की कुल आय ₹43200 है।
विभिन्न व्यय में व्यय की गई राशि की डिग्री (कुल Rs43,200)
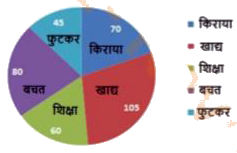
खादय पर खर्च की गई राशि, बचत और फुटकर व्ययों का कितना प्रतिशत है?
View SolutionIf the rate of profit is 6%, then find the selling price of the following : A mower purchased for ₹ 1150 on which ₹ 50 is spent as transportation expense.
View SolutionThe pie chart given below shows the monthly expenses on various heads of a family . The total expenditure of the family is Rs 30000. What is the difference (in Rs) between the amount spent on entertainment and clothing ?
View SolutionThe expenses on rice, fish and oil of a family are in the ratio 12 : 17 : 3. The prices of these articles are increased by 20%, 30% and 50% respectively. The total expenses of family on these articles are increased by b. c. d.
View Solutionstudy the following diagram What part of the total expenditure in family A is spent on education?
View SolutionThe total amount spent on the Five commodities in a month by the family in the year 2019 is:
View SolutionThe following circle chart shows the annual expenditure incurred by a family on various heads and the percentage of its savings. The total amount spent on house plan and transport is approximately what percent of the total amount on savings and mixed items?
View SolutionA household spend 20 per cent of their monthly food expenses on fruits. If the monthly food expense of the family is Rs 7500, answer the following questions on the basis of pie chart showing the share of expenses on different fruits in a particular month.
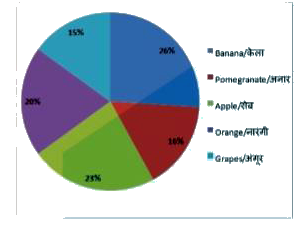
The amount spent on Pomegranate is how much less than spent on Orange?
View SolutionThe pie chart given below gives the expenses in % on various items along with the savings of a family. Find the : Minimum and maximum expenses made on which area? Which expense/expenses are equal to the saving of the family? If the monthly savings is Rs. 4,500, find the expenses made on clothes.
View SolutionThe Expenditure of a family in a month is represented by a Pie-chart. Read it carefully to answer the questions.
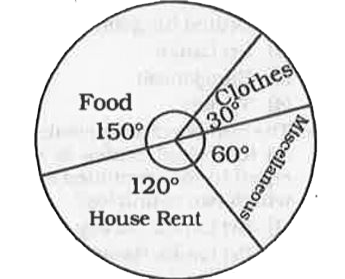
If the total amount spent is Rs. 7,200, find the amount spent on food :
View Solution