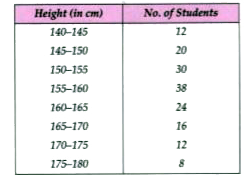
The following distribution represents the height of 160 students of a school.Height in cmNo. of Students140-14512145-15020150-15530155-16038160-16524165-17016170-17512175-1808Draw an ogive for the given distribution taking 2 cm = 5 cm of height on one axis and 2 cm = 20 students on the other axis. Using the graph determine : i The median height. ii The interquartile range. iii The number of students whose height is above 172 cm.
We have to plot 145 12 150 32 155 62 160 100 165 124 170 140 175 152 and 180 160.Now we shall construct a horizontal line at cumulative frequency = 80 Intersecting the Ogive at 157.5 80 Hence median height = 157.5 cmiii The no. of students whose height is above 172 cm= 160 -144 = 16
Related Solutions
The following distribution represents the height of 160 students of a school.

Draw an ogive for the given distribution taking 2 cm = 5 cm of height on one axis and 2 cm = 20 cm students on the other axis. Using the graph, determine.
(i) The median height.
View SolutionThe following data give the distribution of heights of students :
The median of the distribution is
View SolutionThe following data gives the distribution of height of students :
The median of the distribution is
View SolutionThe following data give the distribution of heights of students :
The median of the distribution is
View SolutionThe following data give the distribution of heights of students :
The median of the distribution is
View SolutionThe following data gives the distribution of height of students :
The median of the distribution is
View SolutionThe following data give the distribution of heights of students :
The median of the distribution is
View SolutionThe following table shows the distribution of the heights of a group of students:

Use a graph sheet to draw an Ogive for the distribution. Use the Ogive to find:
the number of students whose height is more than 168 cm
View SolutionThe following table shows the distribution of the heights of a group of students:

Use a graph sheet to draw an Ogive for the distribution. Use the Ogive to find:
the number of students whose height is less than 148 cm.
View SolutionThe heights (in cm) of 35 students of a class are given below :
Find the median height.
View SolutionMarks obtained by 200 students in an examination are given below :

Draw an ogive for the given distribution taking 2 cm = 10 marks on one axis and 2 cm = 20 students on the other axis. Using the graph, determine :
(ii) The number of students who failed if minimum marks required to pass is 40.
View SolutionThe heights of students are given in cm as 161, 190, 185, 163, 172, 180, 162. The median height of the student is:
View SolutionThe heights (in cm) of students in a group are given below: What is the median height of students ?
View SolutionMarks obtained by 200 students in an examination are given below :

Draw an ogive for the given distribution taking 2 cm = 10 marks on one axis and 2 cm = 20 students on the other axis. Using the graph, determine :
(i) The median marks
View SolutionThere are 20 students in a class of them, the height of ten students is 150 cm each, the height of 6 students is 142 cm each and the height of 4 students is 132 cm each. Find the average height of all the students.
View Solutionविद्यार्थियों की ऊंचाई सेमी में इस प्रकार है:
उनकी माध्यिका ऊंचाई ज्ञात कीजिए।
View SolutionThe frequency distribution of the heights (in cm) of 100 students of class X in a school .Find the average height of the students .

View SolutionThere are 20 students with an average height of 125 cm in a class. 5 students with an average height of 116 cm leave the class. What is average height of the class now?
View SolutionThe given histogram shows the height of the students. The difference between the number of students whose height is between 150-155 cm and the students whose height lies between 175-180 cm is :
View Solution