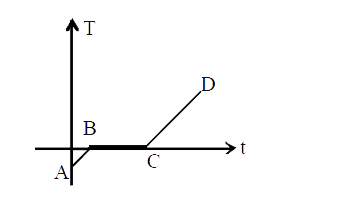
A piece of ice is heated at a constant rate. The variation of temperature with heat input is shown in the graph below:i What are represented by AB and CD? ii What conclusion can you draw regarding the 110°c nature of ice from the above graph?
i AB part of the graph represents time in t seconds taken by ice at 0°C to convert into water at 0°C. CD part of the graph represents time in seconds taken by water at 100°C to convert into steam at 100°C.ii From the graph we conclude that ice takes less time in heating from -10°C to 0°C. But in the process of melting it takes comparatively longer time. It shows that ice has a high specific latent heat of fusion.
Related Solutions
A piece of ice is heated at a constant rate. The variation in temperature with time of heating is shown in the graph in Fig. 11.6.
(i) What is represented by the part AB ?
(ii) What does the part CD represent ?
(iii) What conclusion do you draw regarding the nature of ice from the graph ?
View SolutionHeat is supplied to a ice at a constant rate Temperature variation with time is as shown in figure. Then –
View SolutionWater is heated in an open vessel. Draw the heat temperature graph of ice below heated up to the steam above .
View Solution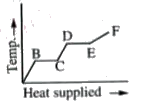
A source of heat supplies heat at a constant rate to solid cube. The variation of temperature of the . cube with heat supplied is shown
The portion DE of graph represents conversion of:
View SolutionDraw a V-I graph for a conductor at two different temperatures. What conclusion do you draw from your graph for the variation of resistance of the conductor with temperature ?
View Solution1 kg of ice at C is heated at a constant rate and its temperature is recorded after every 30 s till steam is formed at C. Draw a temperature-time graph to represent the change of phases.
View Solution(1) Take a few pieces of ice in a glass beaker as shown in figure. (2) Insert the bulb of a thermometer in ice and measure its temperature. (3) Put the beaker on a stand and heat the ice usinga burner. (4) Record the temperature using the thermometer after every minute. (5) As the ice is heated,it starts melting. Stir the mixture of ice and water. (6) Continue the heating even after ice starts melting. (7) Draw a graph of temperature versus time. Explain the following temperature vs time graph.
View Solutionपर स्थित बर्फ के एक टुकड़े को धीरे धीरे गर्म करके ताप वाली भाप में रूपांतरित कर दिया जाता है। निम्न में से कौन सा ग्राफ गुणात्मक रूप से घटना को प्रदर्शित करता है।
View SolutionA piece of ice at is heated at a constant rate and its temperature recorded at regular intervals till steam is formed at . Draw a temperature-time graph to represent the change in phase. Label the different parts of your graph.
View SolutionA solid material is supplied with heat at a constant rate. The temperature of the material is changing with the heat input as shown in the graph in figure. Study the graph carefully and answer the following questions: (i) What do the horizontal regions AB and CD represent? (ii) If CD is equal to 2AB, what do you infer? (iii) What does the slope of DE represents? (iv) The slope of OAgtthe slope of BC . What does this indicate?
View SolutionA certain mass of ice at is converted to steam at by constant heating, Draw temperature-time graph showing the change in phases.
View SolutionA certain mass of ice at is converted to steam at by constant heating, Draw temperature-time graph showing the change in phases.
View SolutionThe above graph represents temperature versus heat for water at 1 atm. Pressure. The slopes of AB and CD are different. Why ?
View Solution(1) Take a few pieces of ice in a glass beaker as shown in figure. (2) Insert the bulb of a thermometer in ice and measure its temperature. (3) Put the beaker on a stand and heat the ice using a burner. (4) Record the temperature using the thermometer after every minute. (5) As the ice is heated,it starts melting. Stir the mixture of ice and water. (6) Continue the heating even after ice starts melting. (7) Draw a graph of temperature versus time. Define boiling point of a liquid. OR What is boiling point of a liquid ?
View Solutionबर्फ के एक टुकड़े को दी गई ऊष्मा तथा ताप में वृद्धि का सही वक्र कौन-सा है?
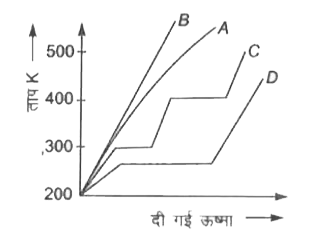
View SolutionA source of heat supplies heat at a constant rate to solid cube. The variation of temperature of the . cube with heat supplied is shown The reciprocal of the slope of the portion EF of the graph shown in figure represents:
View Solution(1) Take a few pieces of ice in a glass beaker as shown in figure.
(2) Insert the bulb of a thermometer in ice and measure its temperature.
(3) Put the beaker on a stand and heat the ice using a burner.
(4) Record the temperature using the thermometer after every minute.
(5) As the ice is heated,it starts melting. Stir the mixture of ice and water.
(6) Continue the heating even after ice starts melting.
(7) Draw a graph of temperature versus time.
Explain the role of latent heat in the change of state of a substance.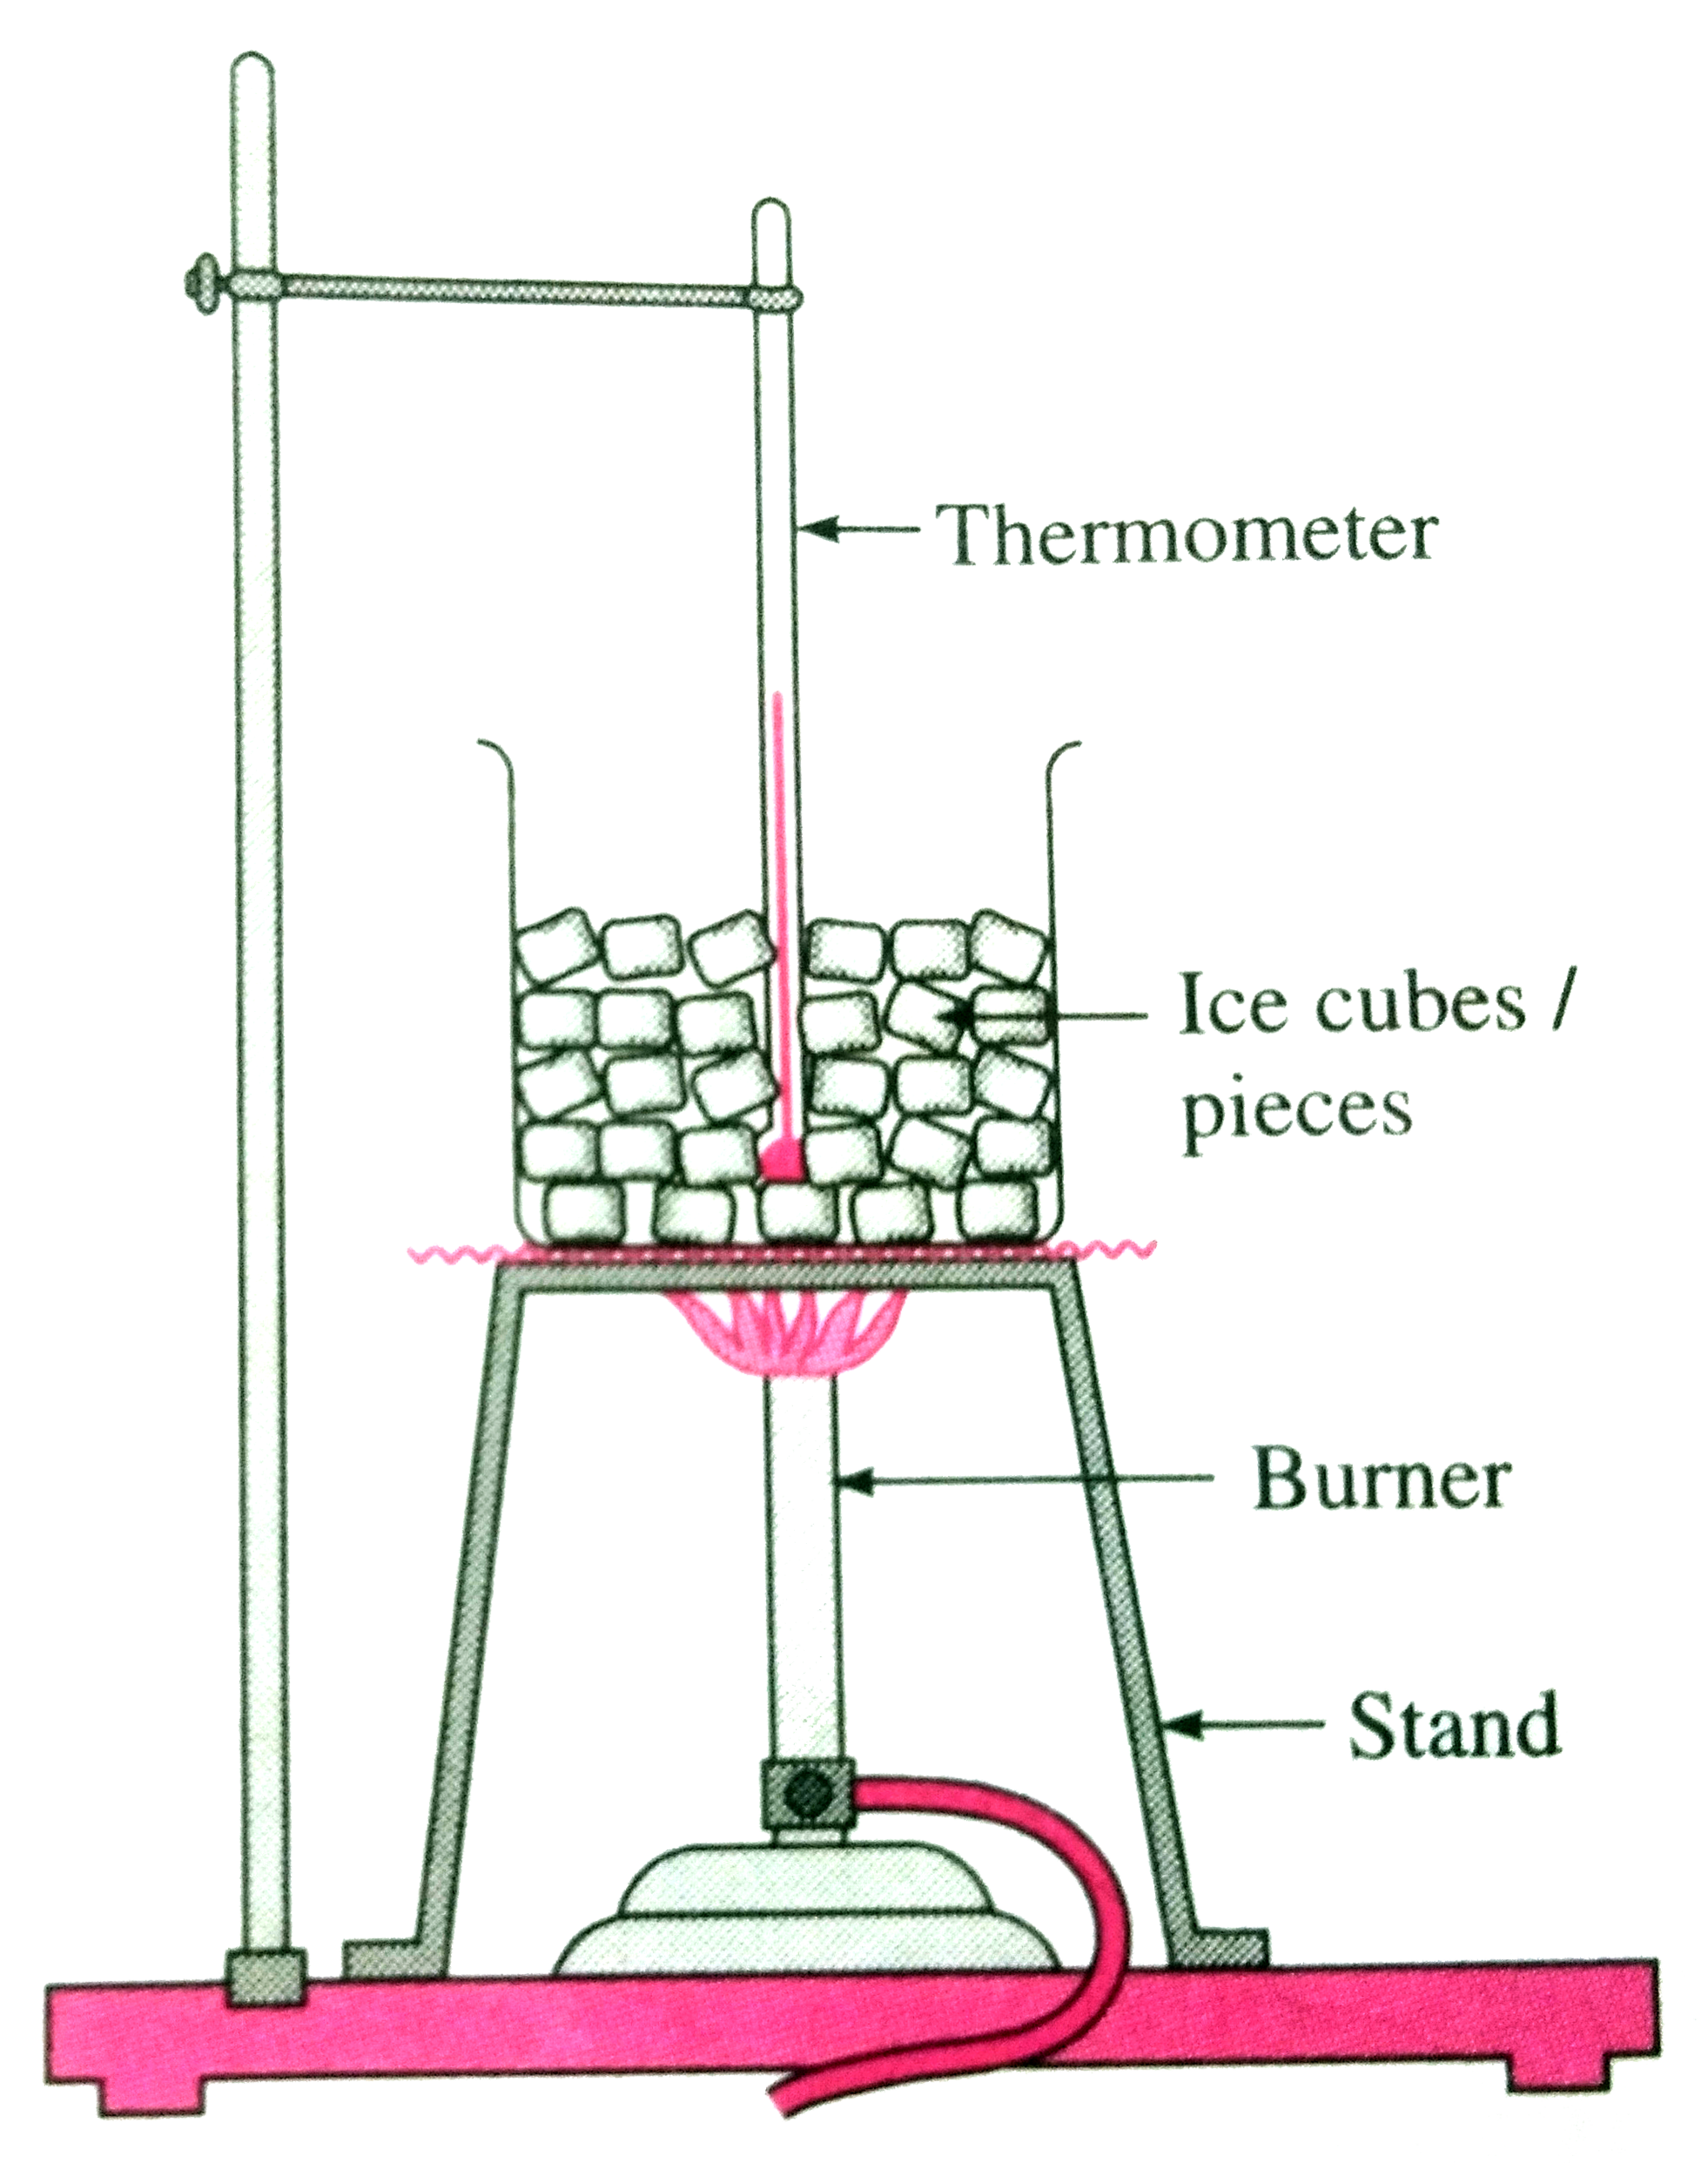
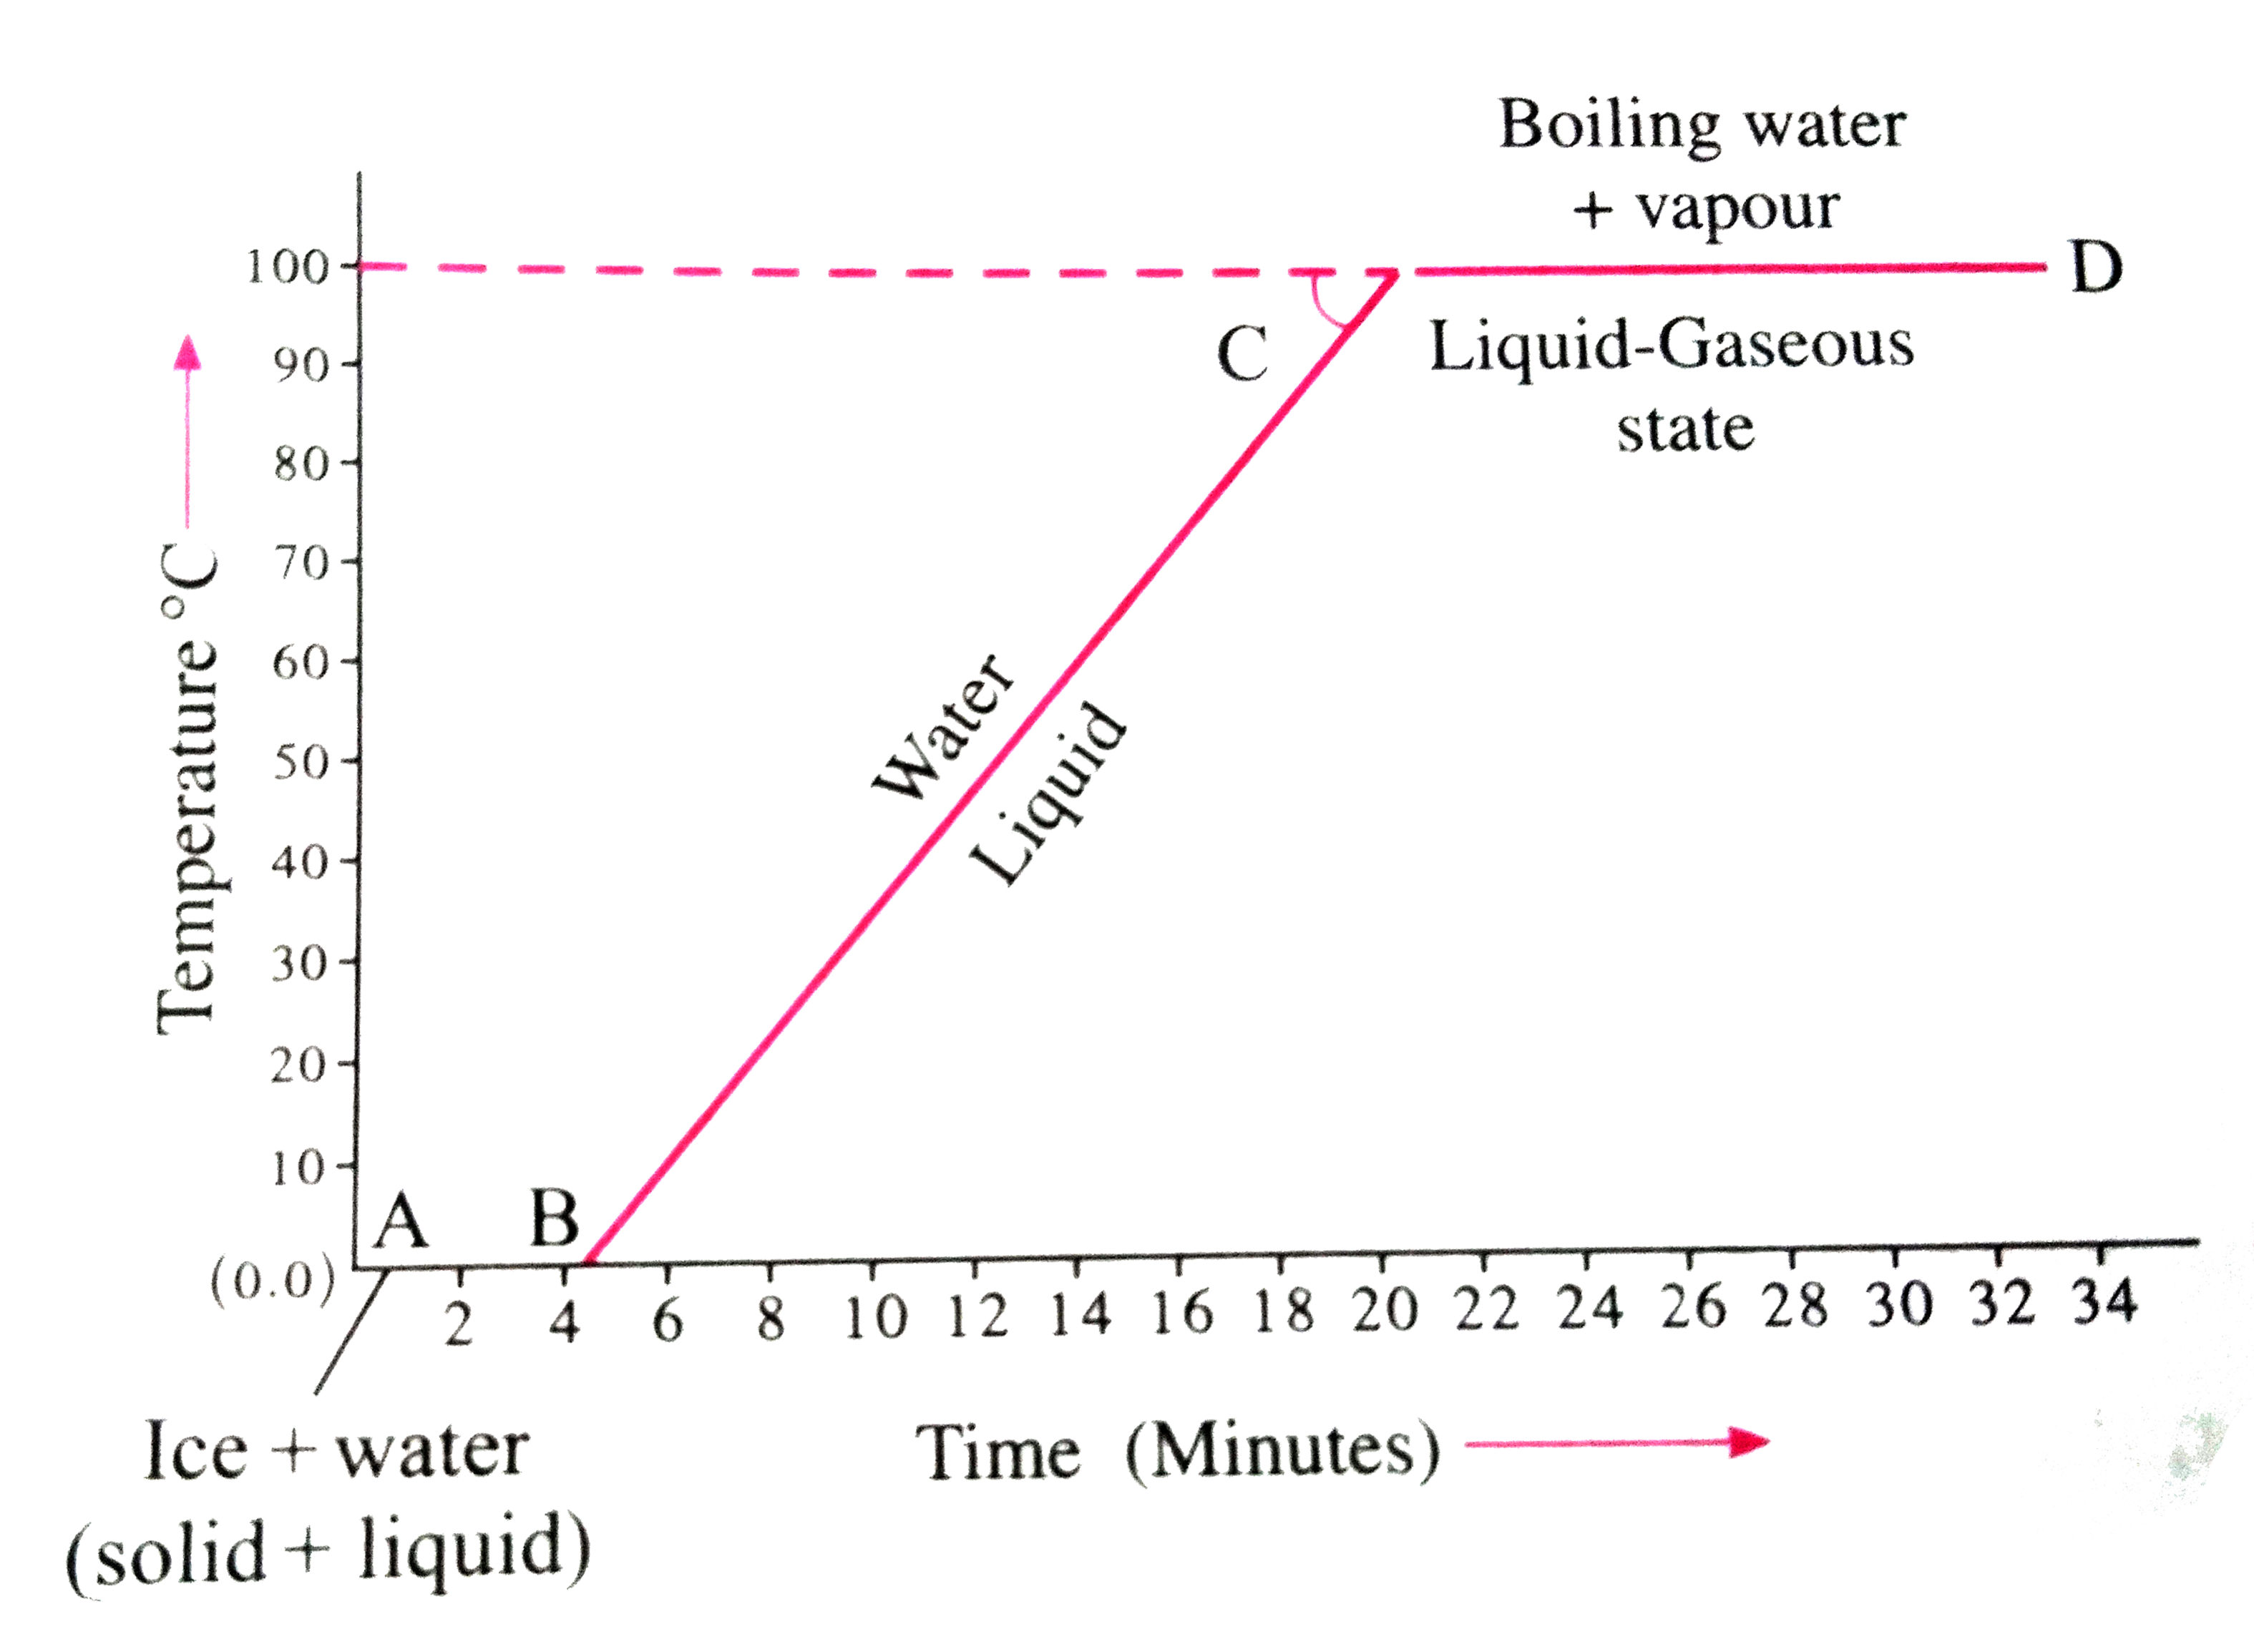
View Solution(1) Take a few pieces of ice in a glass beaker as shown in figure.
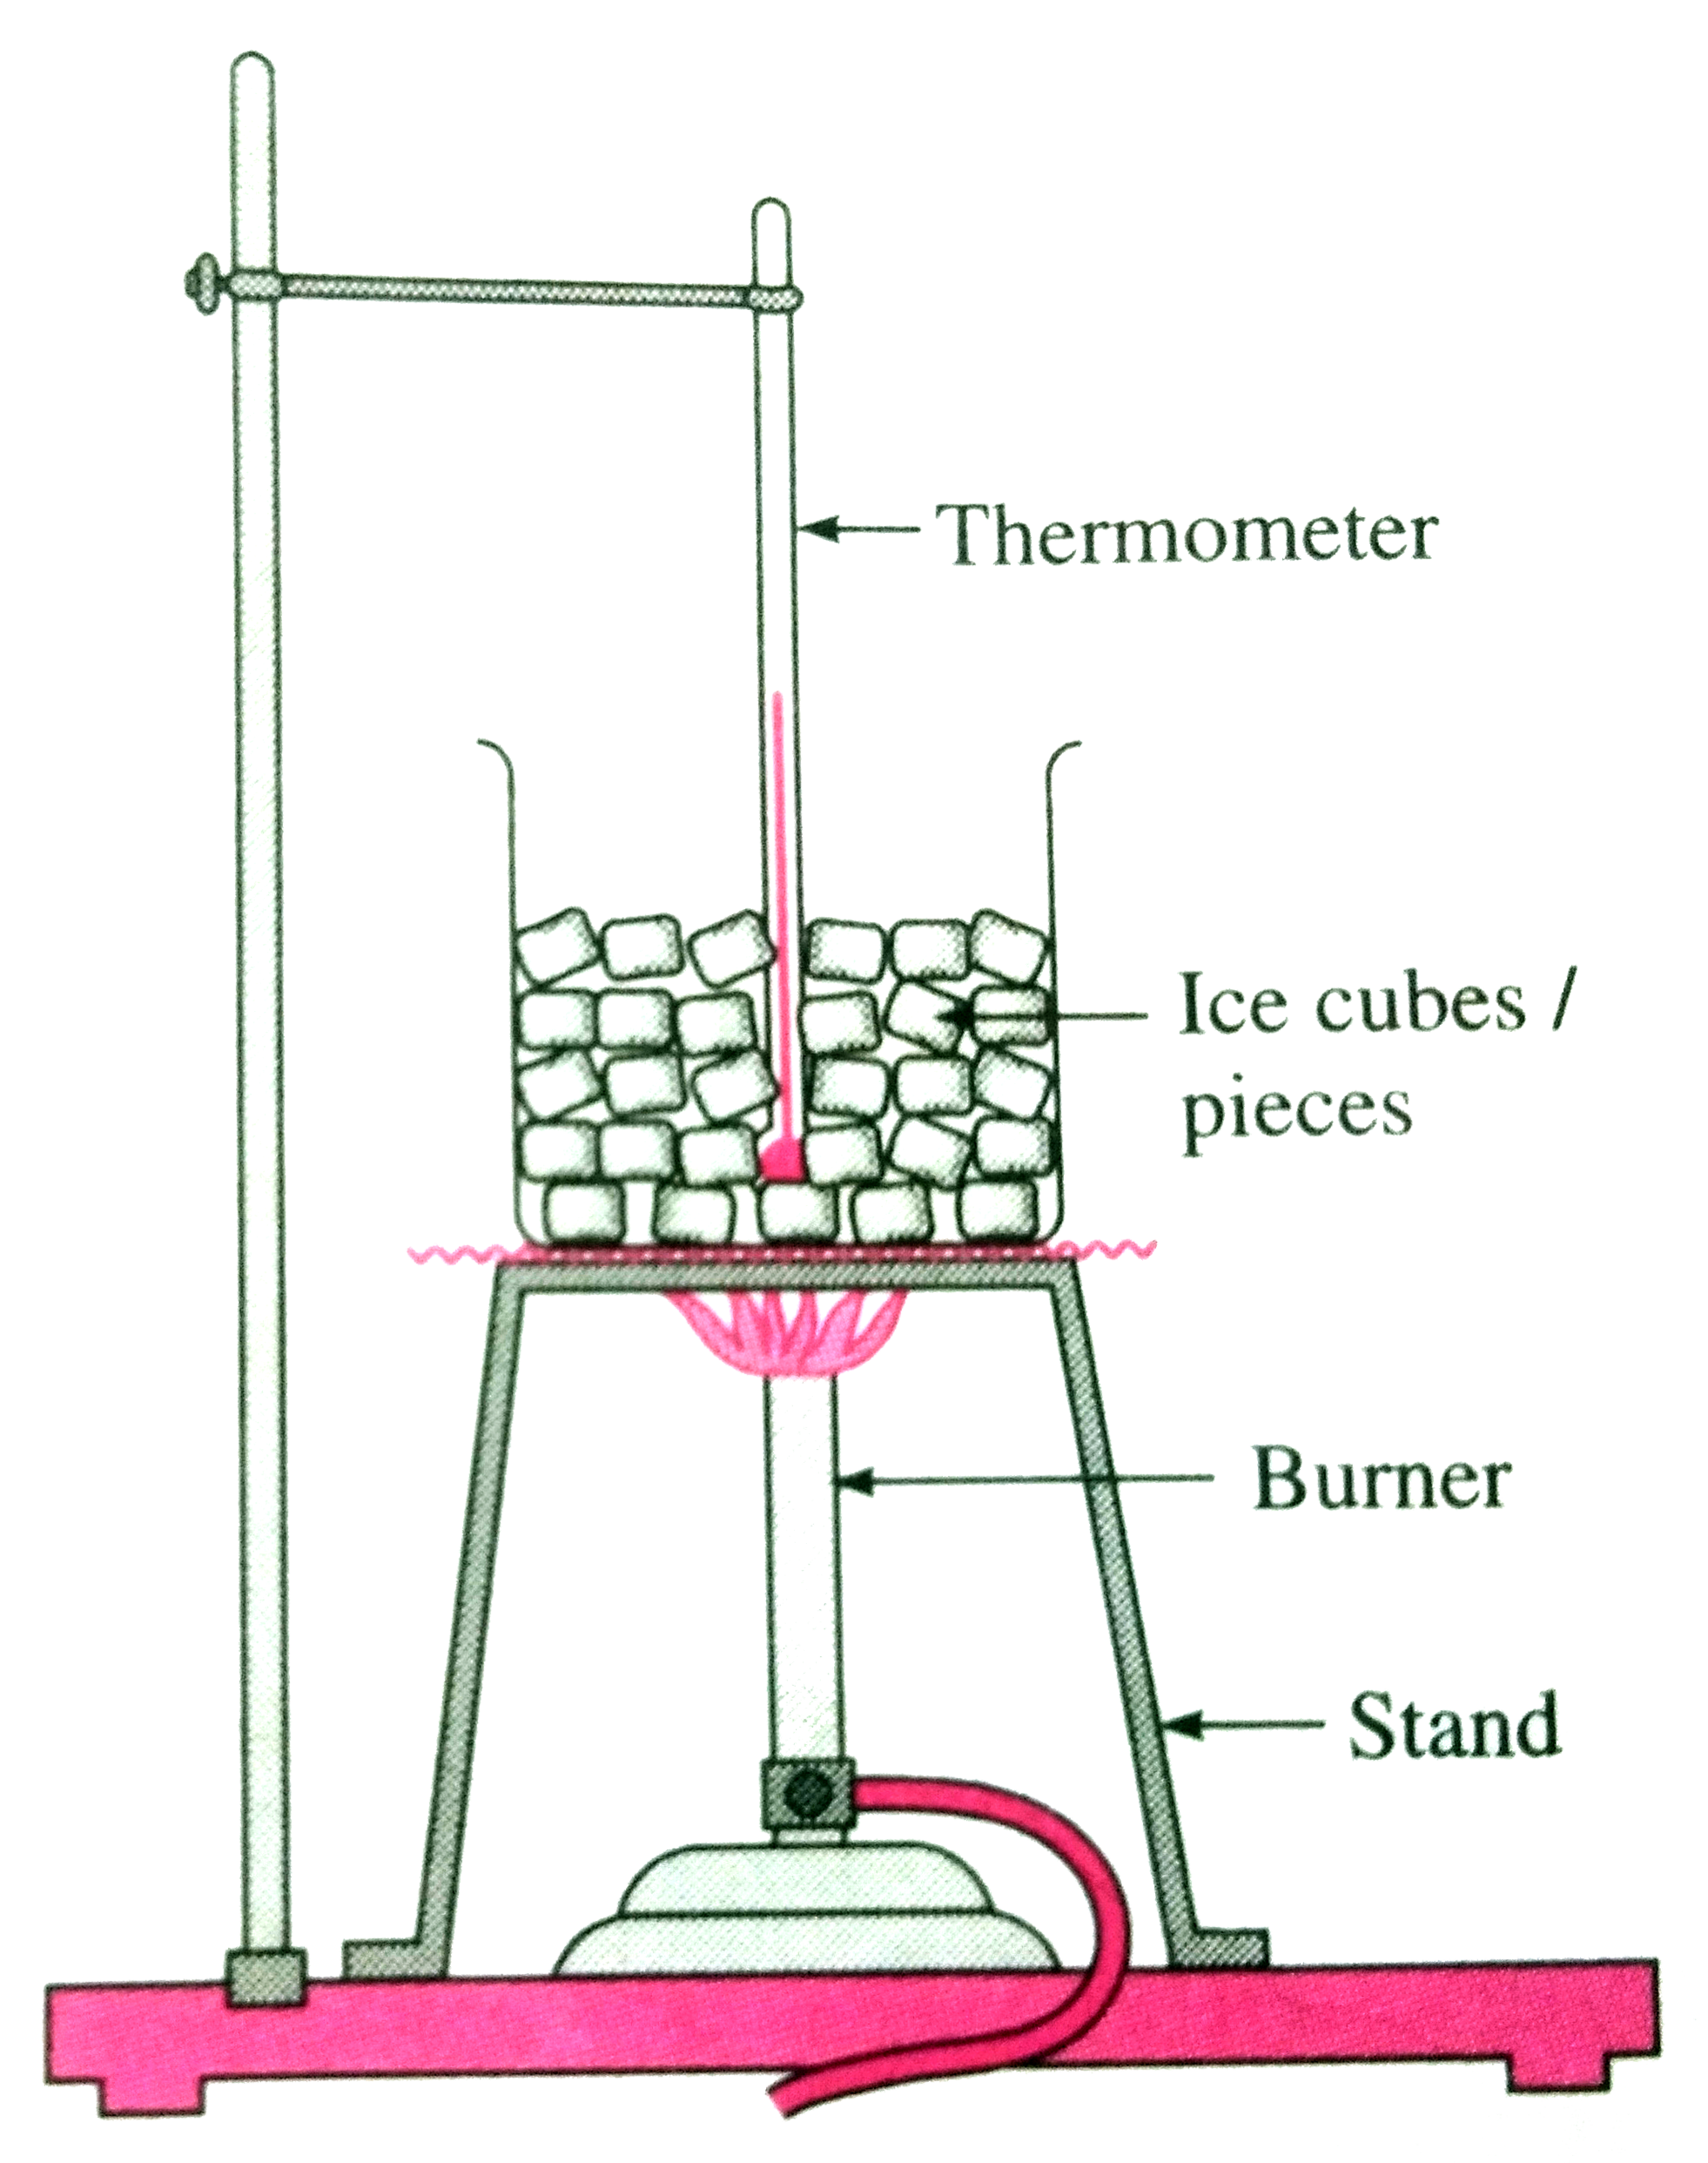
(2) Insert the bulb of a thermometer in ice and measure its temperature.
(3) Put the beaker on a stand and heat the ice using a burner.
(4) Record the temperature using the thermometer after every minute.
(5) As the ice is heated,it starts melting. Stir the mixture of ice and water.
(6) Continue the heating even after ice starts melting.
(7) Draw a graph of temperature versus time.
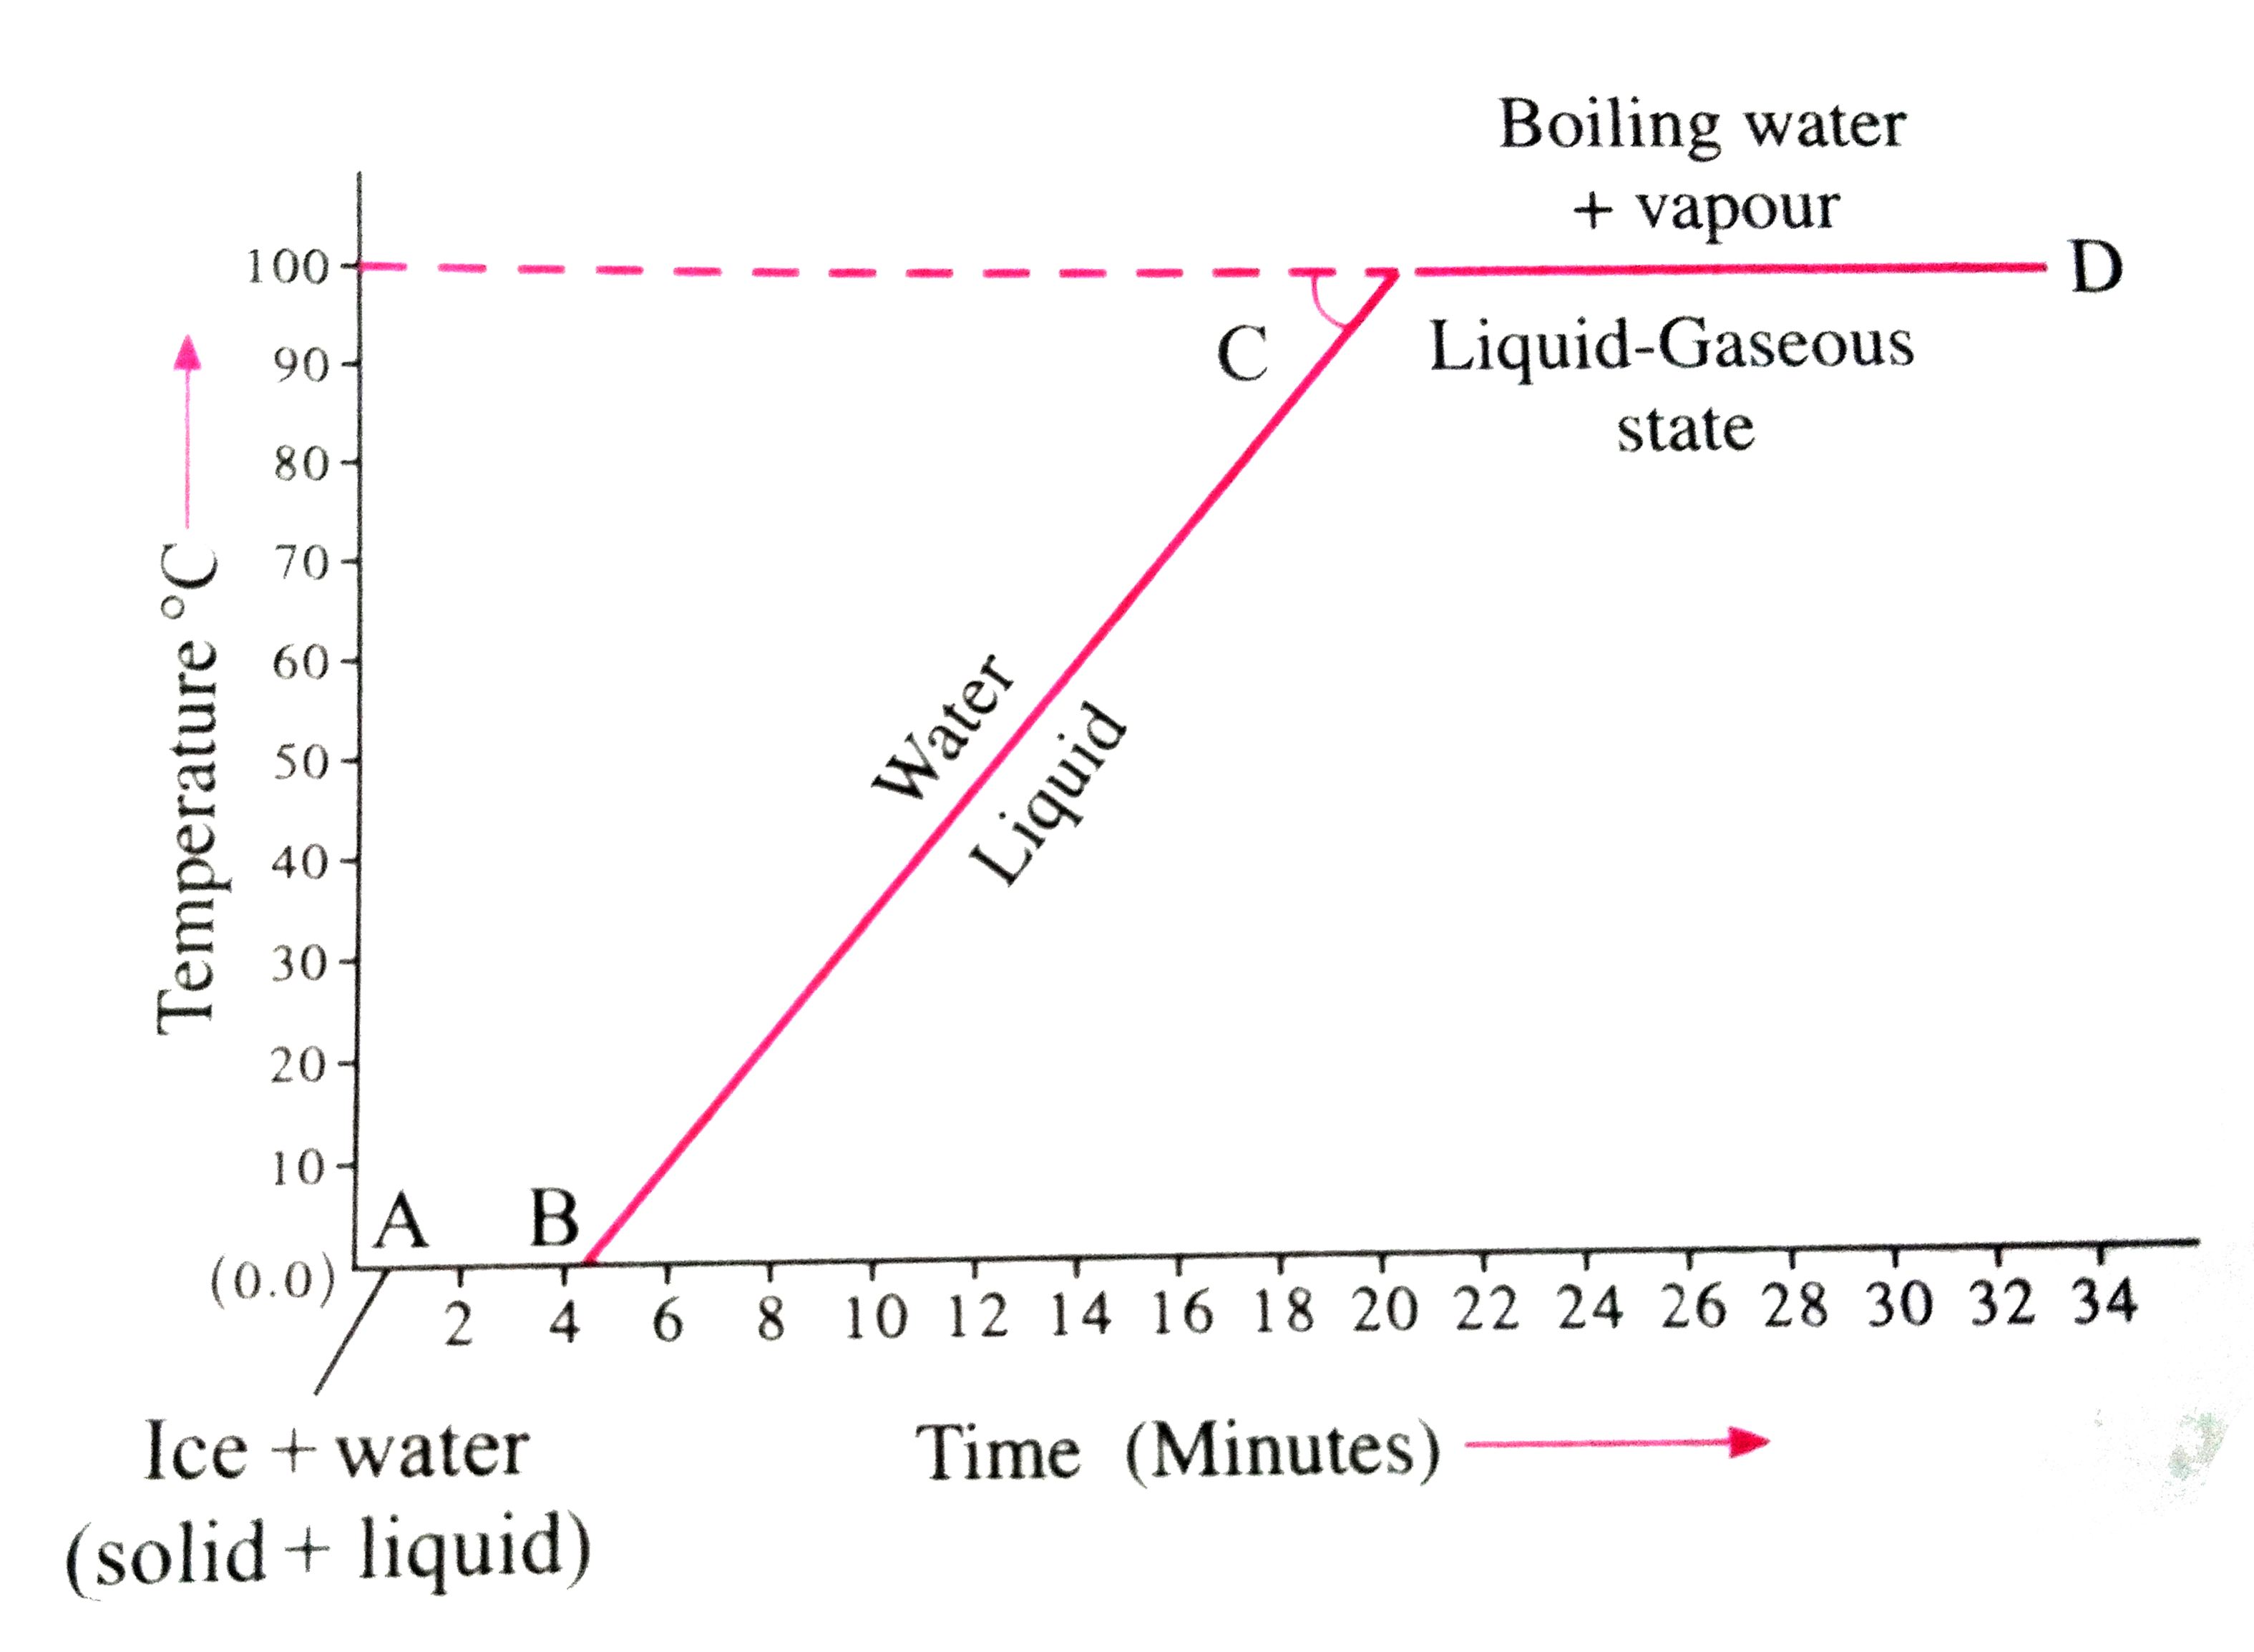
Explain the term latent heat of vaporization.
View SolutionA solid material is supplied with heat at a constant rate. The temperature of the material is changing with the heat input as shown in the graph in figure. Study the graph carefully and answer the following questions:
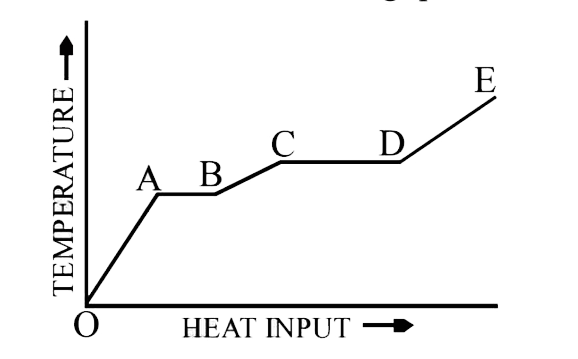
(i) What do the horizontal regions AB and CD represent?
If CD is equal to 2AB, what do you infer?
What does the slope of DE represents?
The slope of OAgtthe slope of BC. What does this indicate?
View SolutionTake 2kg of ice is at - 5^@ C. Supply heat is continuously to ice. Till it starts boiling. Note the temperature every minute. Draw a graph between temperature and time using the values you get. What do you understand from the graph. Write the conclusions. ( You know that ice melts at 0^@ c and boils at l00^@C
View Solution