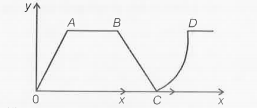
The above graph represents temperature versus heat for water at 1 atm. Pressure. The slopes of AB and CD are different. Why ?
Text Solution
Because the specific heat capacity of water is greater than that of ice.
|
Similar Questions
Knowledge Check
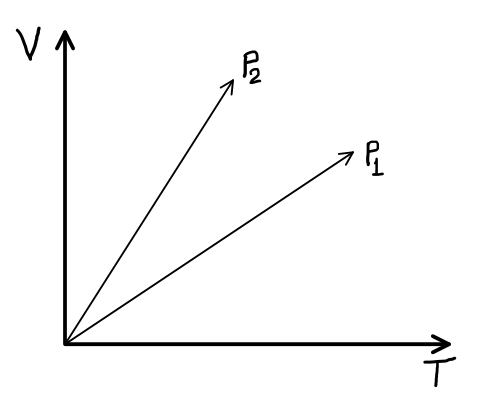
Figure shows the volume versus temperature graph for the same mass of a gas (assumed ideal) corresponding to two different pressure P1andP2. Then
AP1>P2BP1<P2CP1=P2DThe information is insufficientIdentify the graph which correctly represents the spectral intensity versus wavelength graph at two temperatures T and T (T≤T)
A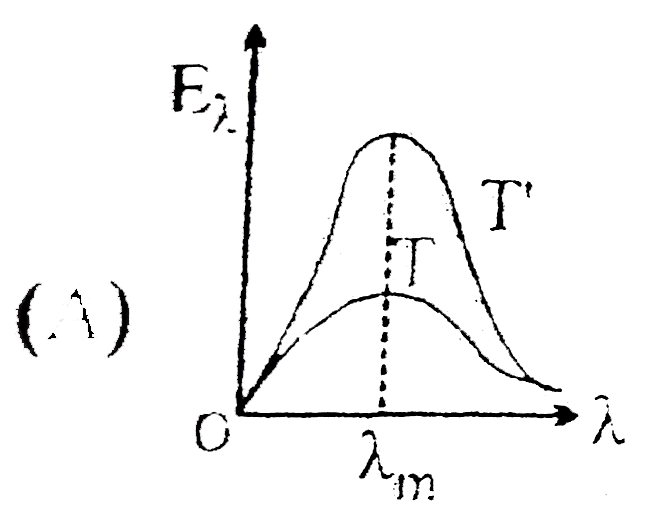 B
B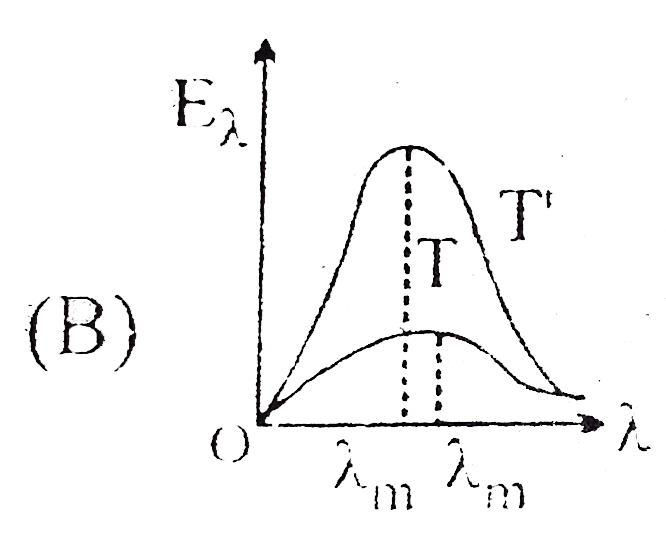 C
C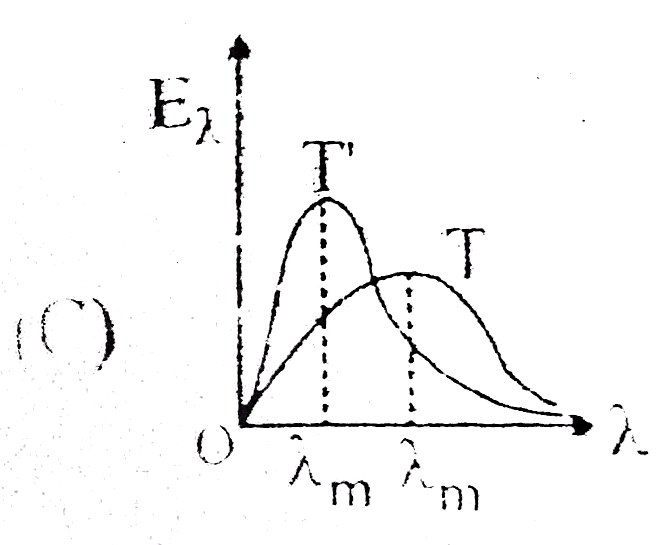 Dnone of these
Two moles of a diatomic gas are carried trhough the cycle ABCDA as shown in figure. The segment AB represents an isothermal expansion, the segment BC an adiabatic expansion. The pressure and temperature at A are 5 atm and 600K respectively. The volume at B is twice that at A. The pressure at D is 1 atm.
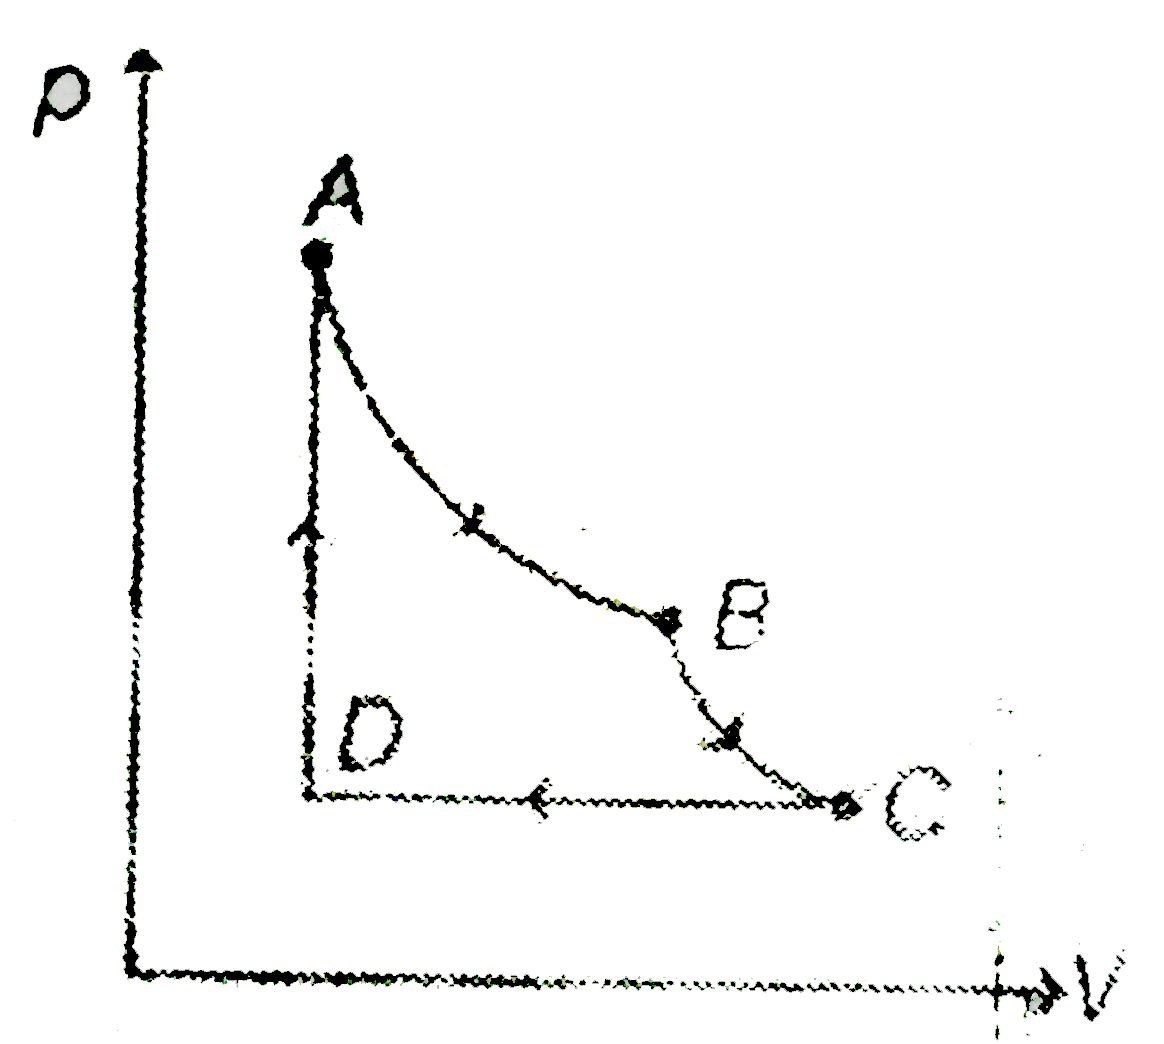
Find the T versus V graph of the above cyclic process.A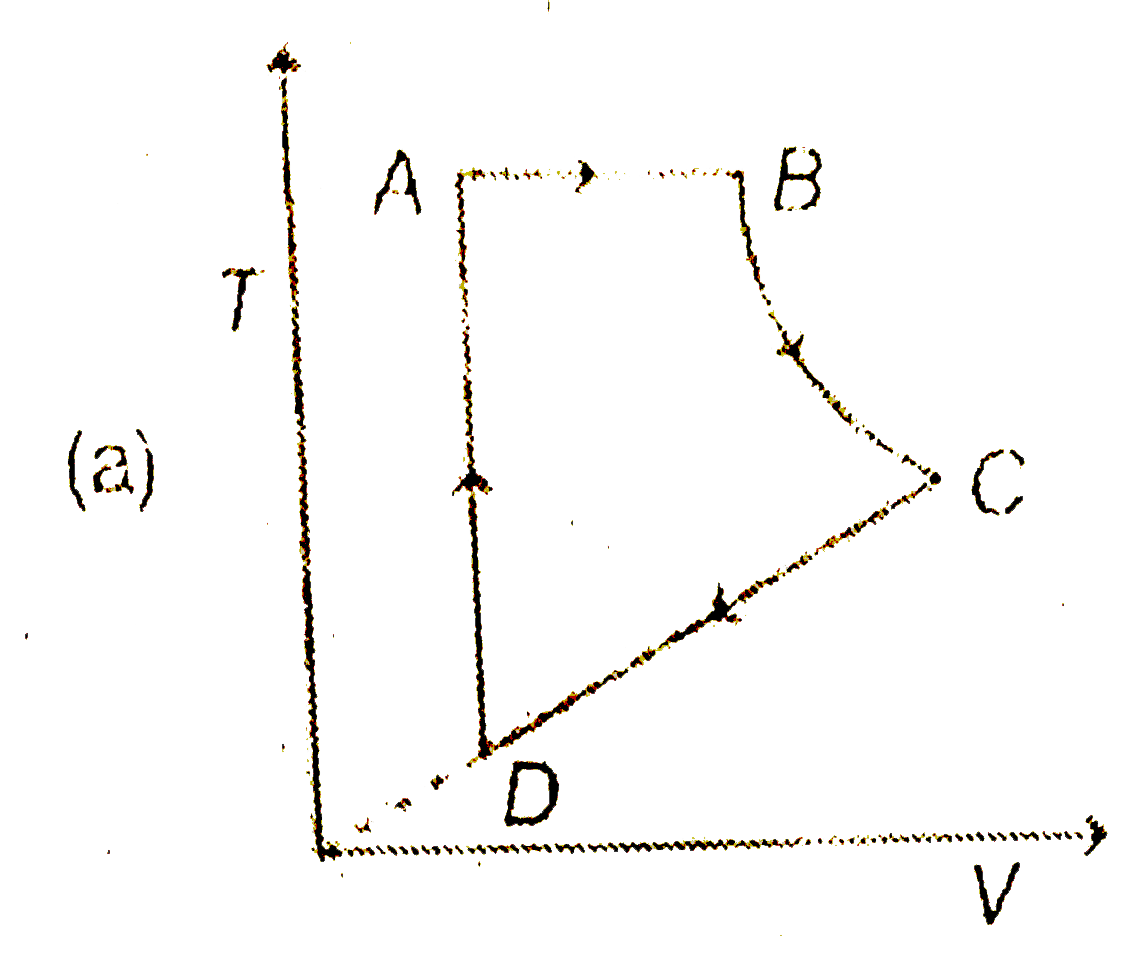 B
B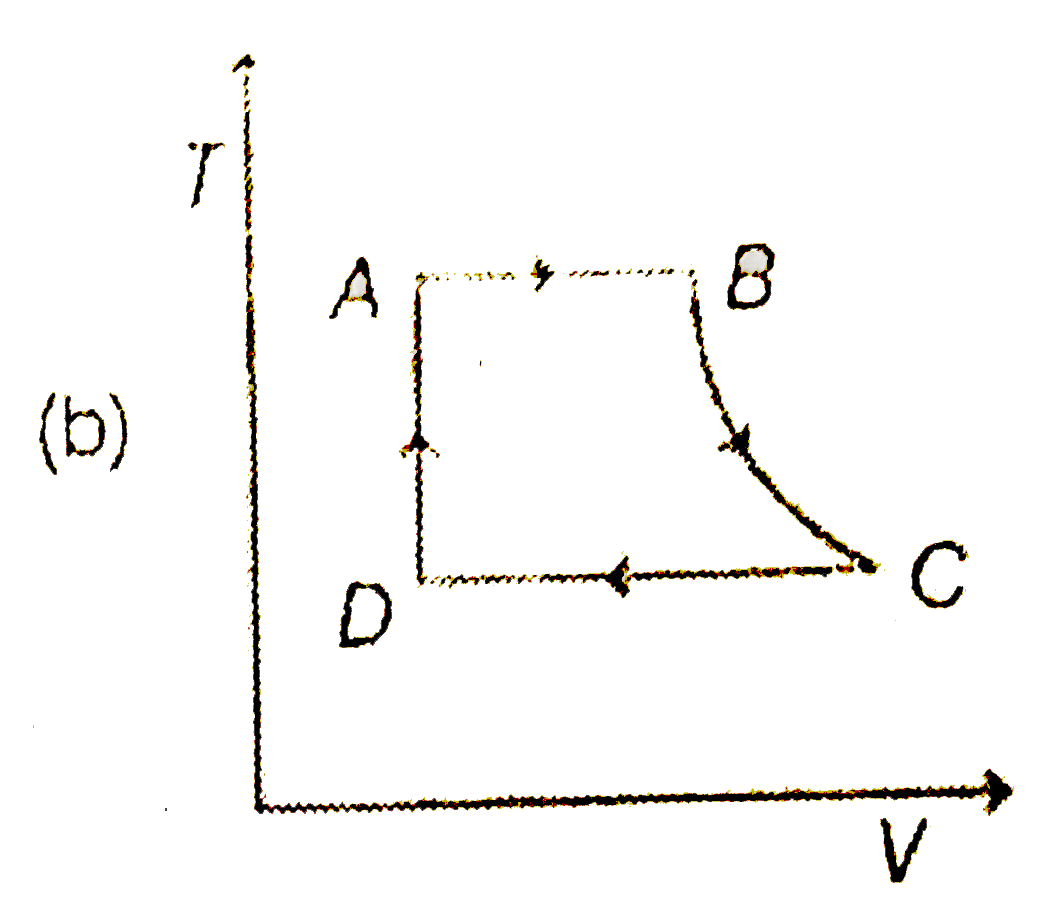 C
C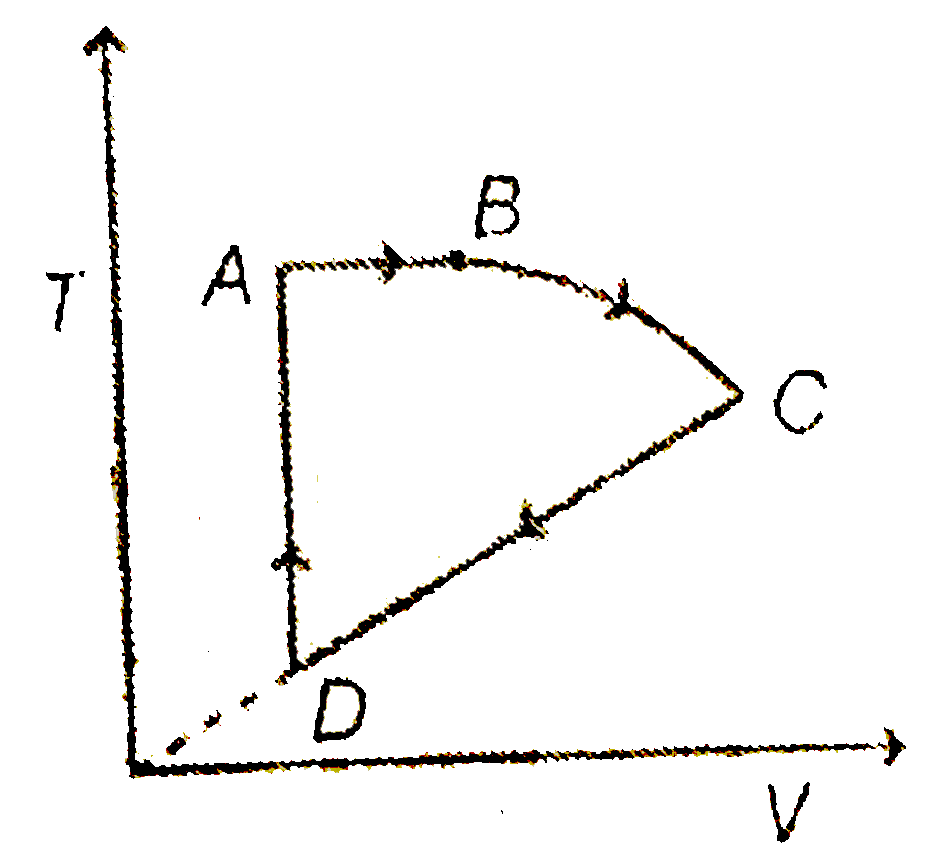 D
D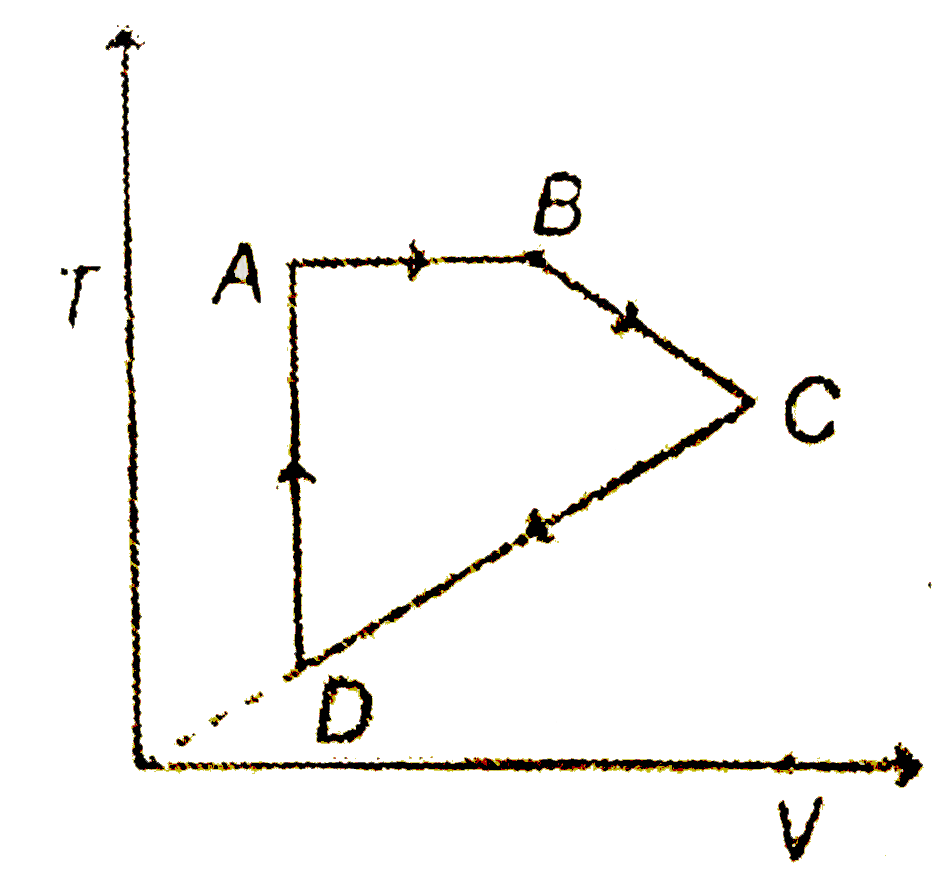
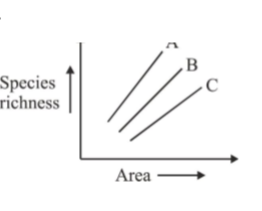
In the above graph, which slope represents more species richness ?
View SolutionThe graph pressure versus temperature (T) at constant volume is a straight line.(T/F)
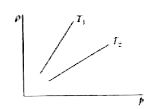
View SolutionFigure shows graphs of pressure versus density for an ideal gas at two temperatures T1 and T2 Then
View SolutionThe diagram below shows the change of phases of a substance on a temperature vs time graph on heating the substance at a constant rate.

Why is the slope of CD less than slope of AB ?
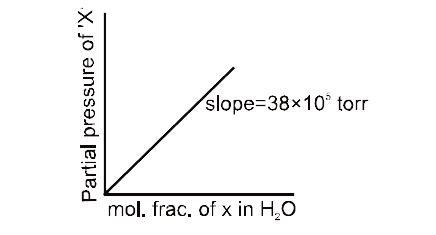
View SolutionA gas 'X' is present with saturated water vapour over water liquid at total pressure of 1.5 atm. Vapour pressure of H2O at same temperature is 0.5 atm. What is the solubility of gas 'X' in terms of moles in 10 moles H2O. The slope of the graph is 5000.
View Solution

