Action spectrum is A A graph showing amount of light absorbed B A graph showing rate of photosynthesis C A graph showing absorption of light D A graph showing amount of CO2 released
B A graph showing rate of photosynthesis
Related Solutions
Absorption spectrum is a graph showing
View SolutionThree of the graphs below show the absortion spectra of photosynthetic pigments. One graph shows the action spectrum of p'hotosynthesis for a plant containing the pigments.
All the x axis show wavelength. Three of the y axis show light absorption. One y axis shows the rate of photosynthesis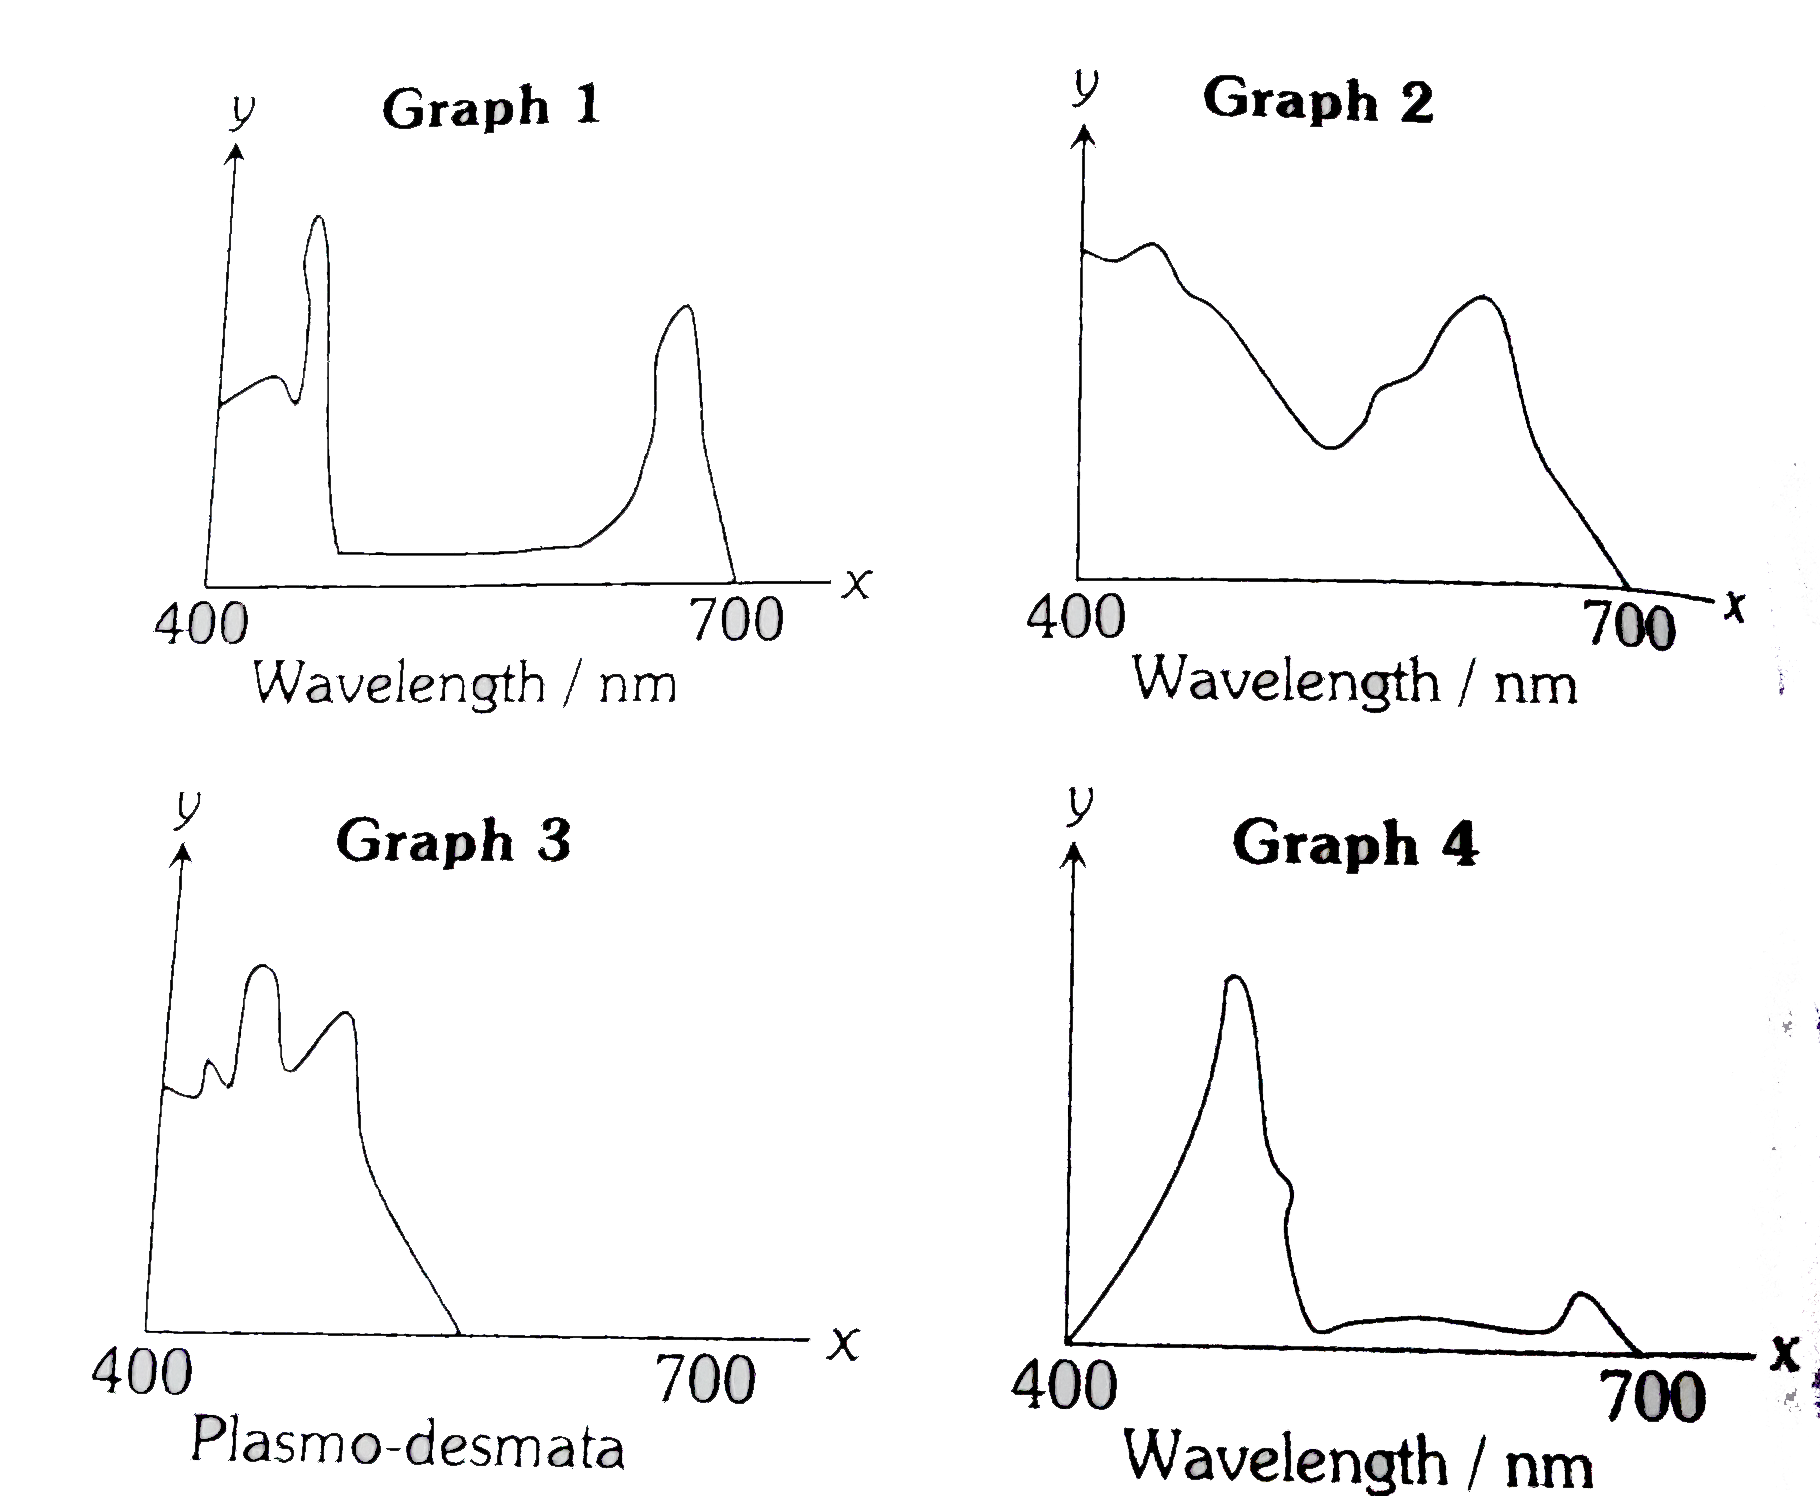
 View Solution
The graph showing rate of photosynthesis at different wavelength of light is called
View SolutionThe graph showing rate of Photosynthesis at different wavelengths of light is called
View SolutionThe graph showing rate of Photosynthesis at different wavelengths of light is called
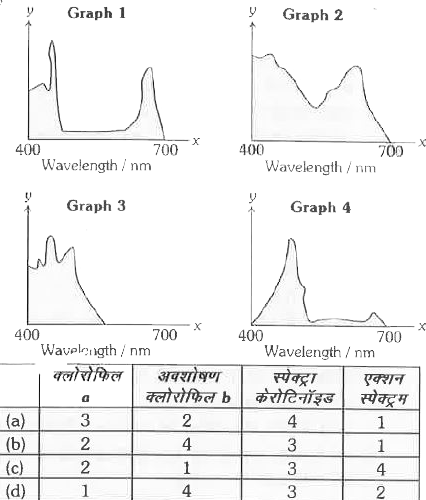
View Solutionनीचे दर्शाए गए चित्र में तीन ग्राफ प्रकाश संश्लेषी पिगमेंट के अवशोषण स्पेक्ट्रा को दर्शाते हैं। एक ग्राफ पिगमेण्ट युक्त पादप के लिए प्रकाश संश्लेषण के एक्शन स्पेक्ट्रम को दर्शाता है।
सभी x अक्ष तरंग दैर्ध्य को दर्शाते हैं। तीन " अक्ष प्रकाश अवशोषण को दर्शाते हैं तथा एक । अक्ष प्रकाश संश्लेषण की दर को दर्शाता है
 View Solution
विश्लेषक से निर्गत प्रकाश की तीव्रता का परिवर्तन प्रदर्शित करने वाला ग्राफ बनाइए।
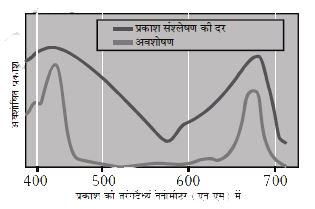
View Solutionनीचे दिये जा रहे आरेखीय निरूपण में एक ग्राफ दर्शाया गया है जो क्लोरोफिल 'ए' के अवशोषण वर्णक्रम पर प्रकाश संश्लेषण के क्रियात्मक वर्णक्रम के अध्यारोपण को दिखा रहा है। इसके लिए निम्न में से कौनसा सही है?
 View Solution
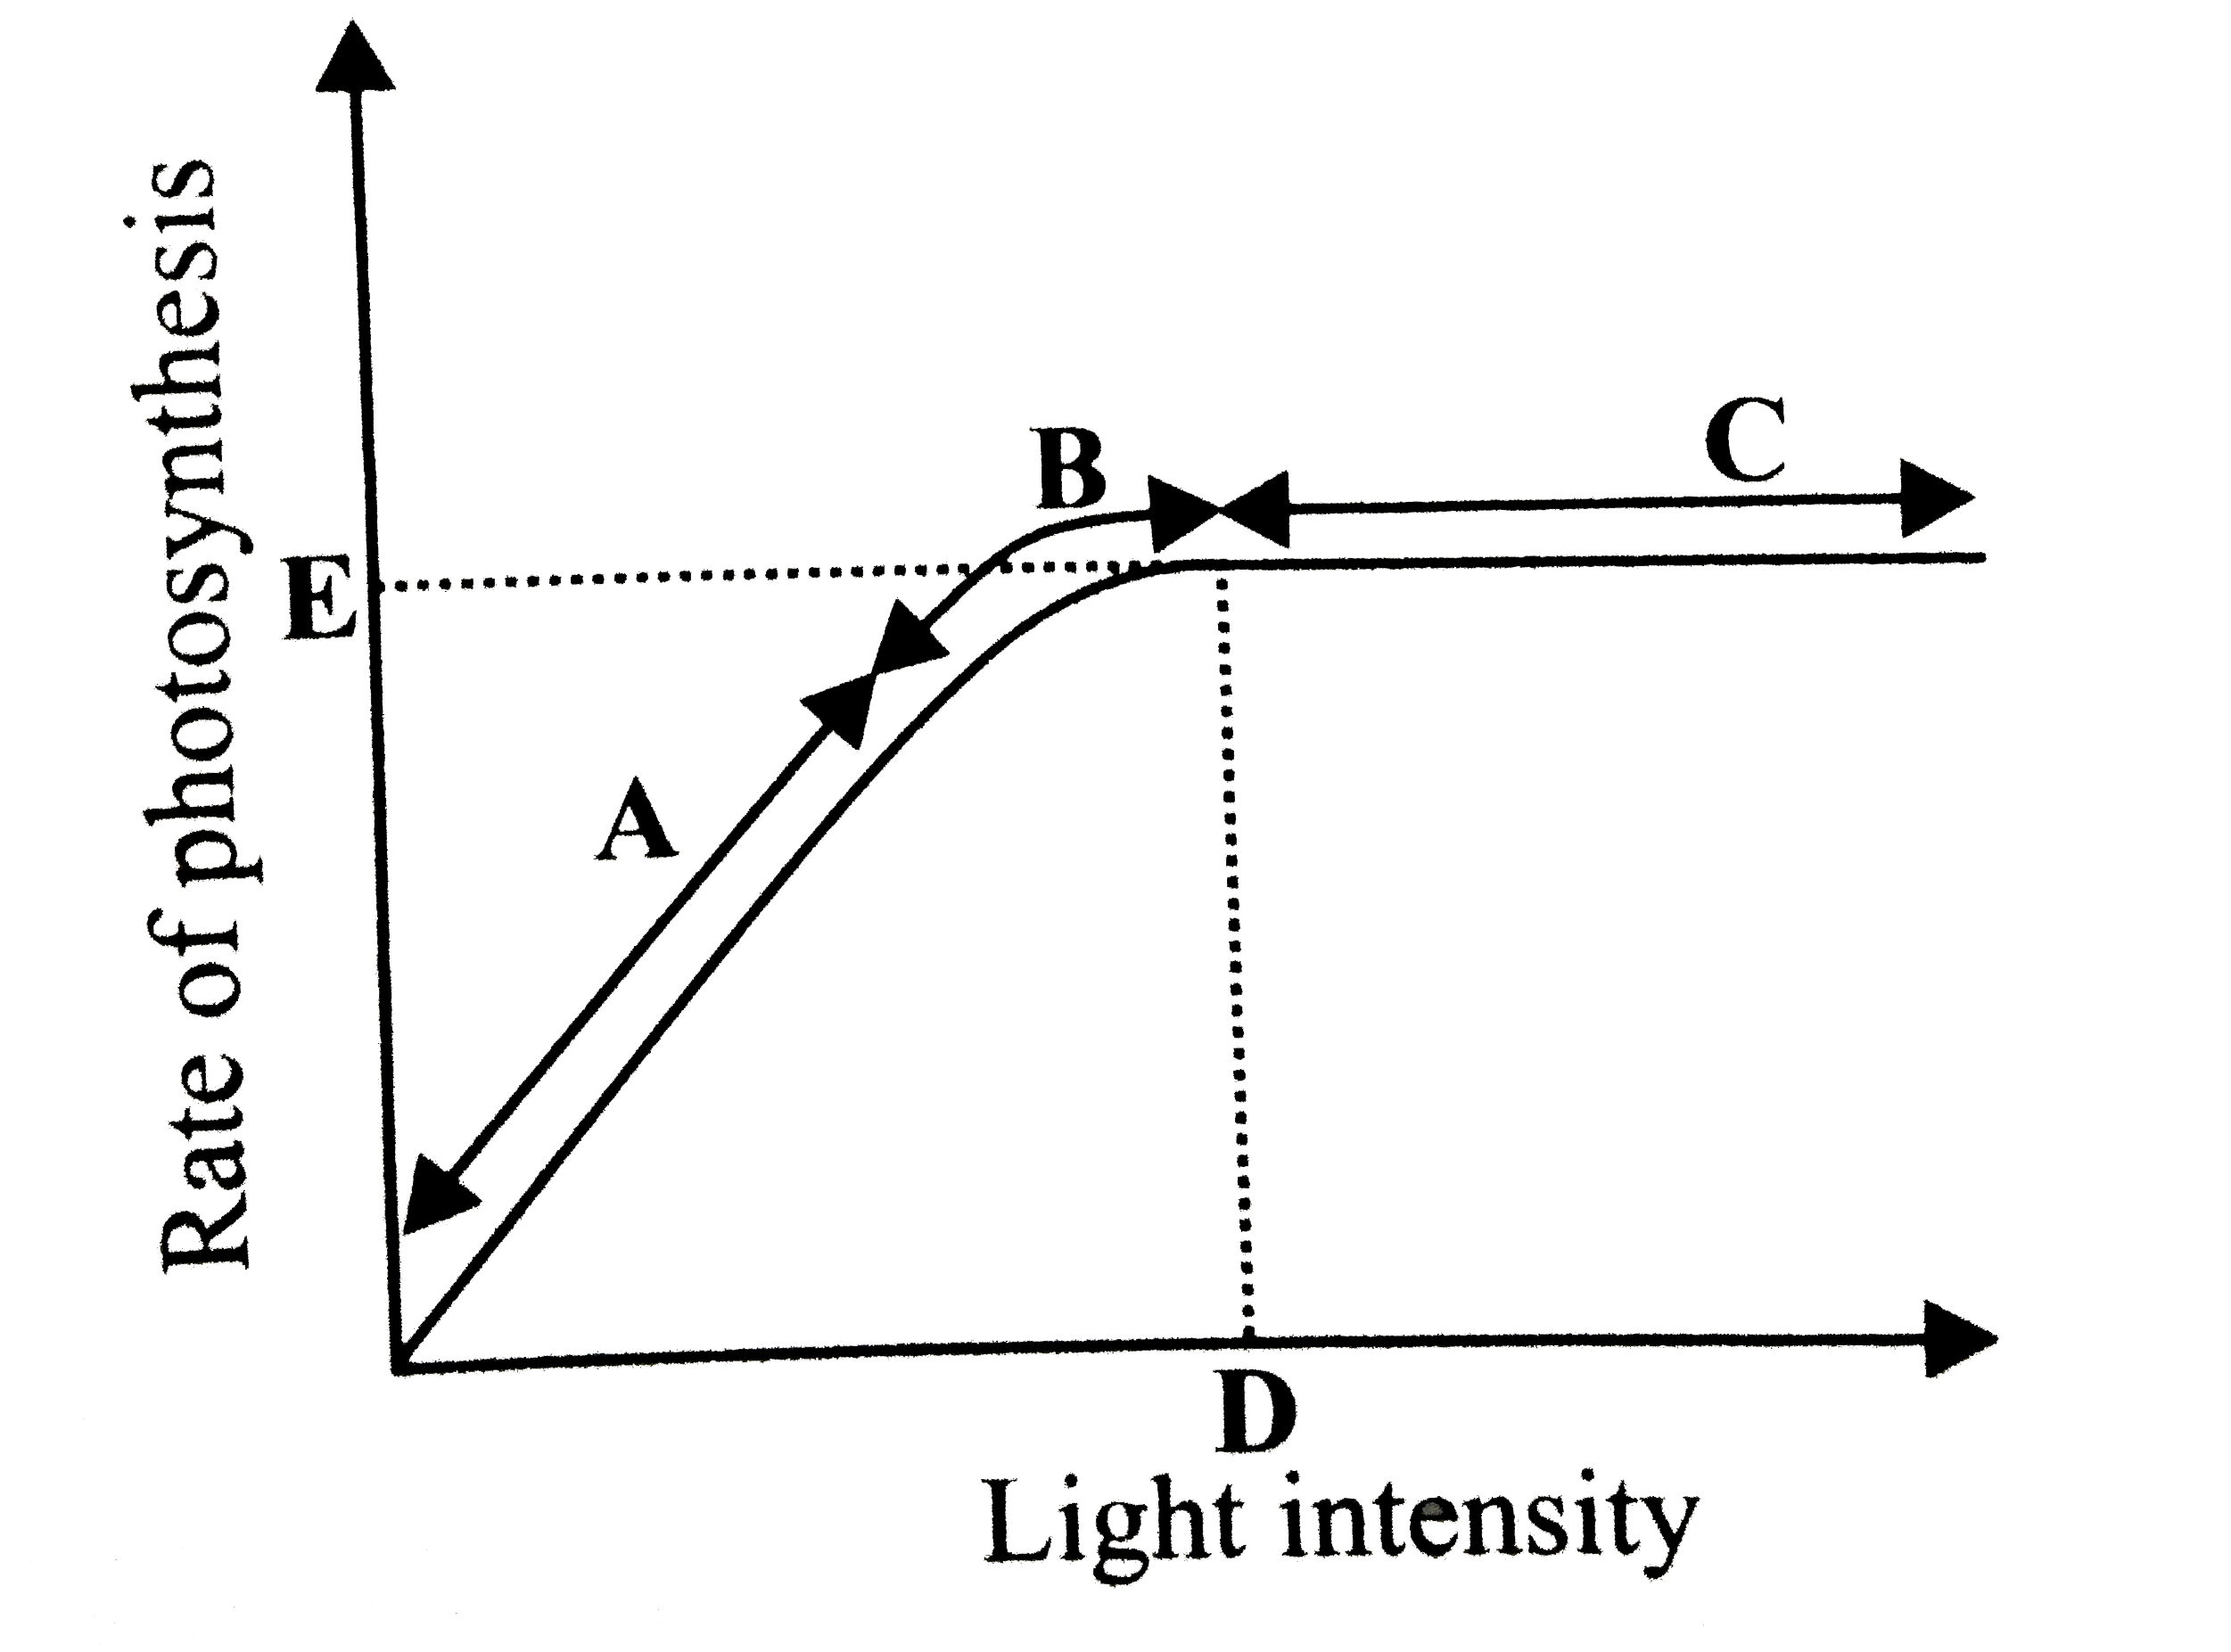
Figure shows the effect of light on the rate of photosynthesis. Based on the graph, answer the following questions: At which points (A, B or C in the curve is light a limiting factor?
View SolutionFigure shows the effect of light on the rate of photosynthesis. Based on the graph, answer the following questions. At which point/s (A, B, or C) in the curve is light a limiting factor?
View SolutionFigure shows the effect of light on the rate of photosynthesis. Based on the graph, answer the following questions: At which points (A, B or C) in the curve is light a limiting factor?
View SolutionObserve the following graphs carefully and select the true or false statement regarding it:- (i) Graph a indicates that at wavelength of blue and red color, chlorophyll a shows maximum absorption. (ii) Graph b indicates that at wavelengths of blue and red color, plants shows maximum rate of photosynthesis. (iii) Graph c indicates complete one to one overlap between the absorption spectrum of chlorophyll a and the action spectrum of photosynthesis.
View SolutionObserve the graph between light intensity and the rate of photosynthesis. Choose the correct graph w.r.t. A,B,C,D,E mentioned in the graph. a. (A) (I) Value of light intensity after which there is no increase in the rate of photosynthesis.
View SolutionStudy the given graph showing the efect of light intensity on the rate of photosynthesis. Which of the following statemetns regarding this is correct?
 View Solution
Study the given graph showing the efect of light intensity on the rate of photosynthesis. Which of the following statemetns regarding this is correct?
 View Solution
Figure shows the effect of light on the rate of photosynthesis. Based on the graph, answer the following questions. What would be the limiting factors in region A?
View SolutionFigure shows the effect of light on the rate of photosynthesis. Based on the graph, answer the following questions: What could be the limiting factors in region A?
View Solutionग्राफ A और B दर्शाते हैं
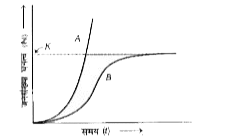 View Solution
The graph showing the energy spectrum of beta particle is
View SolutionFigure shows the effect of light on the rate of photosynthesis. Based on the graph, answer the following questions:
What do C and D represent on the curve?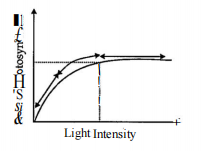 View Solution
