The graph showing rate of Photosynthesis at different wavelengths of light is called Solution in Telugu
Absorption spectrum
Action spectrum
Both (1) and (2)
None of these
The correct Answer is:B
Step by step video, text & image solution for The graph showing rate of Photosynthesis at different wavelengths of light is called by Biology experts to help you in doubts & scoring excellent marks in Class 12 exams.
Topper's Solved these Questions
- BOOK - AAKASH SERIESCHAPTER - PHOTOSYNTHESIS IN HIGHER PLANTS EXERCISE - Exercise - II33videos
PHOTOSYNTHESIS IN HIGHER PLANTS
- BOOK - AAKASH SERIESCHAPTER - PHOTOSYNTHESIS IN HIGHER PLANTS EXERCISE - Exercise - III27videos
PHOTOSYNTHESIS IN HIGHER PLANTS
- BOOK - AAKASH SERIESCHAPTER - ORGANISMS AND POPULATIONSEXERCISE - EXERCISE-III (PREVIOUS AIPMT/NEET QUESTIONS)35videos
ORGANISMS AND POPULATIONS
- BOOK - AAKASH SERIESCHAPTER - PLANT GROWTH AND DEVELOPMENT EXERCISE - EXERCISE -III (PREVIOUS AIPMT/NEET QUESTIONS)27videos
PLANT GROWTH AND DEVELOPMENT
Similar Questions
In an experiment demonstrating the evolution of oxygen in Hydrilla , sodium bicarbonate is added to water in the experiment ste- up . What would happen if all other conditions are favourable ?
03:56View SolutionPhosphoenol pyruvate (PEP) is the primary CO2 acceptor in :
03:04View SolutionAsymptote in a logistic growth curve is obtained when
View SolutionRoot hairs develop from the rgion of :
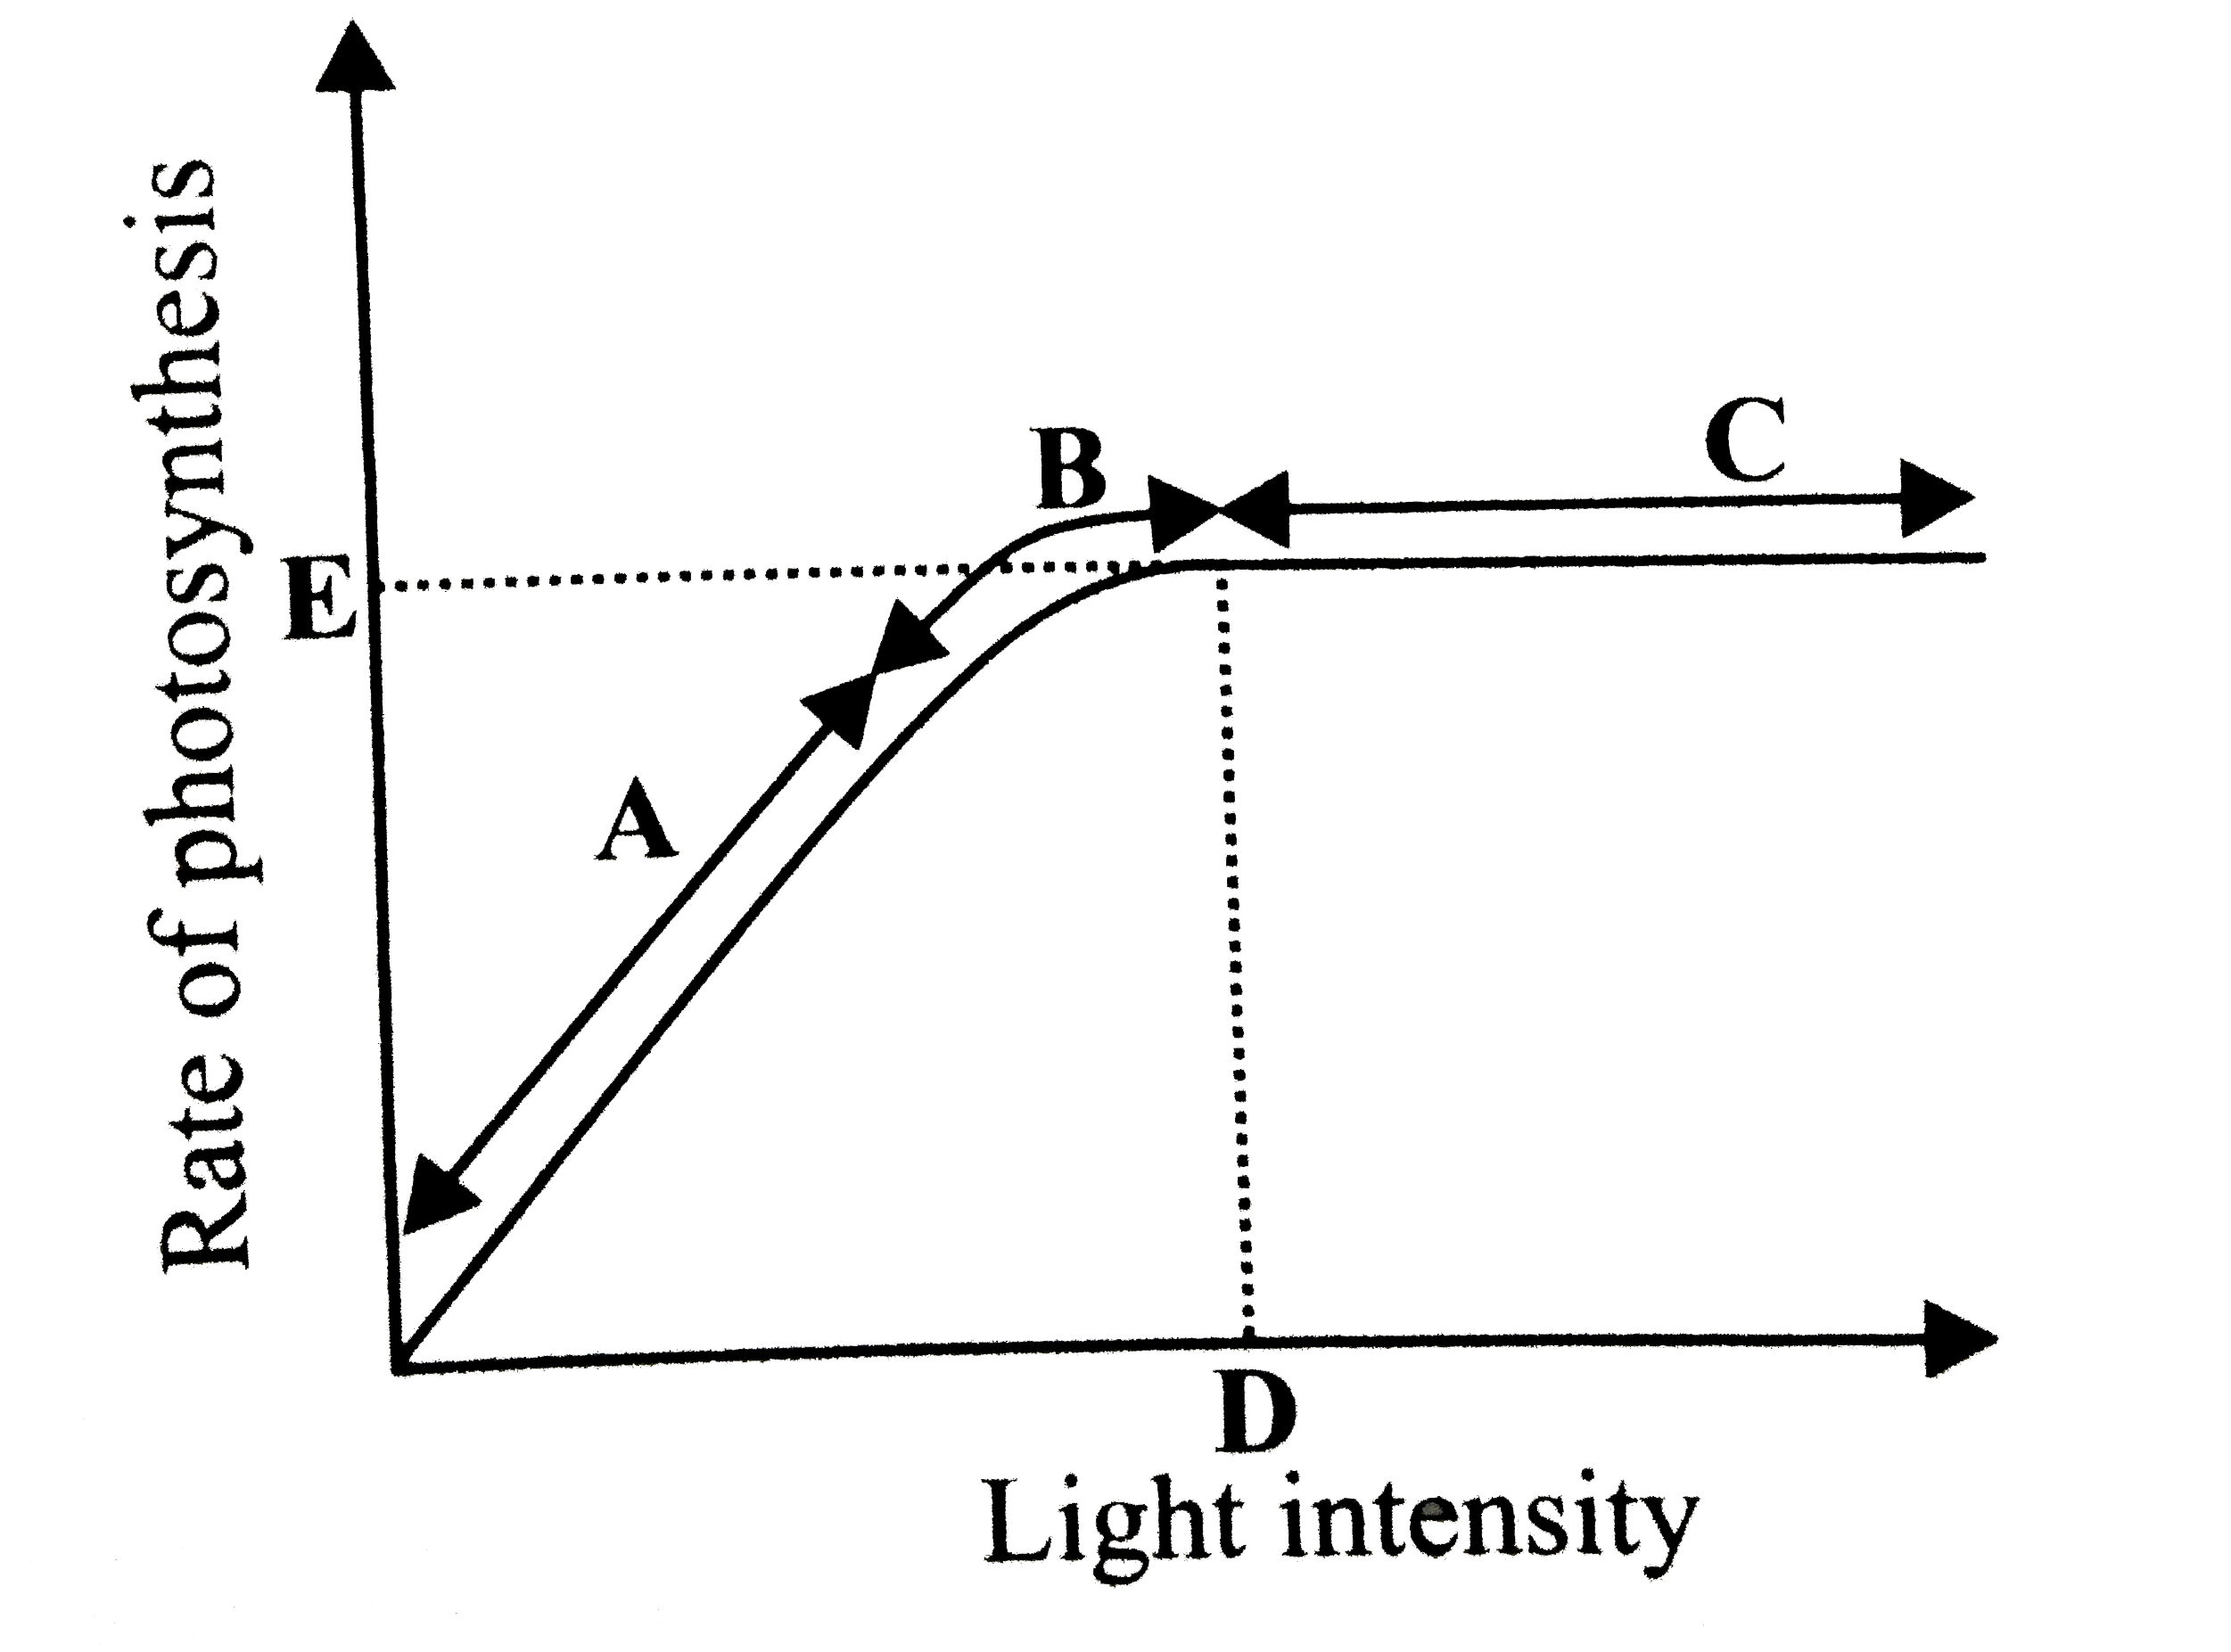
02:17View SolutionStudy the given graph showing the efect of light intensity on the rate of photosynthesis. Which of the following statemetns regarding this is correct?
 01:47View Solution
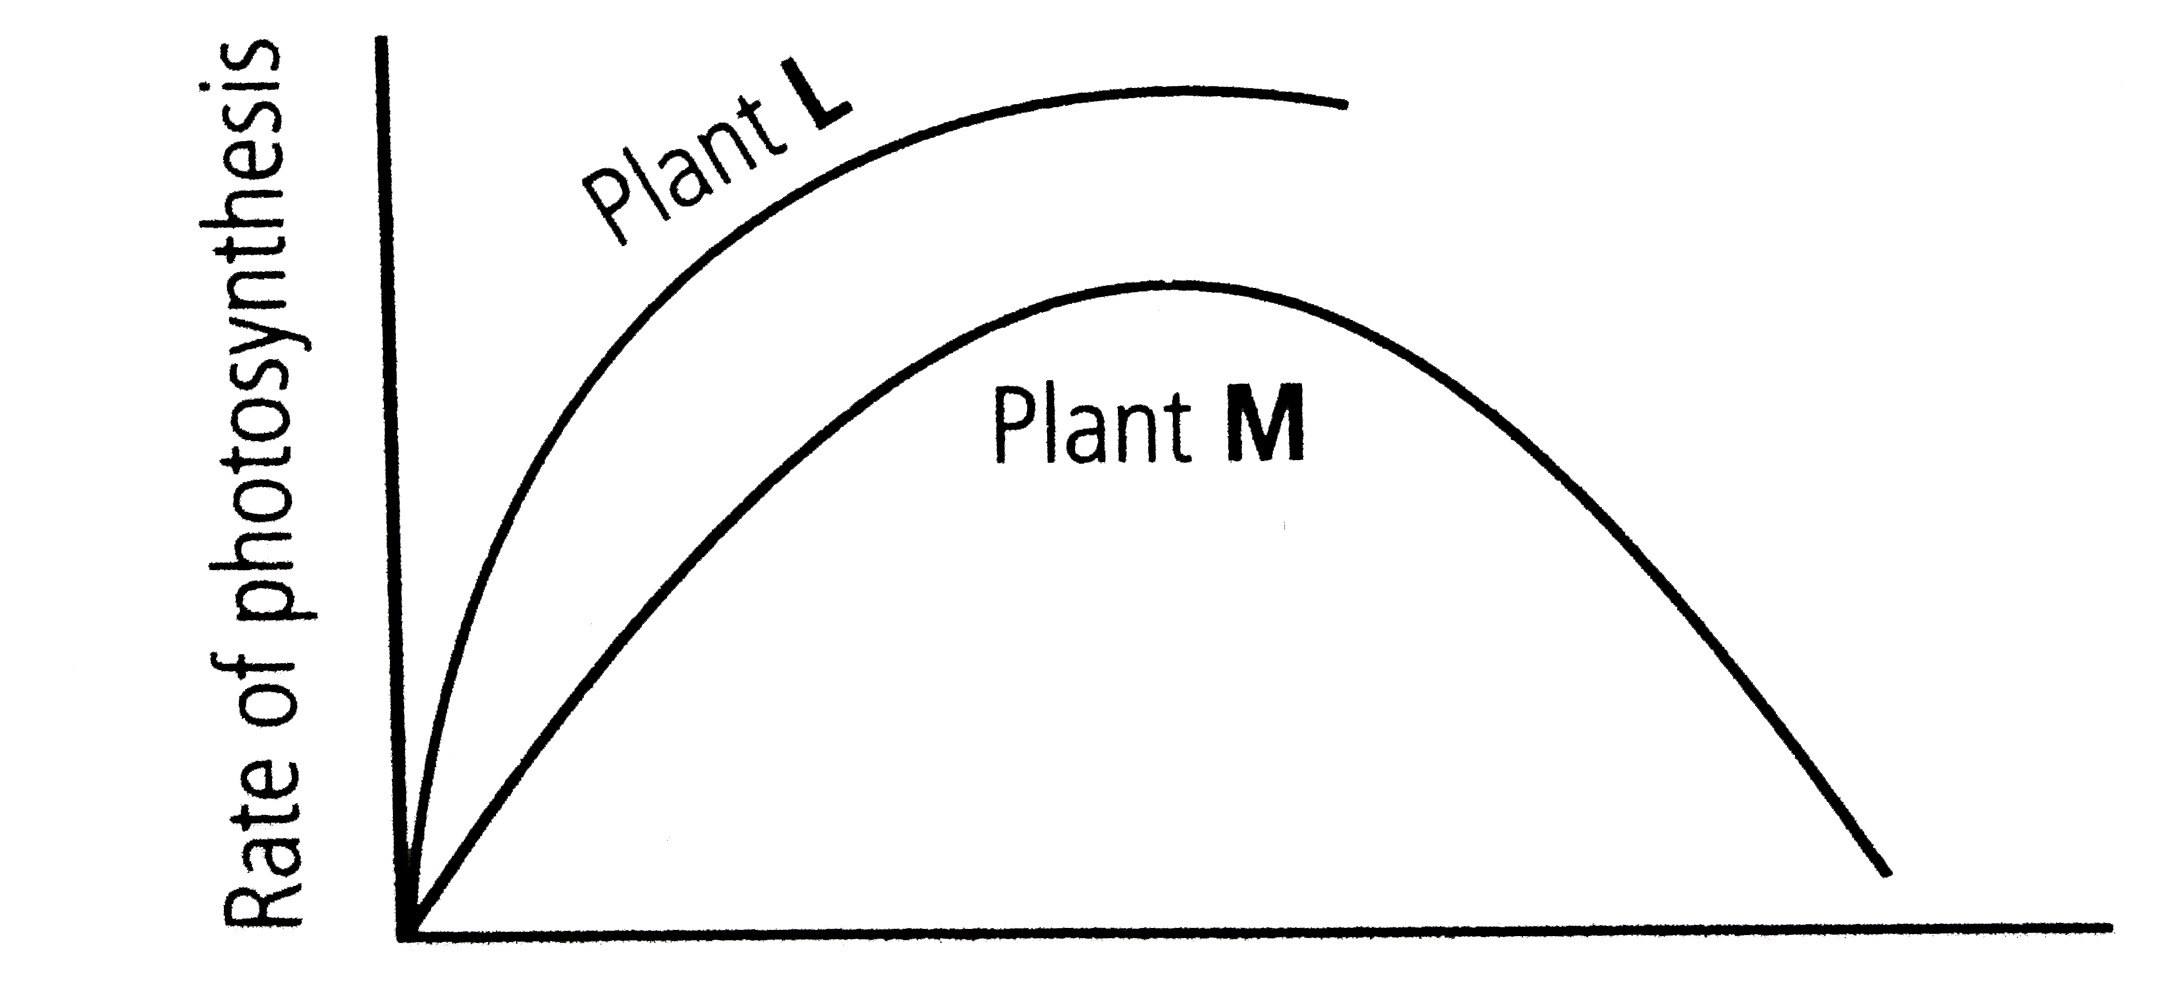
When two plants L and M were exposed to different light intensities and temperature they showed changes in their rates of photosynthesis. Which have been represented in the following graph.

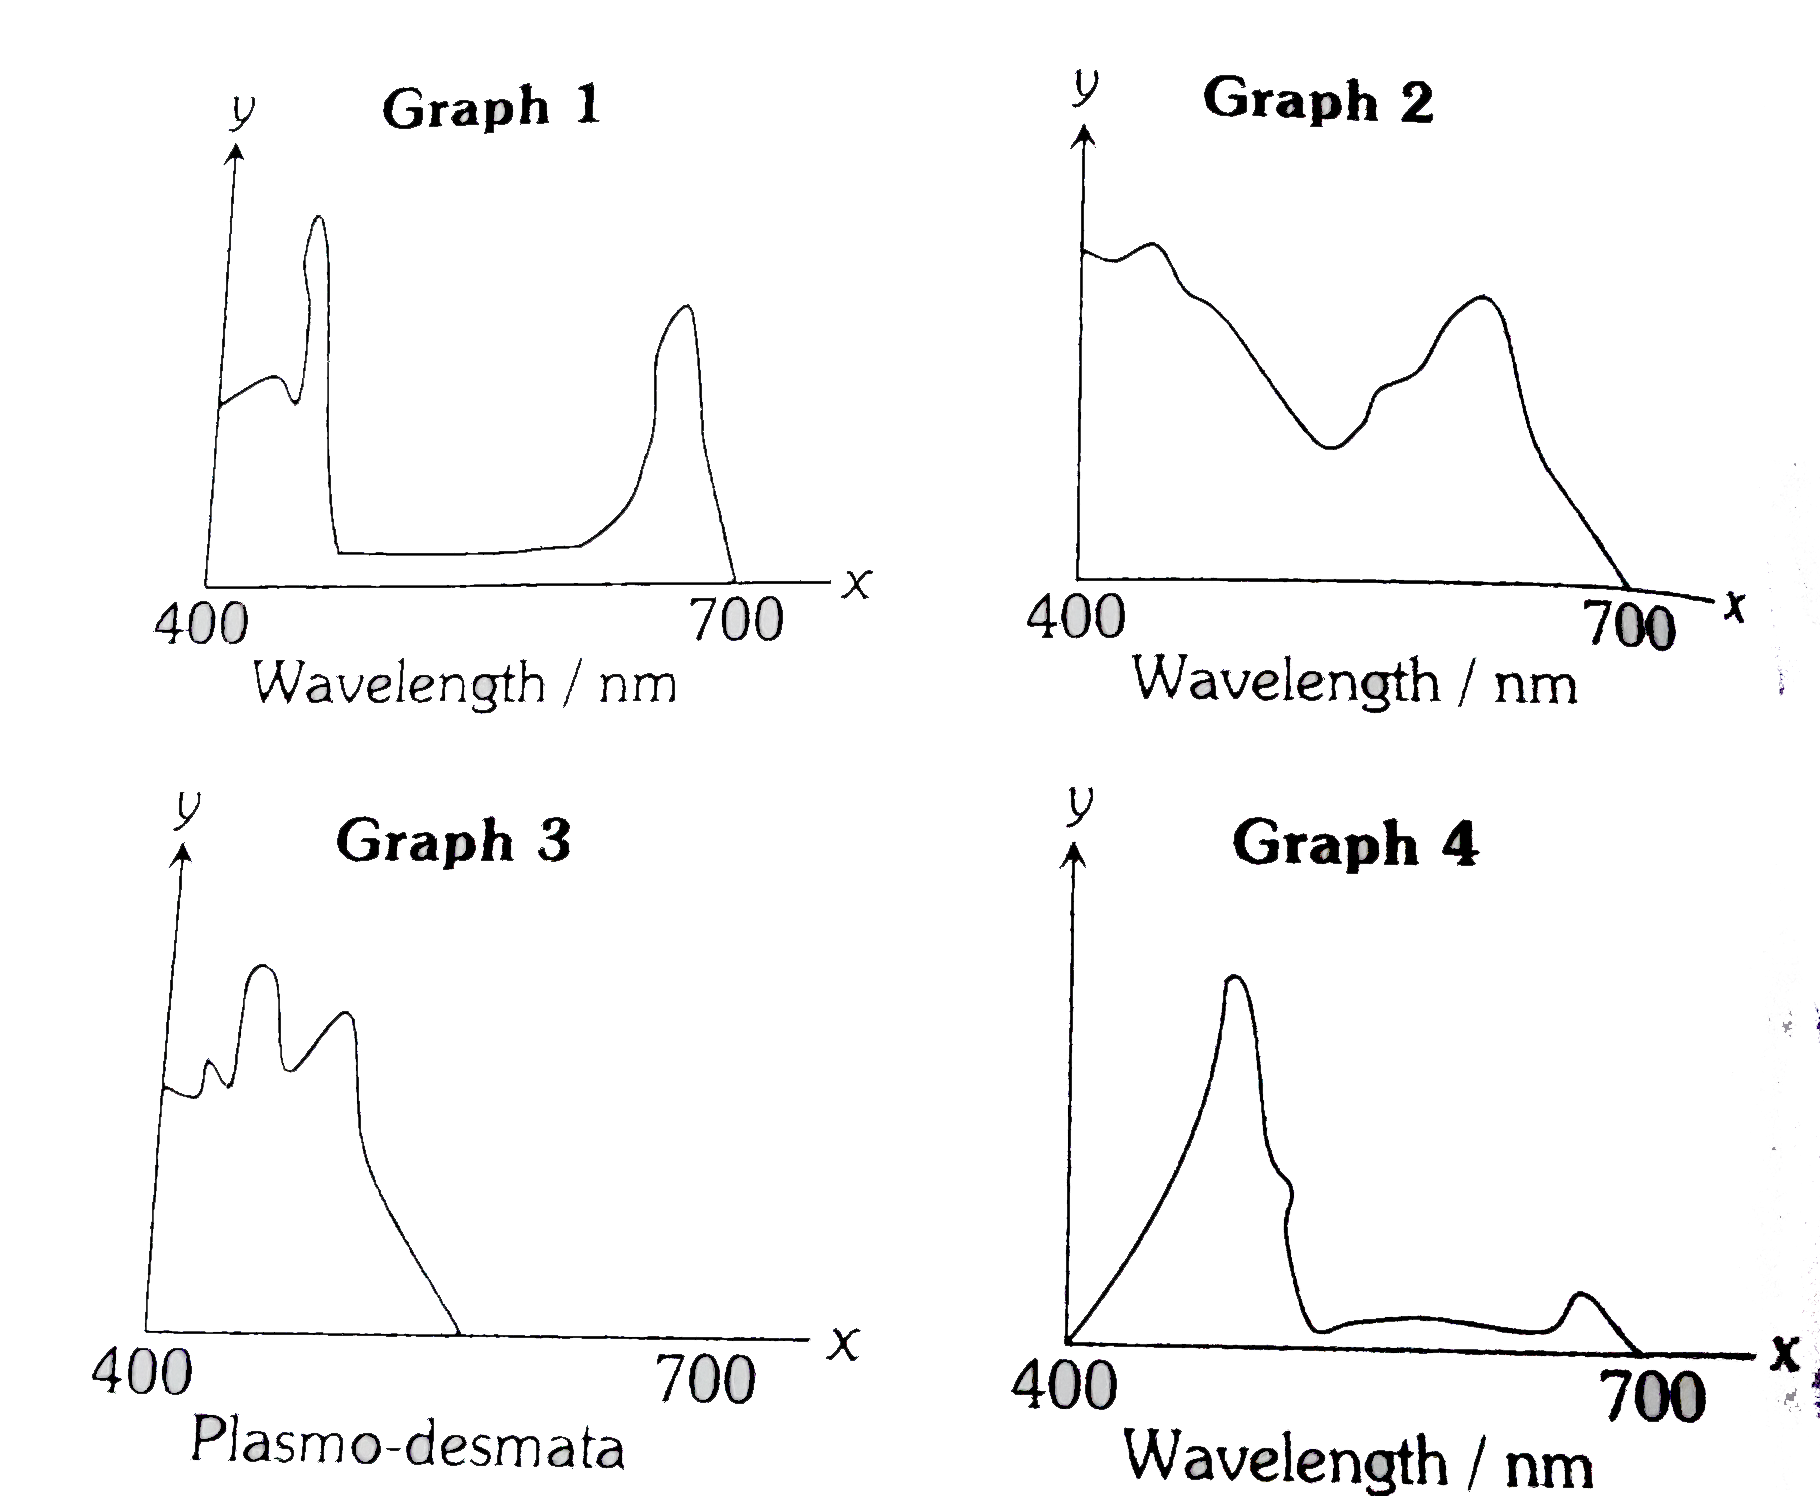
The graph indicates that04:02View SolutionThree of the graphs below show the absortion spectra of photosynthetic pigments. One graph shows the action spectrum of p'hotosynthesis for a plant containing the pigments.
All the x axis show wavelength. Three of the y axis show light absorption. One y axis shows the rate of photosynthesis
 03:01View Solution
The graph representing absorption of light at different wavelength is called
View SolutionEffectiveness of different wavelength of light on photosynthesis is measured by
02:07View SolutionAssertion :- Presence of accessory pigments enhances rate of photosynthesis. Reason :- They enable a wider range of wavelength of incoming light to be utilised for photosynthesis.
04:16View SolutionWhen two plants L and M were exposed to different light intensities and temperature , they showed changes in their rates of photosynthesis , which have been represented in the following graph. The graph indicates that
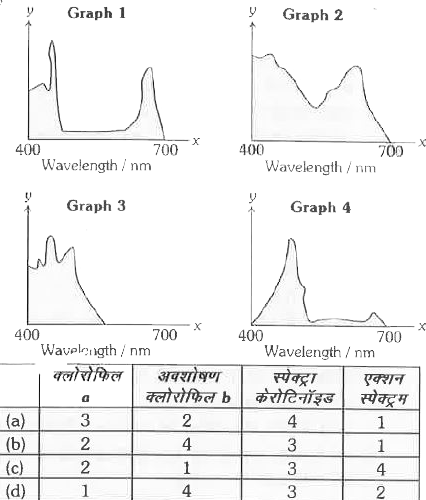
02:29View Solutionनीचे दर्शाए गए चित्र में तीन ग्राफ प्रकाश संश्लेषी पिगमेंट के अवशोषण स्पेक्ट्रा को दर्शाते हैं। एक ग्राफ पिगमेण्ट युक्त पादप के लिए प्रकाश संश्लेषण के एक्शन स्पेक्ट्रम को दर्शाता है।
सभी x अक्ष तरंग दैर्ध्य को दर्शाते हैं। तीन " अक्ष प्रकाश अवशोषण को दर्शाते हैं तथा एक । अक्ष प्रकाश संश्लेषण की दर को दर्शाता है
 View Solution
Study the given graph showing the efect of light intensity on the rate of photosynthesis. Which of the following statemetns regarding this is correct?
 01:17View Solution
When two plants L and M were exposed to different light intensities and temperature they showed changes in their rates of photosynthesis. Which have been represented in the following graph. The graph indicates that
02:00View SolutionThe curve showing the rate of photosynthesis at different wavelengths of light is:
02:36View SolutionObserve the graph between light intensity and the rate of photosynthesis. Choose the correct graph w.r.t. A,B,C,D,E mentioned in the graph. a. (A) (I) Value of light intensity after which there is no increase in the rate of photosynthesis.
View Solution

