In an experiment a student exposed seedlings of a plant species to two different light conditions:i. Full sunii. Shade 50% of full sunAssume that all the remaining conditions are same for both the groups. Plants from both the groups were collected at the ends of 6 weeks and various parameters were measured. The mean value for each parameter is given in the table.A student made the following hypotheses statements about the possible effect of different conditions on plants. You have to say whether these hypotheses are supported by the data given in the table or not.Hypothesis I:Plants grown in sun will show more shoot growth than root growth as compared to plants grown in shade.A Which of the following ratios can help to test hypothesis I?a. Leaf weight/ root weightb. Leaf area / leaf weightc. Leaf weight + stem weight / root weightd. Stem weight / Root weightPut a cross X in the appropriate box.B Calculate the value of the ratios for sun and shade plants based on the option selected by you in A.i Value of the ratio obtained for plants in the sun: ____ II Value of the ratio obtained for plants in shade condition ___C Put a cross X against the correct statement.i The values obtained in B support Hypothesis I: ___ii The values obtained in B do not support Hypothesis I : ___Hypothesis 2:Leaves produced by plants in shade condition will be thicker than those produced in sunny conditions. D Which of the following ratios can help to test hypothesis 2?a. Leaf weight / leaf areab. Leaf area / shoot weightc. Leaf weight / total plant weightd. Shoot weight / total plant weightPut a cross X in the appropriate box.E In another experiment the growth of plants was studied under two conditions as given below under sufficient light in both:I Condition X: water is supplied in sufficient quantity required for normal growth.II Condition Y: 50% of the required quantity of water is supplied.What would be the expected results?A Increase in leaf weight to stem weight ratio in Y as compared to XB Decrease in leaf thickness in Y as compared to XC Decreases in shoot weight to root weight ratio in Y as compared to XD Increase in leaf weight to stem weight ratio in X as compared to Y
Hypothesis I → Plants grown in sun will show more shoot growth than root growth as compared to plants grown in shade → incorrectA → C [only leaf weight + stem weight/root weight helps to test hypothesis I]B → i Value of the ratio obtained for plants in the sun: 1.71ii Value of the ratio obtained for plants in shade condition: 2.23C → ii The value obtained in B do not support Hypothesis 1: XHypothesis 2 → correctD → a leaf weight/ leaf area help to test hypothesis 2E → D
Related Solutions
For an experiment in Botany, two different plants, plant A and plant B were grown under similar laboratory conditions. Their heigths were measured at the end of each week for 3 weeks. The results are shown by the following graph.
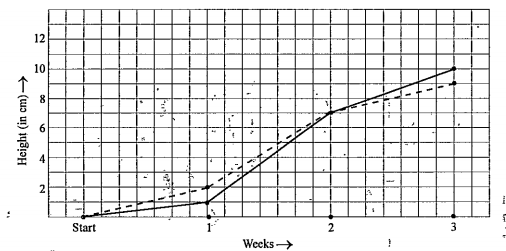
Were two Plants of the same height during any week shown here? Specify.View SolutionFor an experiment in Botany, two different plants, plant A and plant B were grown under similar laboratory conditions. Their heights were measured at the end of each week for 3 weeks. The results are shown by the following graph.
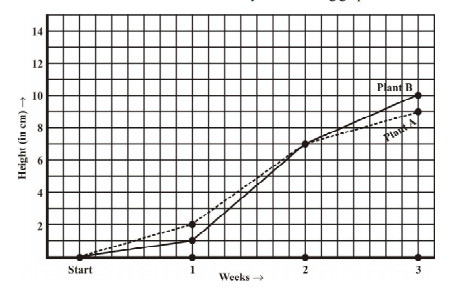 Were the two plants of the same height during any week shown here? SpecifyView Solution
For an experiment in Botany,two different plants, plant A nad plant B were grown under similar laboratory conditions.Their heights were measured at the end of each week for 3 weeks.The results are shown by the following graph.
Were the two plants of the same height during any week shown here ?Specify.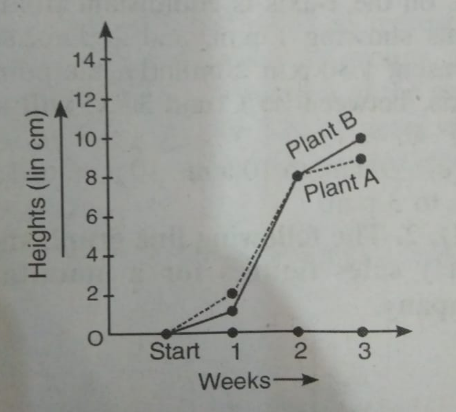 View Solution
For an experiement in Botany, two different plants, plant A and plant B were grown under similar laboratory conditions. Their heigths were measured at the end of each week for 3 weeks. The results are shown by the following graph.
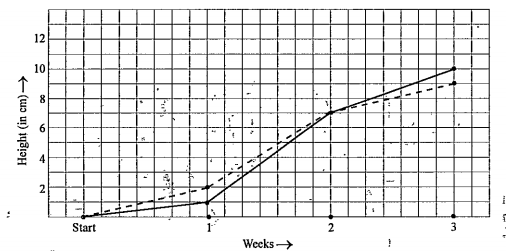
How much did Plant B grow from the end of the 2nd week to the end of the 3rd week?View SolutionFor an experiment in Botany,two different plants, plant A nad plant B were grown under similar laboratory conditions.Their heights were measured at the end of each week for 3 weeks.The results are shown by the following graph.
How high was plant A after
2 weeks?
3 weeks?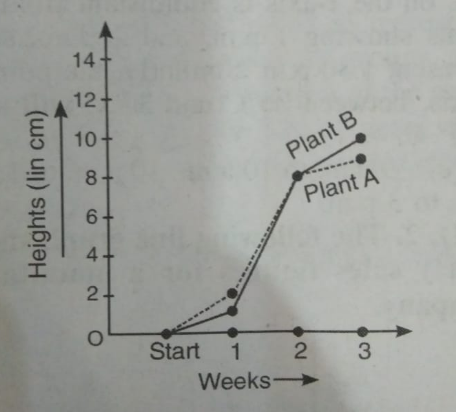 View Solution
For an experiment in Botany , two different plants , plant A and plant B were grown under similar laboratory conditions . Their heights were measured at the end of each weak for 3 weeks .The results are shown by the following graph :
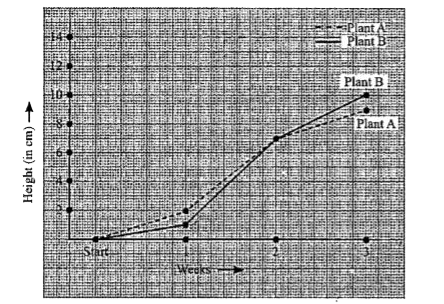
Were the two plants of the same height during any week shown here ? Specify .View Solutionछात्रों के एक समूह में प्रत्येक छात्र से उतने ही पैसे लिए गए, जितने इस समूह में छात्र थे। यदि कुल धन रु 5929 इकट्ठा हुआ हो, तो समूह में कितने छात्र थे ?
View Solutionछात्रों के एक समूह में प्रत्येक छात्र से उतने ही पैसे लिए गए जितने इस समूह में छात्र थे। यदि कुल धन Rs 59.29 एकत्र हुआ हो, तो समूह में कितने छात्र थे?
View Solutionछात्रों के एक समूह में प्रत्येक छात्र से उतने ही पैसे लिए गए जितने इस समूह में छात्र थे। यदि कुल धन 59.29 एकत्र हुआ हो, तो समूह में कितने छात्र थे ?
View SolutionTwo plants A and B were raised in the conditions. Their heights were measured at the end of each week for three weeks. The results are shown in the following graph: Were the height of the two plants equal in a week? Recognize
View SolutionIn a college, 40% of the students were allotted group A, 75% of the remaining were given group B and the remaining 12 students. were given group C. Then the number of students who applied for the group is
View SolutionIn a college, 40% of the students were allotted group A, 75% of the remaining were given group B and the remaining 12 students were given group C. Then the number of students who applied for the groups is
View Solutionवनस्पति विज्ञान के एक प्रयोग में समान प्रयोशाला परिस्थितियों में दो पौधे A तथा B उगाए गए। तीन सप्ताहों तक उनकी ऊँचाइयों को हर सप्ताह के अन्त में मापा गया। परिणामों को निम्न आलेख में दर्शाया गया है:
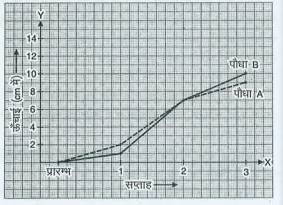 क्या किसी सप्ताह में दोनों पौधों की ऊँचाई समान थी ? पहचानिए।View Solution
एक कॉलेज में 40% छात्रों को समहू A में रखा गया, शेष छात्रों के 75% छात्रों को समूह B में रखा गया शेष 12 छात्रों के समहू C में रखा गया, तो कुल कितने छात्रों के समहू के लिए आवेदन किआ था ?
View SolutionFor an experiement in Botany, two different plants, plant A and plant B were grown under similar laboratory conditions. Their heigths were measured at the end of each week for 3 weeks. The results are shown by the following graph.
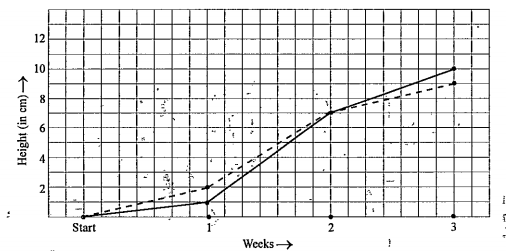
How high was Plant A after (i) 2 weeks (ii) 3 weeks?View SolutionFor an experiment in Botany, two different plants, plant A and plant B were grown under similar laboratory conditions. Their heigths were measured at the end of each week for 3 weeks. The results are shown by the following graph.
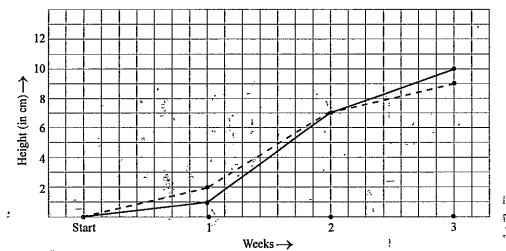
How high was Plant B after (i) 2 weeks (ii) 3 weeks?View SolutionFor an experiment in Botany,two different plants, plant A nad plant B were grown under similar laboratory conditions.Their heights were measured at the end of each week for 3 weeks.The results are shown by the following graph.
Were the two plants of the same height during any week shown here ?Specify. View Solution
For an experiment in Botany,two different plants, plant A nad plant B were grown under similar laboratory conditions.Their heights were measured at the end of each week for 3 weeks.The results are shown by the following graph.
During which week did Plant A grow most?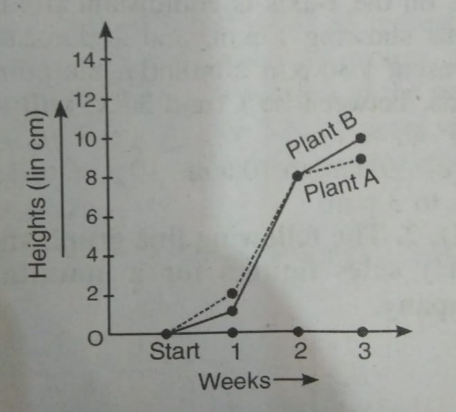 View Solution
For an experiment in Botany,two different plants, plant A nad plant B were grown under similar laboratory conditions.Their heights were measured at the end of each week for 3 weeks.The results are shown by the following graph.
During which week did Plant A grow most? View Solution
For an experiment in Botany,two different plants, plant A nad plant B were grown under similar laboratory conditions.Their heights were measured at the end of each week for 3 weeks.The results are shown by the following graph.
During which week did Plant A grow most? View Solution
