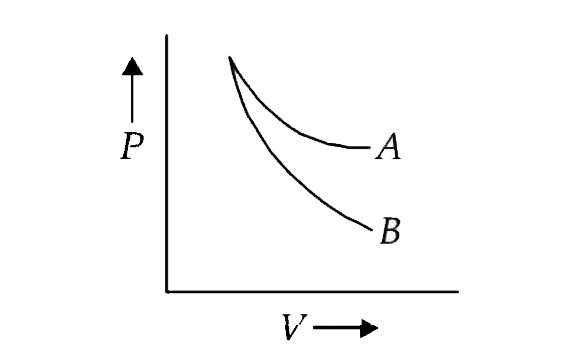
What is the ratio of slopes of P-V graphs of adiabatic and isothermal process?
The slope of P-V graph is dP/dVFor an isothermal process PV = constantSo dP/dV = P/V → 1For an adiabatic process PVY = constant dP/dV = YP/V → 2Divide 2 by 1 So the ratio of adiabatic slope to isothermal slope is Y.
Related Solutions
The ratio of slope of adiabatic to that of an isothermal process is:
View SolutionThe ratio of slopes of plots for reversible adiabatic process and reversible isothermal process of an ideal gas is equal to :
View SolutionThe slope of adiabatic P-V curve is_____times the slope of isothermal P-V curve in the process.
View SolutionAssertion: Isothermal and adiabatic, two processes are shown on p-V diagram. Process-1 is aidabatic and process-2 is isothermal. Reason: At a given point, slope of adiabatic process =gammaxx slope of isothermal process.
View SolutionAssertion: Isothermal and adiabatic, two processes are shown on p-V diagram. Process-1 is aidabatic and process-2 is isothermal. Reason: At a given point, slope of adiabatic process =gammaxx slope of isothermal process.
View Solutionસમતાપી પ્રક્રિયા અને સમોષ્મી પ્રક્રિયાના P - V આલેખના ઢાળ વચ્ચેનો સંબંધ, ........ .
View SolutionThe curves A and B in the figure shown P-V graphs for an isothermal and an adiabatic process for an idea gas. The isothermal process is represented by the curve A.

View SolutionThe curves A and B in the figure shown P-V graphs for an isothermal and an adiabatic process for an idea gas. The isothermal process is represented by the curve A.
View SolutionThe curves A and B in the figure shown P-V graphs for an isothermal and an adiabatic process for an idea gas. The isothermal process is represented by the curve A.

View SolutionShow that the slope of diagram is greater for an adiabatic process as compared to an isothermal process.
View SolutionShow that the slope of p-V diagram is greater for an adiabatic process as compared to an isothermal process.
View SolutionWhich of the following statement is correct regarding p-V graph?
1 slop of p-V graph in an isothermal process is
2 slope of p-V graph in an adiabatic process is
3 slope of p-V graph in an isochoric process is
4 slope of p-V graph in an isobaric porcess is zero
View SolutionThe ratio of slopes of adiabatic and isothermal curves is
View SolutionFor adiabatic process, the slope of indicator P-V diagram is
View SolutionWhy is p-V curve for adiabatic process steeper than that for isothermal process?
View SolutionThe ratio between the slopes of adiabatic curves and isothermal curves will be-
View SolutionShow adiabatic and isothermal processes on a single p-V diagram. Of the two graphs, which one is steeper?
View Solutionab and bc curves in the figure represent an isothermal and an adiabatic process respectively. Show that at the point b the ratio of the slopes of isothermal and adiabatic curves is equal to C_P/C_V .
View SolutionShow adiabatic and isothermal processes on a single P-V diagram.
View SolutionDraw P-V curves for isothermal and adiabatic processes of an ideal gas.
View Solution