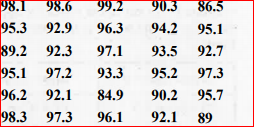
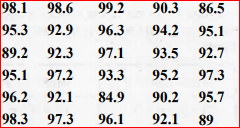
The relative humidity in % of a certain city for a month of 30 days was as follows:98.1 98.6 99.2 90.3 86.5 95.3 92.9 96.3 94.2 95.189.2 92.3 97.1 93.5 92.7 95.1 97.2 93.3 95.2 97.396.2 92.1 84.9 90.2 95.7 98.3 97.3 96.1 92.1 89i Construct a grouped frequency distribution table with classes84 - 86 86 - 88ii Which month or season do you think this data is about?iii What is the range of this data?
i A grouped frequency distribution table of class size 2 has to be constructed. The class intervals will be 84 − 86 86 − 88 and 88 − 90…By observing the data given above the required table can be constructed as follows.Relative humidity in %Number of days frequency 84 - 86186 - 88188 - 90290 - 922 92 - 94794 - 96696 - 98798 - 100 4Total30ii It can be observed that the relative humidity is high. Therefore the data is about a month of rainy season.iii Range of data = Maximum value − Minimum value= 99.2 − 84.9 = 14.3
Related Solutions
The relative humidity (in %) of a certain city for a month of 30 days was as follows: 98.1 98.6 99.2 90.3 86.5 95.3 92.9 96.3 94.2 95.189.2 92.3 97.1 93.5 92.7 95.1 97.2 93.3 95.2 97.396.2 92.1 84.9 90.2 95.7 98.3 97.3 96.1 92.1 89 (i) Construct a grouped frequency distribution table with classes 84 - 86, 86 - 88, etc.(ii) Which month or season do you think this data is about?(iii) What is the range of this data?
View Solution30 दिन वाले महीने में एक नगर की सापेक्ष आर्द्रता ( % में ) यह रही है :
98.1, 98.6, 99.2, 90.3, 86.5, 95.3, 92.9, 96.3, 94.2, 95.1, 89.2, 92.3, 97.1, 93.5, 92.7, 95.1, 97.2, 93.3, 95.2, 97.3, 96.2, 92.1, 84.9, 90.2, 95.7, 98.3, 97.3, 96.1, 92.1, 89
(i) वर्ग 84-86, 86-88 आदि लेकर एक वर्गीकृत बारम्बारता बंटन बनाइए।
(ii) क्या आप बता सकते हैं कि ये आँकड़े किस महीने या ऋतु से संबंधित हैं?
(iii) इन आँकड़ों का परिसर क्या है?View SolutionThe relative humidity (in %) of a certain city for a month of 30 days was as follows: 98.1 98.6 99.2 90.3 86.5 95.3 92.9 96.3 94.2 95.1 89.2 92.3 97.1 93.5 92.7 95.1 97.2 93.3 95.2 97.3 96.2 92.1 84.9 90.2 95.7 98.3 97.3 96.1 92.1 89
Construct a grouped frequency distribution table with classes 84 - 86, 86 - 88, etc.View SolutionThe relative humidity (in % ) of a certain city for a month of 30 days was as follows: 98.1 98.6 99.2 90.3 86.5 95.3 92.9 96.3 94.2 95.1 89.2 92.3 97.1 93.5 92.7 95.1 97.2 93.3 95.2 97.3 96.2 92.1 84.9 90.2 95.7 98.3 97.3 96.1 92.1 89
Construct a grouped frequency distribution table with classes 84 - 86, 86 - 88, etc.View SolutionThe relative humidity (in %) of a certain city for a month of 30 days was as follows :
 : Construct a grouped frequency distribution table with classes 84 - 86, 86-88 etc.View Solution
The relative humidity (in %) of a city in a month of 30 days has been: {:(98.1, 98.6, 99.2 ,90.3 ,86.5 ,95.3 ,92.9 ,96.3, 94.2 ,95.1, 89.2, 92.3),( 97.1, 93.5 ,92.7, 95.1, 97.2, 93.3, 95.2, 97.3 ,96.2, 92.1, 84.9 ,90.2 ),(95.7, 98.3 ,97.3 ,96.1 ,92.1, 89,,,,,,):} Make a grouped frequency distribution table by taking classes 84-86, 86-88 etc.
View SolutionThe relative humidity (in %) of a certain city for a month of 30 days was as follows :
 : Which month or season do you think this data is about ?
View Solution
: Which month or season do you think this data is about ?
View SolutionThe relative humidity (in % ) of a certain city for a month of 30 days was as follows: 98.1 98.6 99.2 90.3 86.5 95.3 92.9 96.3 94.2 95.1 89.2 92.3 97.1 93.5 92.7 95.1 97.2 93.3 95.2 97.3 96.2 92.1 84.9 90.2 95.7 98.3 97.3 96.1 92.1 89
What is the range of this data?View SolutionThe relative humidity (in %) of a city in a month of 30 days has been: {:(98.1, 98.6, 99.2 ,90.3 ,86.5 ,95.3 ,92.9 ,96.3, 94.2 ,95.1, 89.2, 92.3),( 97.1, 93.5 ,92.7, 95.1, 97.2, 93.3, 95.2, 97.3 ,96.2, 92.1, 84.9 ,90.2 ),(95.7, 98.3 ,97.3 ,96.1 ,92.1, 89,,,,,,):} what is the range of these data
View SolutionThe relative humidity (in %) of a certain city for a month of 30 days was as follows :
 : What is the range of this data ?
View Solution
: What is the range of this data ?
View SolutionThe relative humidity (in%) of a particular city within 30 days of a month is as follows. 98.1, 98.6, 99.2, 90.3, 86.5, 95.3, 92.9, 96.3, 94.2, 95.1, 89.2, 92.3, 97.1, 93.5, 92.7, 95.1, 97.2, 93.3, 95.2, 97.3, 96.2, 92.1, 84.9, 90.2, 95.7, 98.3, 97.3, 96.1, 92.1, 89. (i) Take the variants, 84-86,86-88, etc., and prepare a virtual version distribution list. (ii) What month / period do you think these data are related to? (iii) What is the scope of this data?
View SolutionThe relative humidity (in %) of a certain city for a month of 30 days was as follows:

(i) Construct a grouped frequency distribution table with classes 84-86, 86-88, etc. (ii) Which month or season do you think this data is about ? (iii) What is the range of this data ?View SolutionThe relative humidity (in %) of a certain city for a month of 30 days was as follows :
 : Construct a grouped frequency distribution table with classes 84 - 86, 86-88 etc.View Solution
The relative humidity (in %) of a certain City for a September month of 30 days was as follows:

(i) Construct a grouped frequency distribution table with classes 84-86, 86,-88 etc.
(ii) What is the range of the data?View SolutionThe relative humidity (in %) of a certain City for a September month of 30 days was as follows:

(i) Construct a grouped frequency distribution table with classes 84-86, 86,-88 etc.
(ii) What is the range of the data?View SolutionThe relative humidity (in %) of a certain City for a September month of 30 days was as follows:

(i) Construct a grouped frequency distribution table with classes 84-86, 86,-88 etc.
(ii) What is the range of the data?View SolutionThe relative humidity (in %) of a certain City for a September month of 30 days was as follows:

(i) Construct a grouped frequency distribution table with classes 84-86, 86,-88 etc.
(ii) What is the range of the data?View SolutionThe relative humidity (in %) of a certain city for a month of 30 days was as follows :
 : Which month or season do you think this data is about ?
View Solution
: Which month or season do you think this data is about ?
View SolutionThe relative humidity (in %) of a certain city for a month of 30 days was as follows :
(i) Construct a grouped frequency distribution table with classes 84-86 ,86-88, etc.View Solution
