A teacher wanted to analyse the performance of two sections of students in a mathematics test of 100 marks. Looking at their performances she found that a few students got under 20 marks and a few got 70 marks or above. So she decided to group them into intervals of varying sizes as follows: 0 − 20 20 − 30… 60 − 70 70 − 100. Then she formed the following table:MarksNumber of student0-20720-301030-401040-502050-602060-701570-above8Total90i Find the probability that a student obtained less than 20 % in the mathematics test.ii Find the probability that a student obtained marks 60 or above.
Totalnumber of students = 90i Number of students getting less than 20 % marks in the test = 7Hence required probability P = 7/90ii Number of students obtaining marks 60 or above = 15 + 8 = 23Hence required probability P = 23/90
Related Solutions
The information regarding the marks scored by 30 students in a 20 mark test of Mathematics is given below:

Find the mean of the data.
View SolutionA teacher wanted to analysis the performance of two sections of students in a mathematics test of 100 marks. Looking performance, she found that a few students got under 20 marks and a few got 70 marks or above. So she decided to group them into intervals of varying sizes as follows :
0-20, 20-30, ....., 60-70, 70-100. Then she formed the following table :
(i) Find the probability that a student obtained less than in the mathematics test.
(ii) Find the probability that a student obtained marks 60 or above .
View SolutionA teacher wanted to analysis the performance of two sections of students in a mathematics test of 100 marks. Looking performance, she found that a few students got under 20 marks and a few got 70 marks or above. So she decided to group them into intervals of varying sizes as follows :(i) Find the probability that a student obtained less than in the mathematics test.
(ii) Find the probability that a student obtained marks 60 or above .
0-20, 20-30, ....., 60-70, 70-100. Then she formed the following table :
View SolutionA teacher wanted to analysis the performance of two sections of students in a mathematics test of 100 marks. Looking performance, she found that a few students got under 20 marks and a few got 70 marks or above. So she decided to group them into intervals of varying sizes as follows :
0-20, 20-30, ....., 60-70, 70-100. Then she formed the following table :
(i) Find the probability that a student obtained less than in the mathematics test.
(ii) Find the probability that a student obtained marks 60 or above .
View SolutionA teacher analyses the performance of two sections of students in a mathematics test of 100 marks given in the following table.
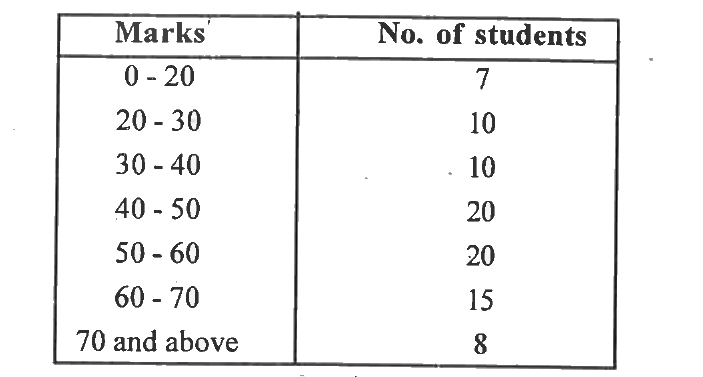
Find the probability that a student obtained marks 60 or above.
View SolutionA teacher analyses the performance of two sections of students in a mathematics test of 100 marks given in the following table :
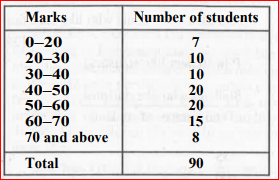 : Find the probability that a student obtained less than 20 marks in the mathematics test.
View SolutionA teacher analyses the performance of two sections of students in a mathematics test of 100 marks given in the following table :
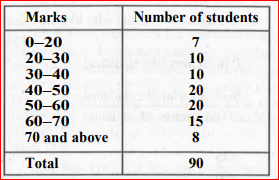 : Find the probability that a student obtained 60 or above
View SolutionFollowing table shows the marks scored by a group of 90 students in a mathematics test of 100 marks. Marks 0-20 20-30 30-40 40-50 50-60 60-70 70-100 No. of Students: 7 10 10 20 20 15 8 Find the probability that marks scored by a student in the class is: at most 60 marks (ii) at least 60 marks (iii)not more than 50 marks
View SolutionFollowing table shows the marks scored by a group of 90 students in a mathematics test of 100 marks. Marks 0-20 20-30 30-40 40-50 50-60 60-70 70-100 No. of Students: 7 10 10 20 20 15 8 Find the probability that marks scored by a student in the class is: at most 60 marks (ii) at least 60 marks (iii)not more than 50 marks
View SolutionA teacher analyses the performance of two sections of students in a mathematics test of 100 marks given in the following table.
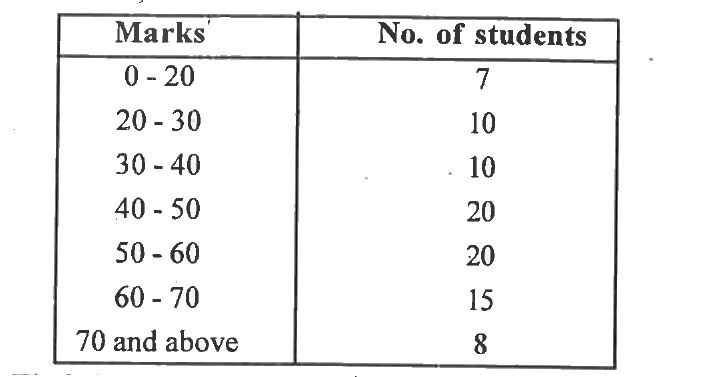
Find the probability that a student obtained less than 20 in the mathematics test.
View Solutionनिम्न प्रेक्षण 18 छात्रों के गणित की परीक्षा में प्राप्तांकों को दर्शाते है, इनका माध्य ज्ञात कीजिए -
45, 40, 50, 40, 60, 40, 50, 50, 70, 30, 20, 70, 50, 45, 30, 20, 70, 70
View SolutionThe mean marks got by 300 students in the subject of statistics was 45. The mean of the top 100 of them was found to be 70 and the mean of the last 100 was known to be 20, then the mean of the remaining 100 students is
View SolutionThe mean marks got by 300 students in the subject of statistics was 45. The mean of the top 100 of them was found to be 70 and the mean of the last 100 was known to be 20, then the mean of the remaining 100 students is
View SolutionA teacher wants to analyze the performance of the students of two sections by taking a maths test of 100 marks. Looking at their performances, she finds that only a few students have scores less than 20 and some students score 70 or more. Finally, he decided to classify the students into intervals of different scales such as 0-20, 20-30, ...., 60-70,70100. Then he made the following table. A student made a histogram of this table as shown in the figure. Examine this graphical representation carefully. Do you think that this graph represents the data accurately? If not, re-construct the histogram giving the errors.
View SolutionThe following table gives the marks scored by 100 students in an entrance examination. Marks: 0-10 10-20 20-30 30-40 40-50 50-60 60-70 70-80 No. of Students (Frequency): 4 10 16 22 20 18 8 2 Represent this data in the form of a histogram.
View SolutionThe following table gives the marks scored by 100 students in an entrance examination.

View SolutionIn an examination, a student has to secure 35% of the maximum marks to pass. One student got 70 marks and failed by 70 marks. The maximum marks in the examination are
View Solutionवर्ग अन्तराल तथा के वर्ग चिह्नों का माध्य ज्ञात करें।
View SolutionA teacher wanted to analyse the performance of two sections of students in a Mathematics test. She grouped the students into the categories obtaining marks between 0 - 35, 35 - 50, 50 - 60, 60 - 75, 75 and above and formed the following table :
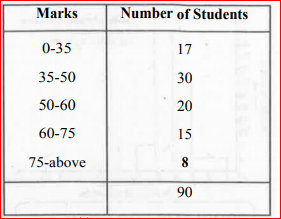 Prepare a histogram to respresent the above data.
View SolutionA teacher analyses the performance of two sections of students in a mathematics test of 100 marks given in the following table :
 : Find the probability that a student obtained less than 20% in the mathematics test.
View Solution