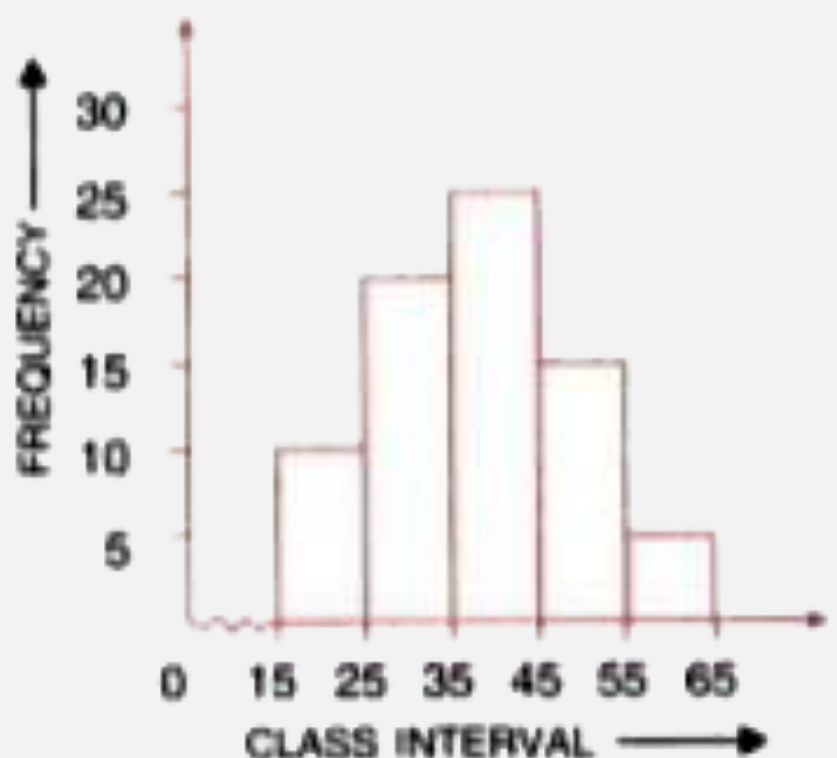
a Use the information given in the adjoining histogram to construct a frequency table.b Use this table to construct an ogive.
b Now plot the points 12 9 16 25 20 47 24 65 28 77 32 81 and join them to obtain an ogive.
Related Solutions
Construction of frequency polygon by using Histogram
View SolutionConstruction of frequency polygon without using Histogram.
View SolutionUsing the information given in the adjoining histogram, calculate the mean.
 View Solution
Construction of a cumulative frequency table is useful in determing the
View SolutionConstruction of cumulative frequency table is useful in determining the
View SolutionAges of 60 teachers in primary schools of a Mandal are given in the following frequency distribution table. Construct the Frequency polygon and frequency curve for the data without using the histogram. (Use separate graph sheets)
View SolutionConstruct a histogram for the following frequency distribution :
 View Solution
Weekly wages of 250 workers in a factory are given in the following table. Construct the histogram and frequency polygon on the same graph for the data given.
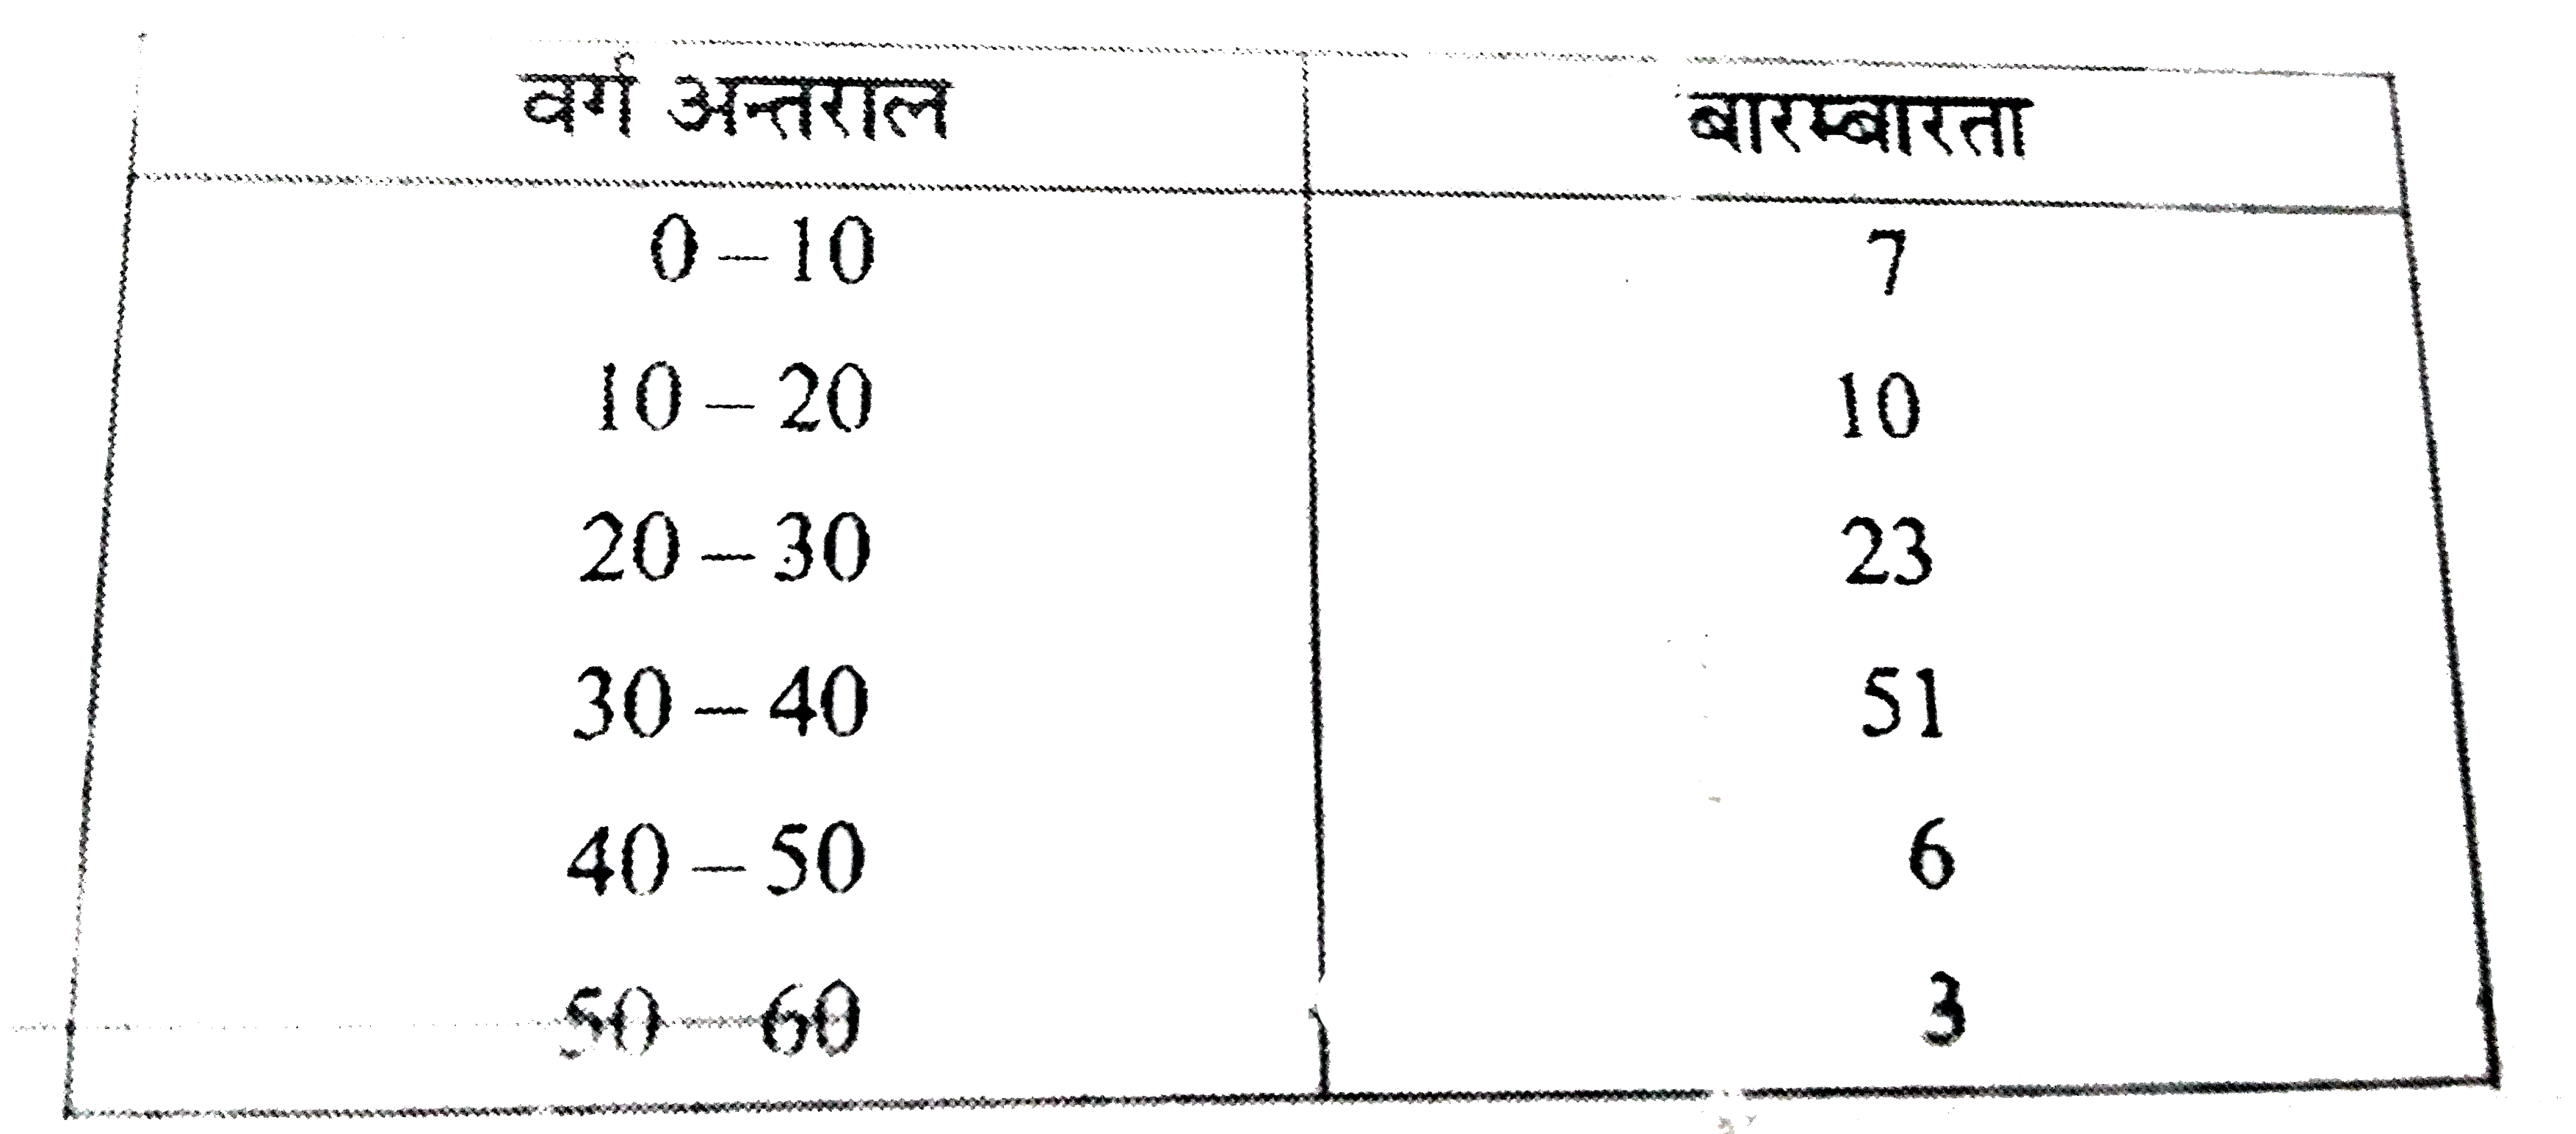
View Solutionदिये हुए बारम्बारता बंटन के लिए संचयी बारम्बारता सारणी बनाइये :
 View Solution
Construction of Histogram of a Continuous grouped frequency distribution
View SolutionFrom the following data, construct frequency histogram, frequency polygon and frequency curve.
View SolutionConstruct a combined histogram and frequency polygon for the following frequency distribution :
 View Solution
Construct class intervals and frequencies for the following distribution table. Also draw the ogive curves for the same.
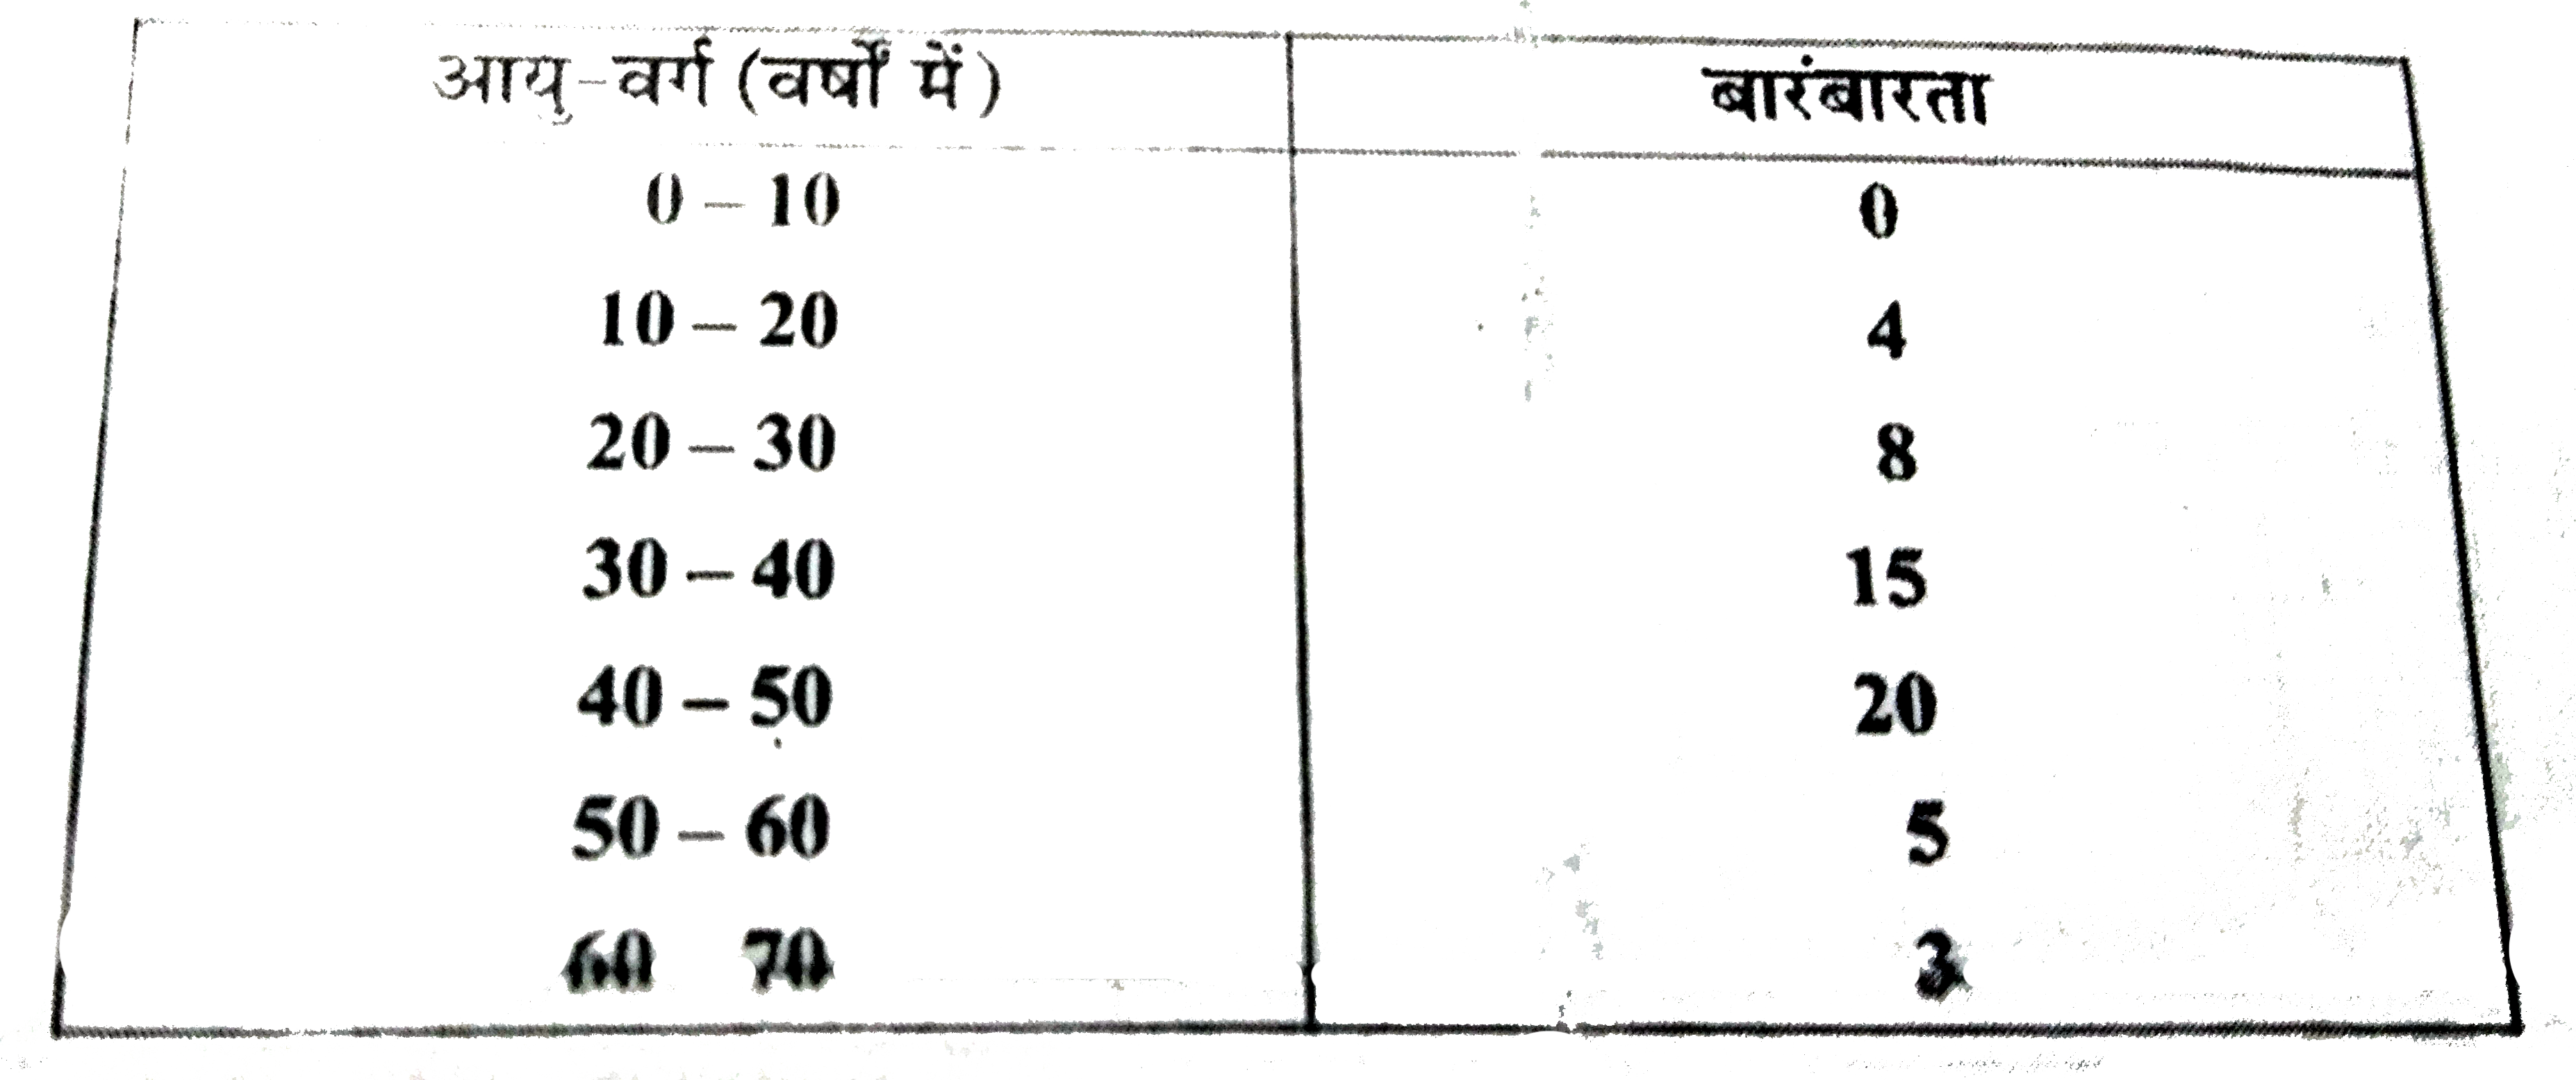
View Solutionनीचे आयु-वर्ग में बच्चों की बारम्बारता दी हुई है :

संचयी बारम्बारता की सारणी बनाइए ।View SolutionIn the fig. there is a histogram depicting daily wages of workers in a factory. Construct the frequency distribution table
View SolutionConstruct a frequency table for the following:
7,8,6,5,6,7,7,9,8,10,7,6,7,8,8,9,10,5,7,8,7,6.View SolutionConstruct a frequency table for the following:
3,2,5,4,1,3,2,2,5,3,1,2,1,1,2,2,3,4,5,3,1,2,3.View SolutionConstructions|Geometrical Tools Used For Constructions|Constructions Of Angles
View SolutionConstruct a histogram for the following data:
View SolutionConstruct a histogram for the following distribution:
 View Solution
