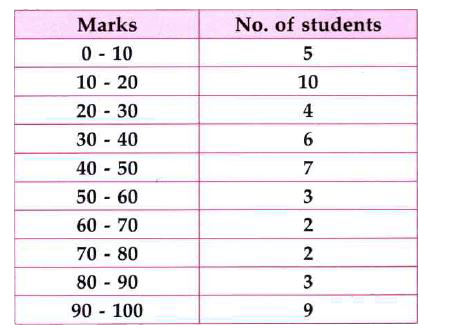
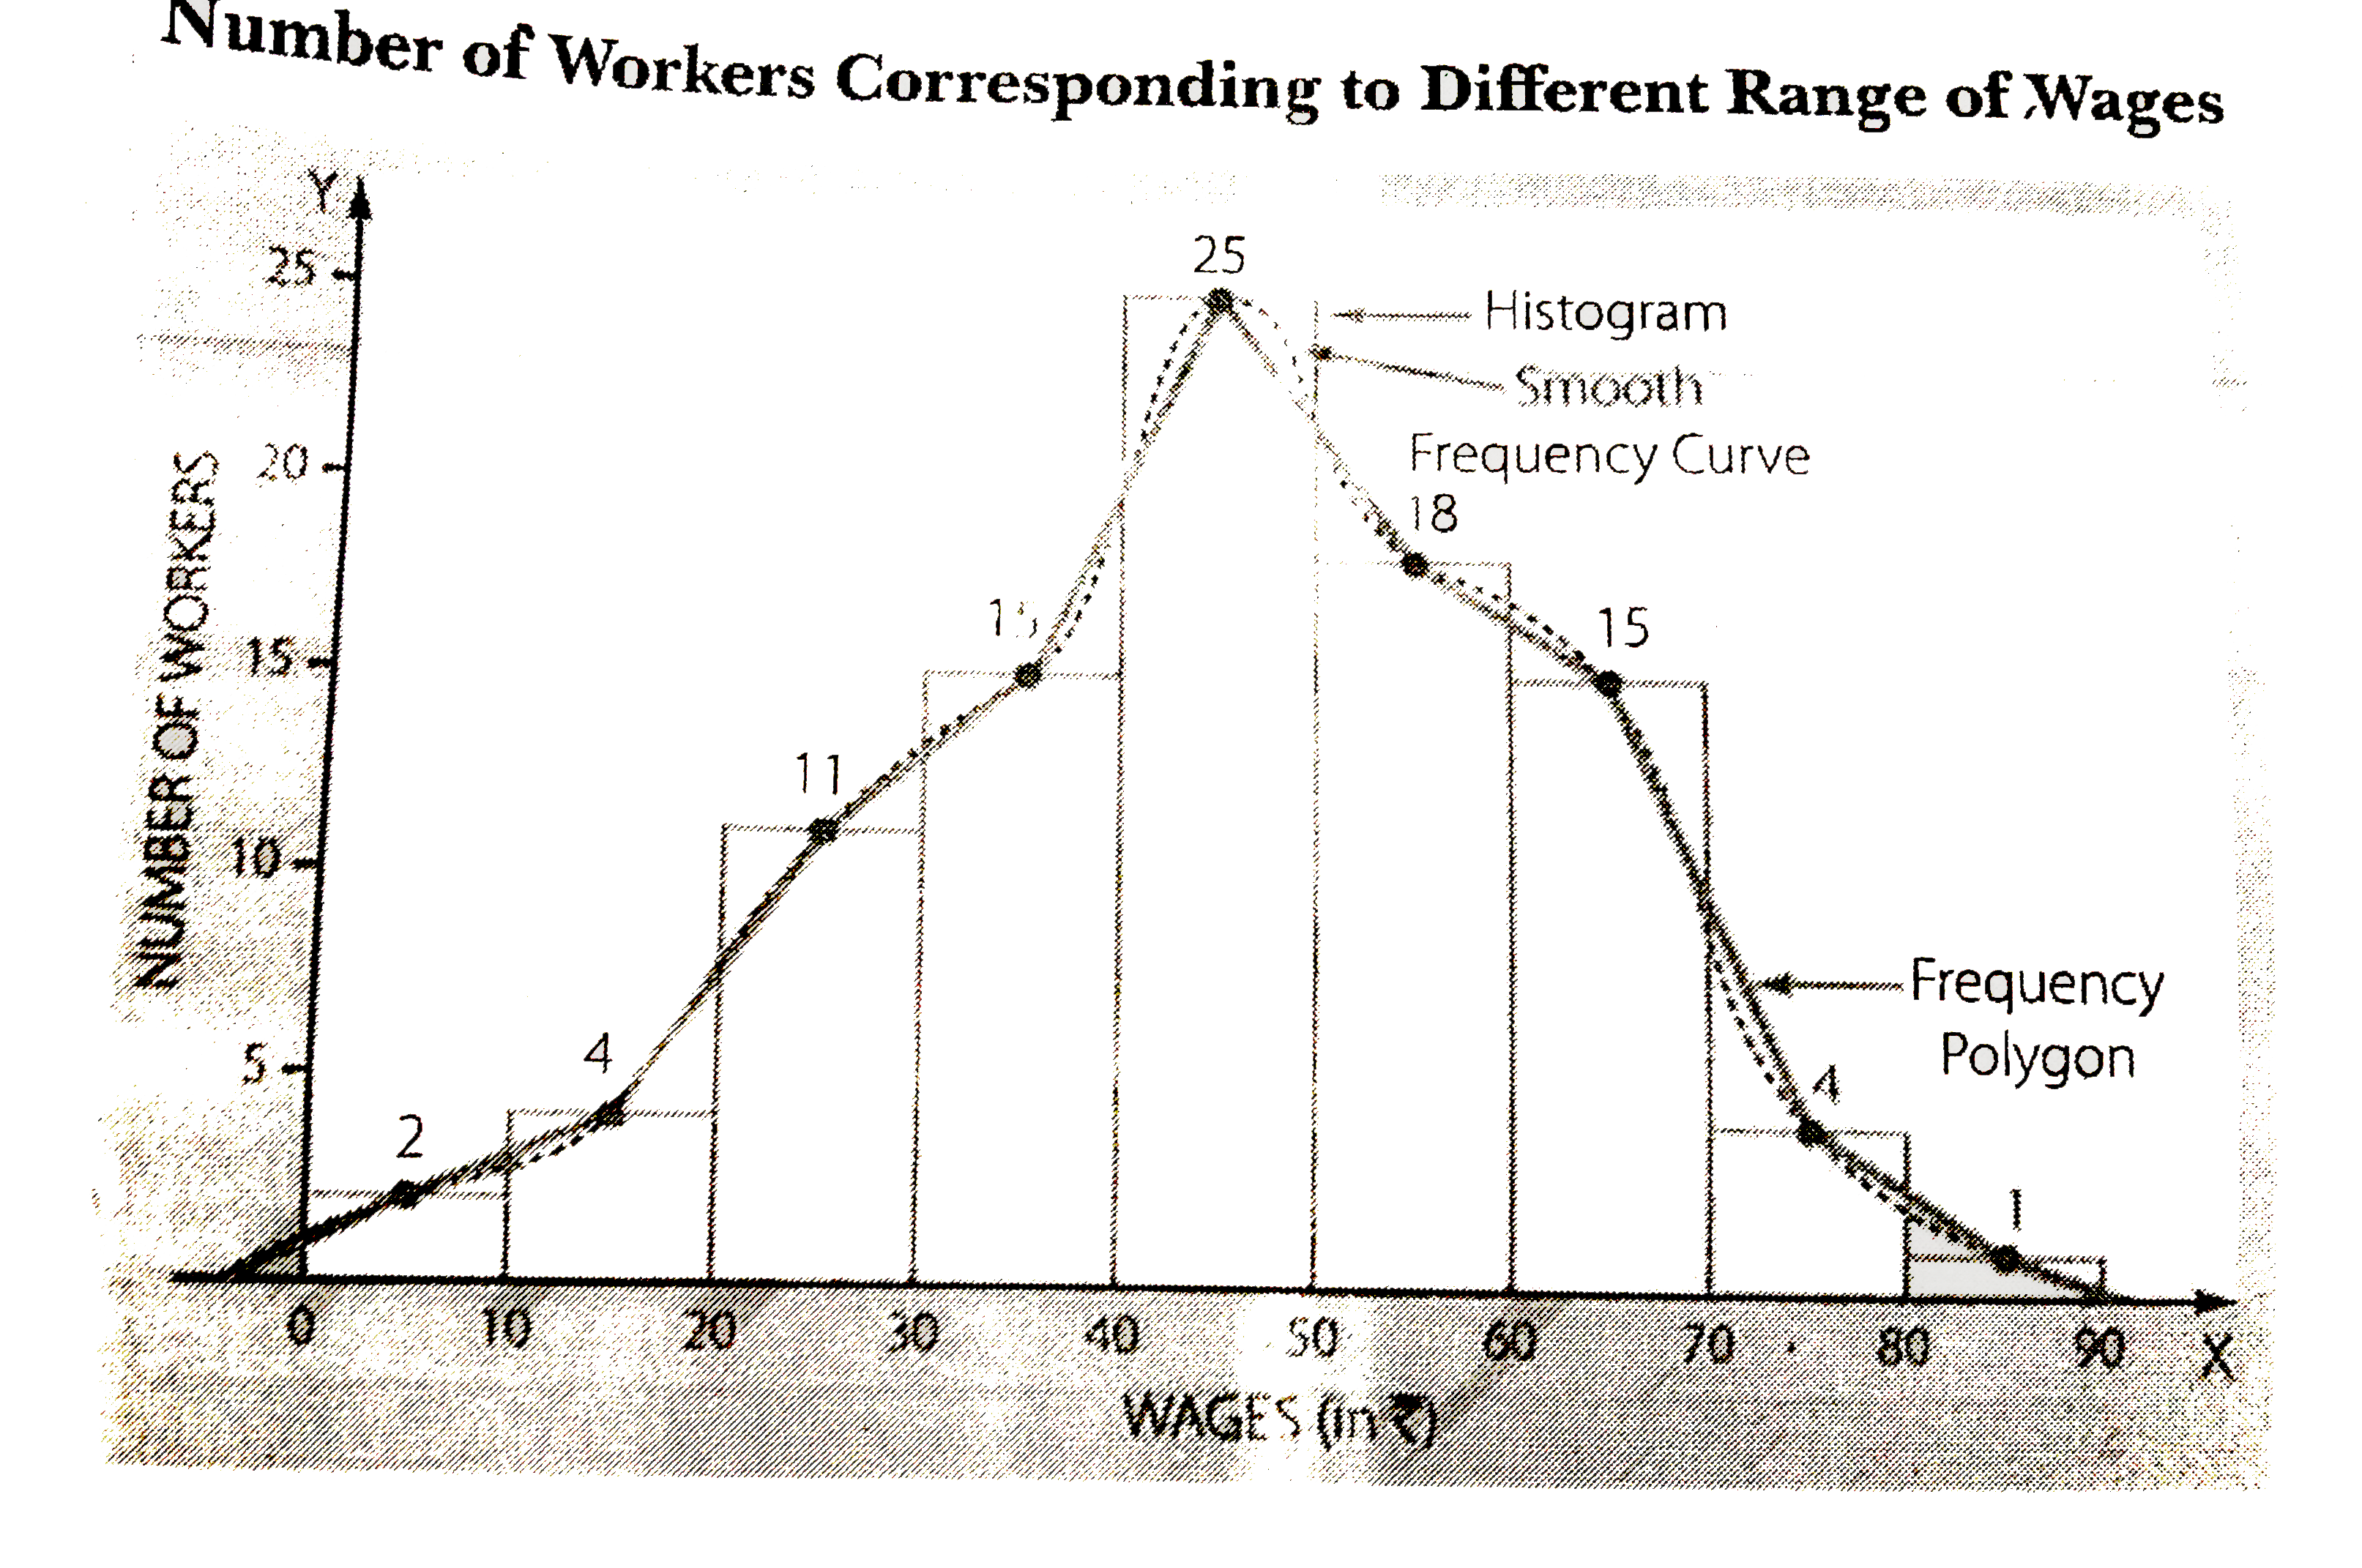
From the following data, construct frequency histogram, frequency polygon and frequency curve.

Video Solution
Text Solution
|
Topper's Solved these Questions
- FREQUENCY DIAGRAMS - HISTOGRAM, POLYGON AND OGIVEBOOK - TARUN JAIN & VK OHRICHAPTER - FREQUENCY DIAGRAMS - HISTOGRAM, POLYGON AND OGIVEEXERCISE - EXERCISE M.C.Q
6 Videos
- FREQUENCY DIAGRAMS - HISTOGRAM, POLYGON AND OGIVEBOOK - TARUN JAIN & VK OHRICHAPTER - FREQUENCY DIAGRAMS - HISTOGRAM, POLYGON AND OGIVEEXERCISE - EXERCISE FILL IN THE BLANK
5 Videos
- FREQUENCY DIAGRAMS - HISTOGRAM, POLYGON AND OGIVEBOOK - TARUN JAIN & VK OHRICHAPTER - FREQUENCY DIAGRAMS - HISTOGRAM, POLYGON AND OGIVEEXERCISE - EXERCISE NCERT
7 Videos
- DIAGRAMMATIC PRESENTATION OF DATA BAR DIAGRAMS AND PIE DIAGRAMSBOOK - TARUN JAIN & VK OHRICHAPTER - DIAGRAMMATIC PRESENTATION OF DATA BAR DIAGRAMS AND PIE DIAGRAMSEXERCISE - NCERT Question (With Hints to Answers)
3 Videos
- INDEX NUMBERSBOOK - TARUN JAIN & VK OHRICHAPTER - INDEX NUMBERSEXERCISE - NCERT Questions (With Hints to Answers)
12 Videos
Similar Questions
For the following data, draw a histogram and a frequency polygon

View SolutionDefine bar graph, histogram, frequency polygon
View SolutionHow is a frequency polygon obtained?
View SolutionDefine frequency polygon.
View SolutionShow the following data by a frequency polygon.

View SolutionShow the following data by a frequency polygon.

View SolutionShow the following data by a frequency polygen.

View SolutionConstruction of two frequency polygon in same axes
View SolutionDraw a histogram, a frequency polygon and frequency curve of the following data :

View SolutionRepresent the following data by frequency curve :

View Solution

