The given graphs show the variation of intensity of magnetization I with a strength of applied magnetic field H for two magnetic materials p and Q.i Identify the materials P and Q.ii For material B plot the variation of intensity of magnetization with temperature. justify your answer.
i P- paramagnetic materialii Q Ferromagnetic material
Related Solutions
The following figure shows the variation of intensity of magnetisation I versus the applied magnetic field intensity H, for two magnetic materials A and B
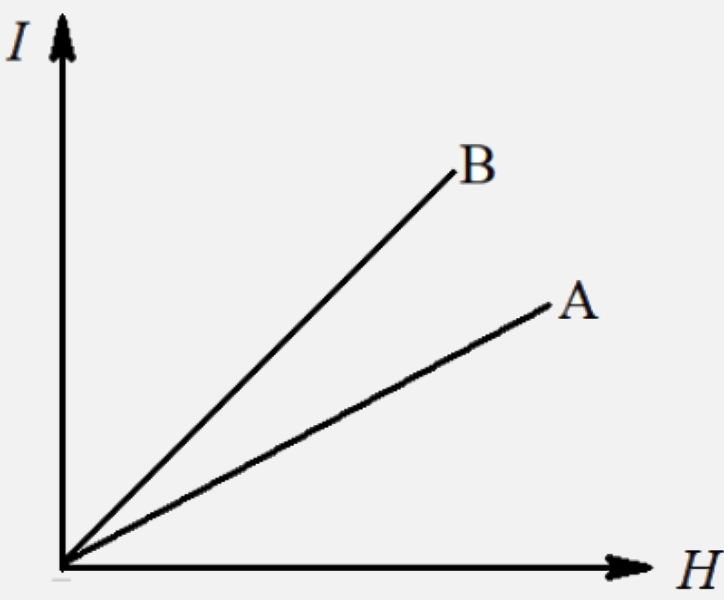
Which of the material have a larger susceptibility for a given field at constant temperature?
View SolutionThe following figure shows the variation of intensity of magnetisation I versus the applied magnetic field intensity H, for two magnetic materials A and B Which of the material have a larger susceptibility for a given field at constant temperature?
View SolutionThe following figure shows the variation of intensity of magnetisation verses the applied field intensity H for three magnetic materials A and B and C indentify the materials A and B and C
View SolutionThe following figure shows the variation of intensity of magnetisation versus the applied magnetic field intensity, H, for two magnetic materials A and B : (a) Identify the materials A and B. (b) Why does the material B, have a larger susceptibility than A, for a given field at constant temperature?
View SolutionThe following figure shows the variation of intensity of magnetisation versus the applied magnetic field intensity, H, for two magnetic materials A and B : (a) Identify the materials A and B. (b) Why does the material B, have a larger susceptibility than A, for a given field at constant temperature?
View SolutionDraw the variation of magnetic field(B) with magnetic intensity(H) when ferromagnetic material is subjected to a cycle of magnetisation.
View SolutionDraw the variation of magnetic field(B) with magnetic intensity(H) when ferromagnetic material is subjected to a cycle of magnetisation.
View Solutionचित्र 8.33 में दो पदार्थों A और B के लिए लगाई गई चुम्बकीय क्षेत्र तीव्रता H के साथ चुम्बकन की तीव्रता M का परिवर्तन दिखाया गया है।
(a) पदार्थों A और B की पहचान करें।
(b) पदार्थ A के लिए ताप के साथ चुम्बकन तीव्रता के परिवर्तन का ग्राफ़ बनाए।
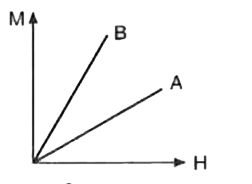
View SolutionThe following figure shows the variation of intensity of magnetisation with the applied magnetic field intensity for three magnetic materials X, Y and Z. Identify the materials X, Y and Z.
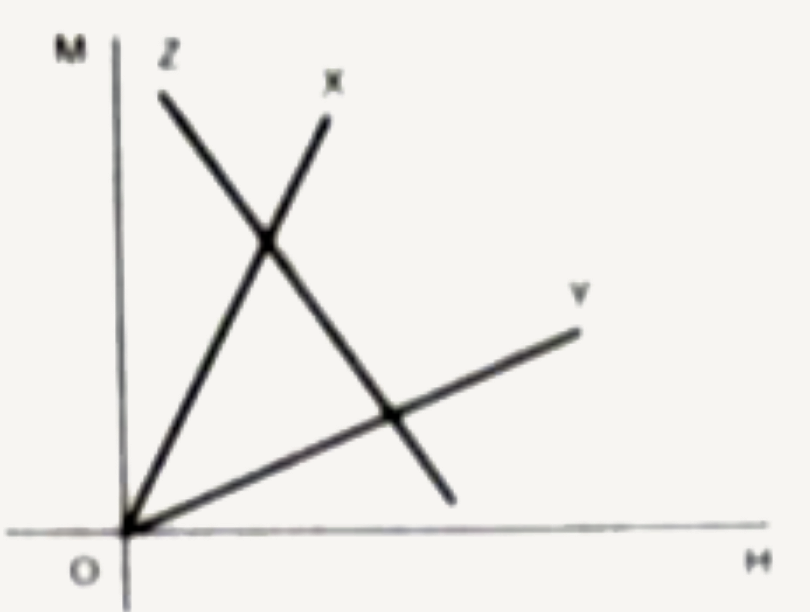
View SolutionThe following figure shows the variation of intensity of magnetisation with the applied magnetic field intensity for three magnetic materials X, Y and Z. Identify the materials X,Y and Z.
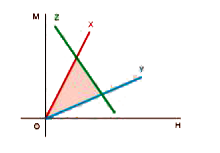
View SolutionThe ratio of the magnetic field at a point in a material to the magnetic ……. Of the material is called the intensity of the magnetic field at that point.
View Solutionकिसी प्रतिचुम्बकीय पदार्थ के लिए चुम्बकन तीव्रता (l) का चुम्बकीय क्षेत्र (H) के साथ परिवर्तन किस ग्राफ से प्रदर्शित होगा?
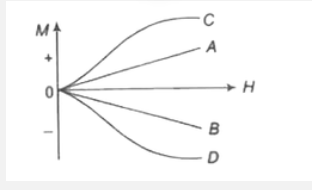
View SolutionThe magnetic tendency of a magnetic material depends on the temperature and intensity of the magnetic field. That substance is:
View SolutionThe magnetic induction and magnetising field intensity in a sample of magnetic material are B and H respectively . The magnetic susceptibility of the material is
View SolutionThe magnetic induction and magnetising field intensity in a sample of magnetic material are B and H respectively . The magnetic susceptibility of the material is
View Solutionनिम्न चित्र दो चुंबकीय पदार्थों A और B के लिए चुंबकीय तीव्रता H के विरुद्ध चुंबकन तीव्रता M में परिवर्तन को प्रदर्शित करता है।
(a) पदार्थ A और B की पहचान कीजिए।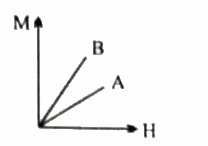
View SolutionThe intensity of magnetization of the magnetic fields graph for a diamagnetic material is best represented by.
View SolutionFigure shows the variation of intensity of magnetisation vecM versus the applied magnetic field intensity vecH for two materials A and B: (a) Identify the materials A and B. (b) Why does the material B, have a larger susceptibility than A for a given field at constant temperature ?
View Solutionनिम्न चित्र दो चुंबकीय पदार्थों A और B के लिए आरोपित चुंबकीय तीव्रता H के विरुद्ध चुंबकन तीव्रता M में परिवर्तन को प्रदर्शित करता है।
Q (ii) पदार्थ A के लिए ताप के साथ चुंबकन तीव्रता में परिवर्तन को प्रदर्शित करने वाला ग्राफ खींचिए।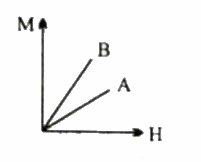
View Solutionचित्र 8.33 में दो पदार्थों A और B के लिए लगाई गई चुम्बकीय क्षेत्र तीव्रता H के साथ चुम्बकन की तीव्रता M का परिवर्तन दिखाया गया है।
(a) पदार्थों A और B की पहचान करें।
(b) पदार्थ A के लिए ताप के साथ चुम्बकन तीव्रता के परिवर्तन का ग्राफ़ बनाए।

View Solution