एक टेलीविजन सेट निर्माता ने तीसरे वर्ष में 6000 नग तथा सातवें वर्ष में 7000 नग बनाए। यह मानते हुए कि उत्पादन समान दर से प्रतिवर्ष एक निश्चित संख्या में बढ़ता है, ज्ञात कीजिए
(i) प्रथम वर्ष का उत्पादन,
(ii) 7 वर्षों में कुल उत्पादन तथा
(iii) 10वें वर्ष में उत्पादन।
The correct Answer is:7750
Topper's Solved these Questions
- समांतर श्रेढ़ी BOOK - BHARATI BHAWANCHAPTER - समांतर श्रेढ़ी EXERCISE - प्रश्नमाला 5A
16 Videos
- समांतर श्रेढ़ी BOOK - BHARATI BHAWANCHAPTER - समांतर श्रेढ़ी EXERCISE - प्रश्नमाला 5B
32 Videos
- वृत्तों से संबंधित क्षेत्रफलBOOK - BHARATI BHAWANCHAPTER - वृत्तों से संबंधित क्षेत्रफलEXERCISE - प्रश्नमाला 15D (बहुवैकल्पिक प्रश्न)
20 Videos
- सांख्यिकी (माध्य, बहुलक, माध्यक तथा तोरण)BOOK - BHARATI BHAWANCHAPTER - सांख्यिकी (माध्य, बहुलक, माध्यक तथा तोरण)EXERCISE - प्रश्नमाला 17F (बहुवैकल्पिक प्रश्न)
15 Videos
Similar Questions
सिद्ध कीजिए कि प्रत्येक श्रेढ़ी एक समांतर श्रेढ़ी है। प्रत्येक श्रेढी का प्रथम पद तथा सार्वअंतर लिखिए। इनमें प्रत्येक के अगले दो पद लिखिए।
8, 13, 18,23,28, ....
View Solutionसमांतर श्रेदी √2,3√2,5√2,… का 12वाँ पद.ज्ञात कीजिए।
View Solutionयदि एक वृत्त की परिधि 80 है, तो इसका क्षेत्रफल है-
View Solutionसंचयी-बारंबारता सारणी की रचना करना निम्नलिखित में किसकी गणना में उपयो होता है?
View Solutionसमतल में गति से पिछले वर्ष आये हुए महत्वपूर्ण प्रश्न
View Solutionऔद्योगिक उत्पादन में सूक्ष्मजीव
View SolutionThe table shows the production of different types of cars (in thousands)
यह तालिका अलग-अलग प्रकार के कारों का उत्पादन ( हज़ार में ) दर्शाती है |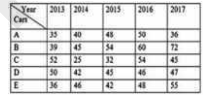 The production of cars of type A in 2015 and of type C in 2013 taken together is approximately what percent of the total production of cars of type D in five years?
2015 में A प्रकार की कारों का उत्पादन तथा 2013 में C प्रकार की कारों के उत्पादन को मिला दिया जाए, तो ये पांच वर्षों में D प्रकार की कारों के कुल उत्पादन का लगभग कितना प्रतिशत है ?
View SolutionThe table shows the production of different types of cars (in thousands).
यह तालिका एक कंपनी द्वारा अलग-अलग कारों के उत्पादन ( हज़ार में ) को दर्शाती है |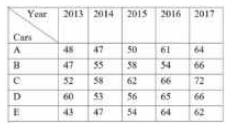 The total production of type B cars in 2015 and type C cars in 2013 is what percent more than the total production of type E cars in 2013 and 2014 ? (Correct to one decimal place)
2015 में B प्रकार तथा 2013 में प्रकार की कारों का कुल उत्पादन 2013 तथा 2014 में E प्रकार की कारों के कुल उत्पादन से कितना प्रतिशत अधिक है ? (एक दशमलव स्थान तक)
View SolutionThe table shows the production of different types of cars (in thousands). यह तालिका एक कंपनी द्वारा अलग-अलग कारों के उत्पादन (हज़ार में ) को दर्शाती है | The total production of type B cars in 2015 and type D cars 2016 is what percent less than the total production of type E cars in five years? 2015 में B प्रकार तथा 2016 में D प्रकार की कारों का कुल उत्पादन पांच वर्षों में E प्रकार की कारों के कुल उत्पादन से कितना प्रतिशत कम है?
View SolutionTable shows the production of rice (in million tonnes) of three states over six years. यह तालिका तीन राज्यों में छः वर्षों में दौरान चावल के उत्पादन ( मिलियन टन में ) को दर्शाती है | What is the ratio of the production of rice in all three states in the year 2014 to that in 2016? सभी तीन राज्यों में वर्ष 2014 तथा 2016 में उत्पादित चावल की मात्रा में अनुपात ज्ञात करें |
View SolutionThe bar chart shows the annual food grain production (in million tonnes) for years 2012-2017. For how many years is the production less than the average production during the given period? यह दंड आरेख वर्ष 2012-2017 की अवधि में वार्षिक खाद्यान्न उत्पादन (मिलियन टन में ) को दर्शाता है | कितने वर्ष उत्पादन इस अवधि के औसत उत्पादन से कम है ?
View SolutionThe table given below presents the figures of the production (in thousands) of different types of vehicles by a company during the year 2013-18.
नीचे दी गयी तालिका वर्ष 2013-18 के दौरान एक कंपनी के द्वारा विभिन्न प्रकार के वाहनों के उत्पादन ( हज़ार में)के आंकड़ों को प्रस्तुत करती है |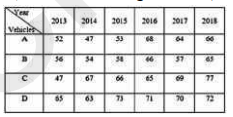 In how many years is the production of type C vehicles, below the average production of type D vehicles over six years?
कितने वर्ष C प्रकार के वाहनों का उत्पादन इन छः वर्षों में D प्रकार के वाहनों के औसत उत्पादन से कम रहा है ?
View SolutionIn the following table, the production of various crops (in tonnes) is given from 2015 to 2019. Study the table and answer the question that follows:
दी गयी तालिका में, 2015 से 2019 तक विभिन्न फसलों का उत्पादन (टन में ) दिया गया है | इस तालिका का अध्ययन करें तथा फिर पूछे गए प्रश्न का उत्तर दीजिए |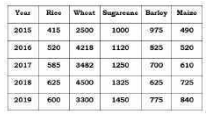 The percentage growth of maize in the year 2019 over the year 2015 is: (correct to one decimal place)
वर्ष 2019 में वर्ष 2015 की तुलना में मक्का के उत्पादन में कितने प्रतिशत की वृद्धि हुई है ? ( दशमलव के एक स्थान तक )
View Solutionबायोगैस के उत्पादन में सूक्षम जीव|OMR
View SolutionWhat was the approximate decline in the prodcution of flavour R in 2010 as compared to the production of 2008 in percentage?
वर्ष 2008 की तुलना में वर्ष 2010 में गन्ध R के उत्पादन में कितने प्रतिशत की कमी आई थी?
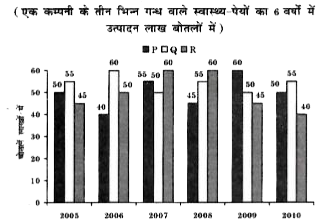
View SolutionThe percentage of the total production of flavour R in 2007 and 2008 with respect to the production of flavour P in 2005 and 2006 is : वर्ष 2007 तथा 2008 में गन्ध R का कुल उत्पादन, वर्ष 2005 तथा 2006 में गन्ध P के उत्पादन की तुलना में कितने प्रतिशत रहा है?
View Solution
