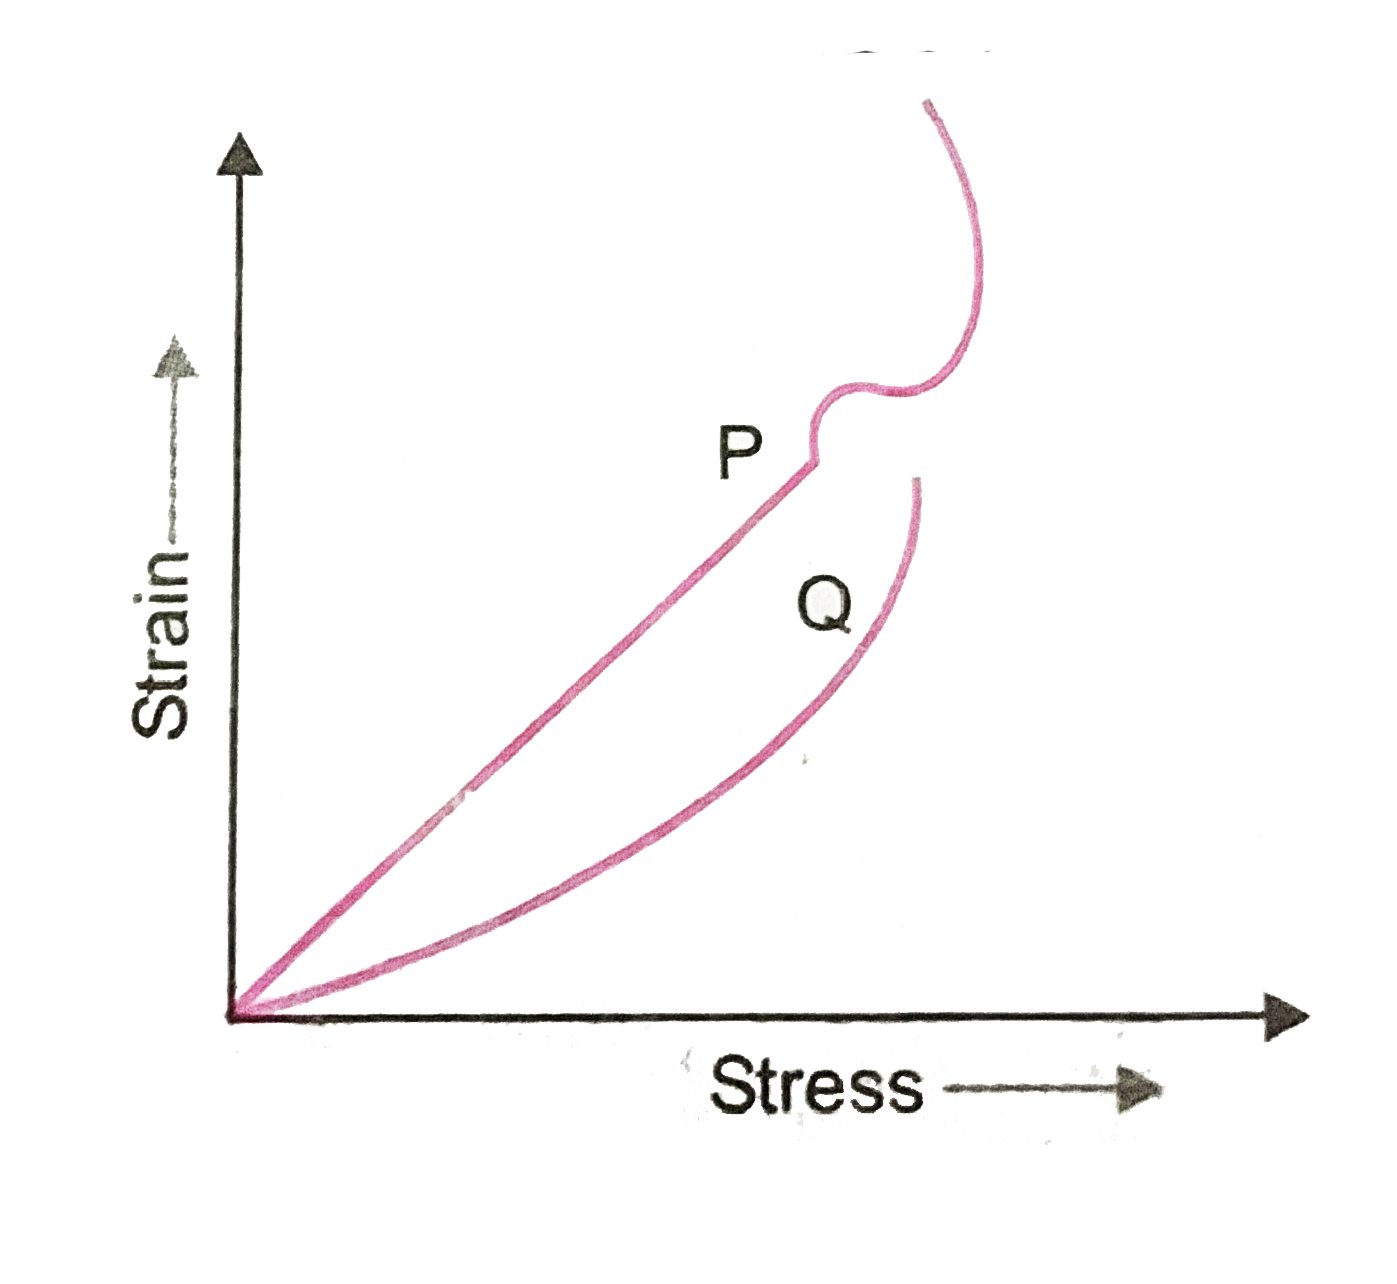
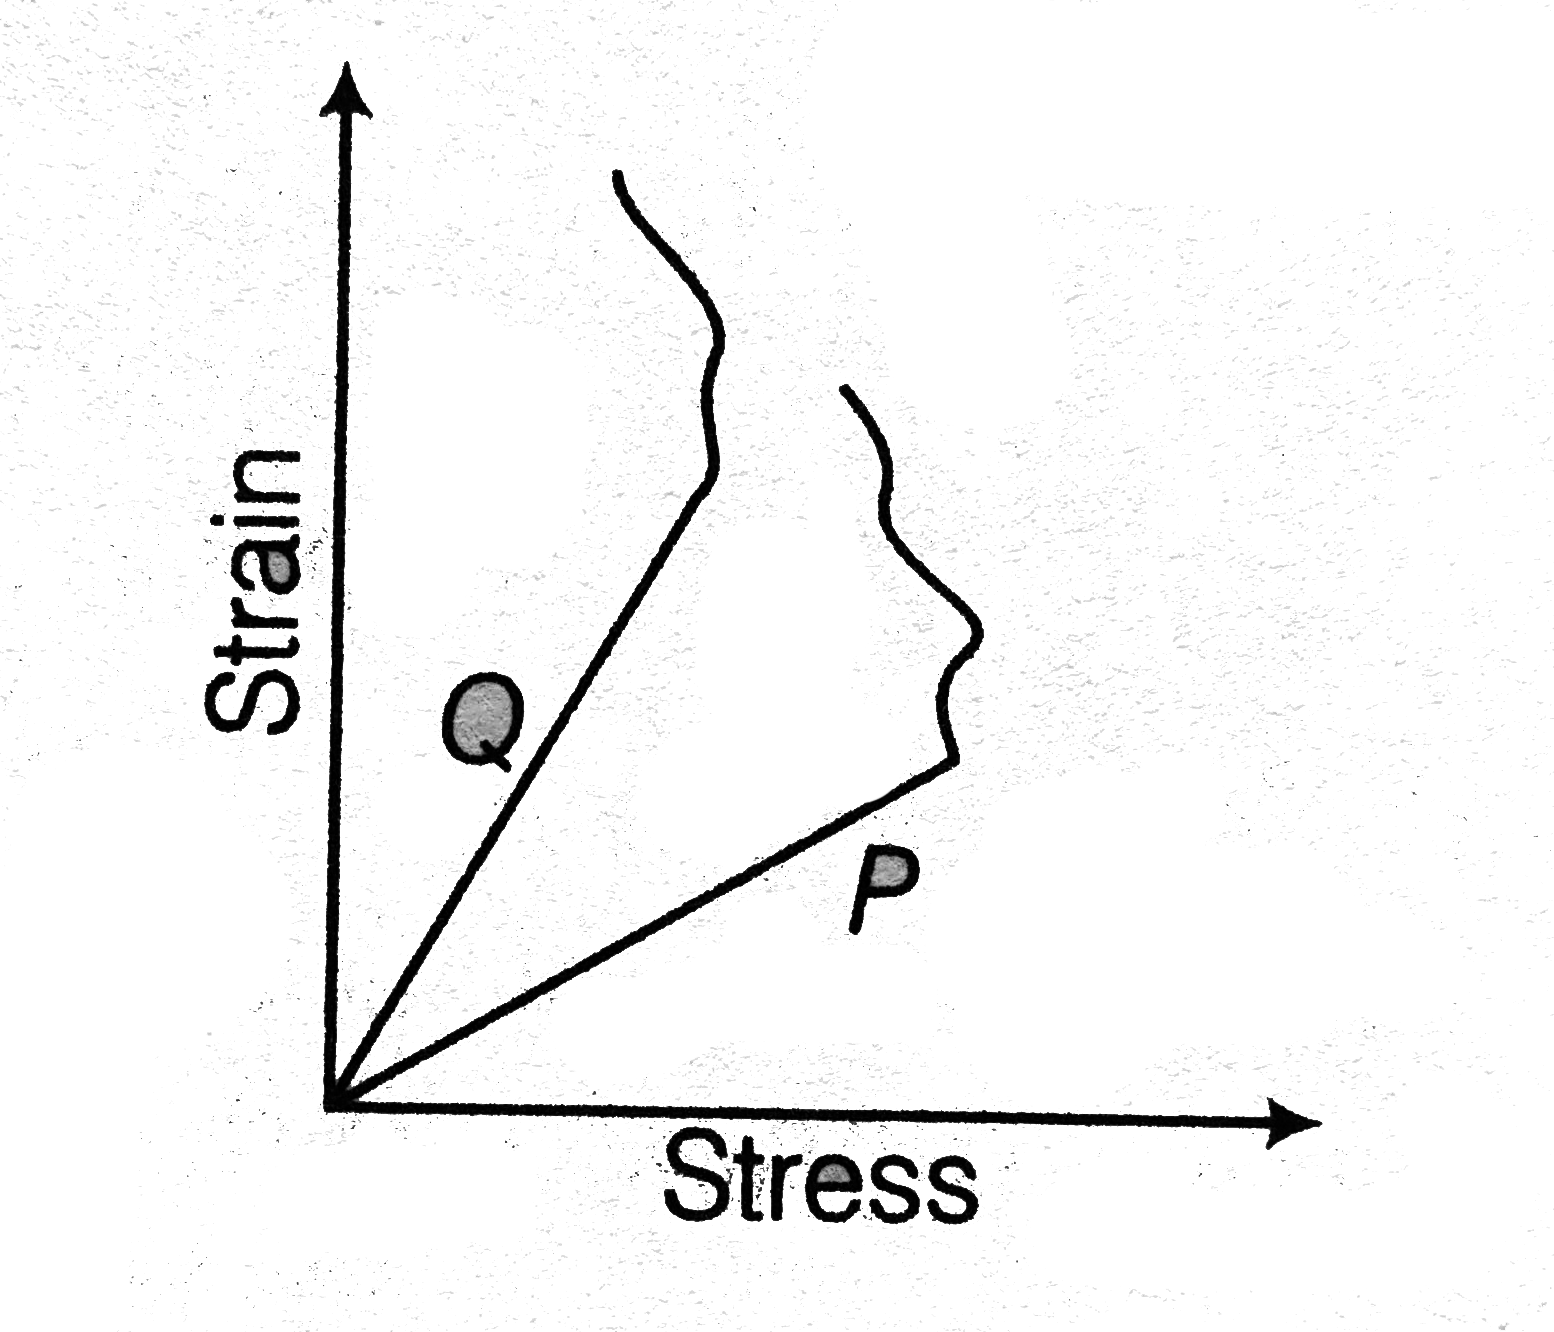
In plotting stress versus strain curves for two material P and Q, a student by mistake puts strain on the y-axis stress on ther x-axis as shown in the figure. Then the correct statement is/are
A
(a) P has more tensile strength than Q
B
(b) P is more ductile than Q
C
(c) P is more brittle than Q
D
(d) The Young's modulus of P is more than that of Q
Video Solution
Text Solution
The correct Answer is:B, C
The maximum stress that P can withstand before breaking is greater than Q. Therefore (A) is a correct option.
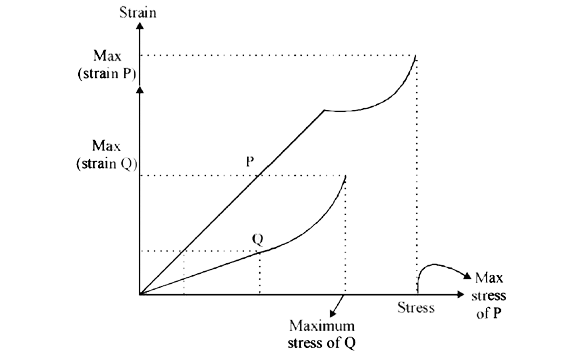
The stain of P is more than Q therefore P is more ductile. Therefore (B) is a correct option.
Y=stressstrain
For a given strain, stress is more for Q. Therefore YQ>YP.
|
Topper's Solved these Questions
- MECHANICAL PROPERTIES OF MATTER AND FLUIDSBOOK - SUNIL BATRA (41 YEARS IITJEE PHYSICS)CHAPTER - MECHANICAL PROPERTIES OF MATTER AND FLUIDSEXERCISE - Subjective Problems
1 Videos
- LAWS OF MOTIONBOOK - SUNIL BATRA (41 YEARS IITJEE PHYSICS)CHAPTER - LAWS OF MOTIONEXERCISE - JEE Main And Advanced
79 Videos
- MOMENTUM & IMPULSEBOOK - SUNIL BATRA (41 YEARS IITJEE PHYSICS)CHAPTER - MOMENTUM & IMPULSEEXERCISE - JEE Main And Advanced
30 Videos
Similar Questions
Knowledge Check
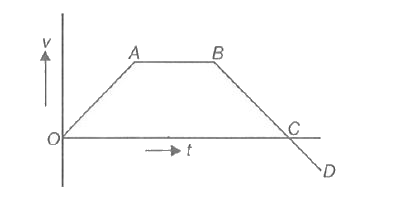
For a particle moving along x-axis, a scaled x-6 graph is shown in figure. Mark the correct statement (s).
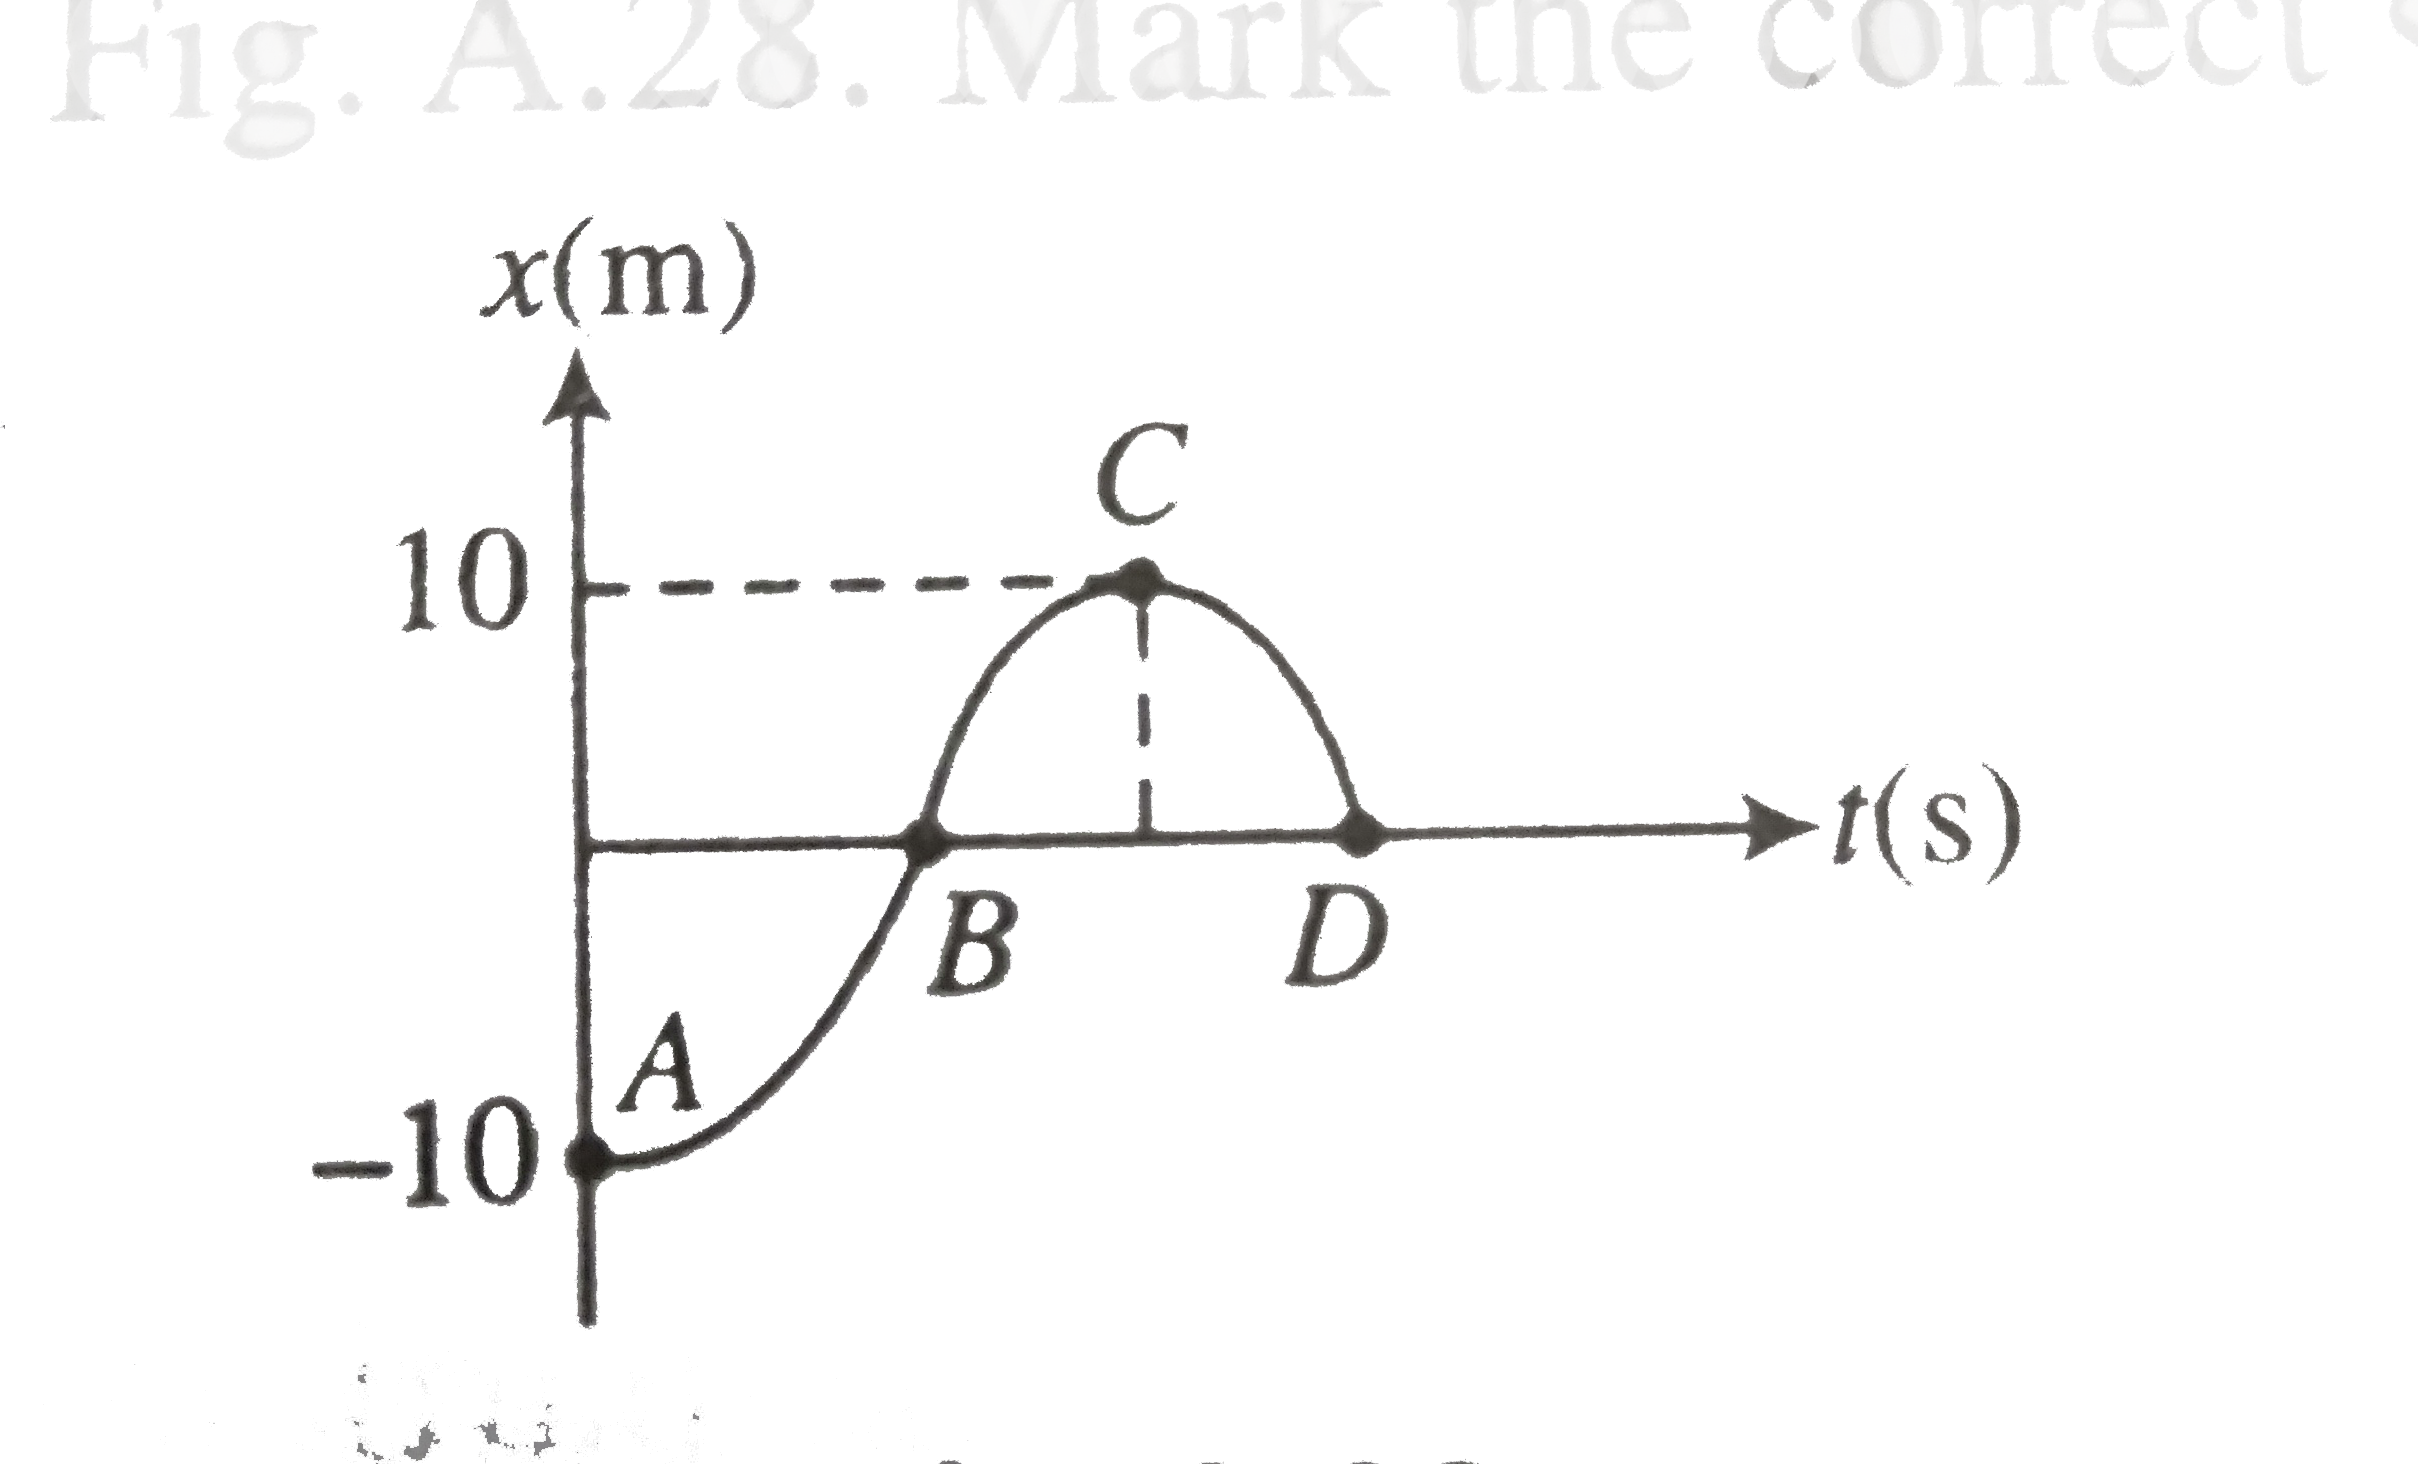 ASpeed of the particle is greatest at C.BSpeed of the particle is greatest at B.CParticle is speeding up in region marked CD.DParticle is speeding up in region marked AB.
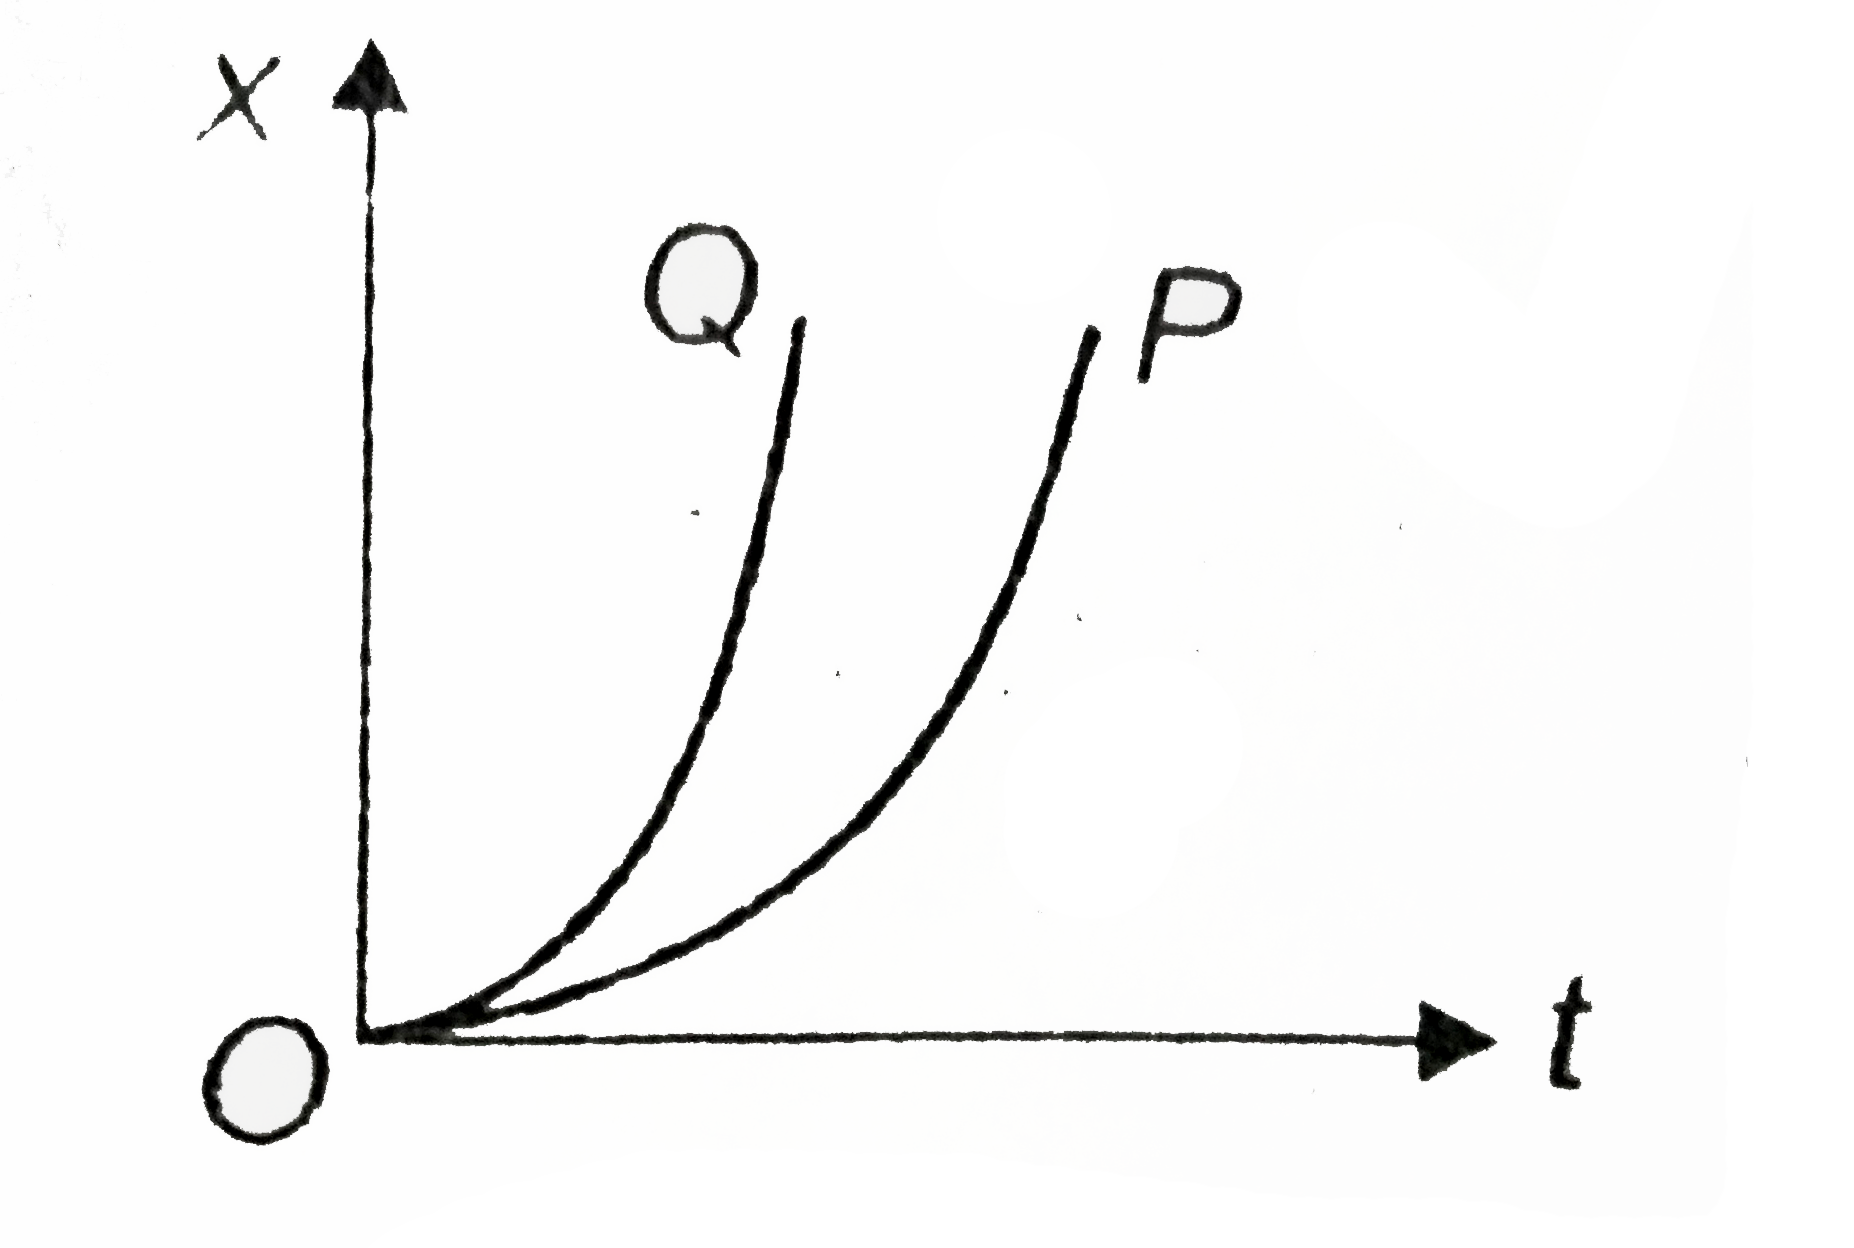
Displacement versus time curve for a particle executing SHM is shown in figure. Choose the correct statements.
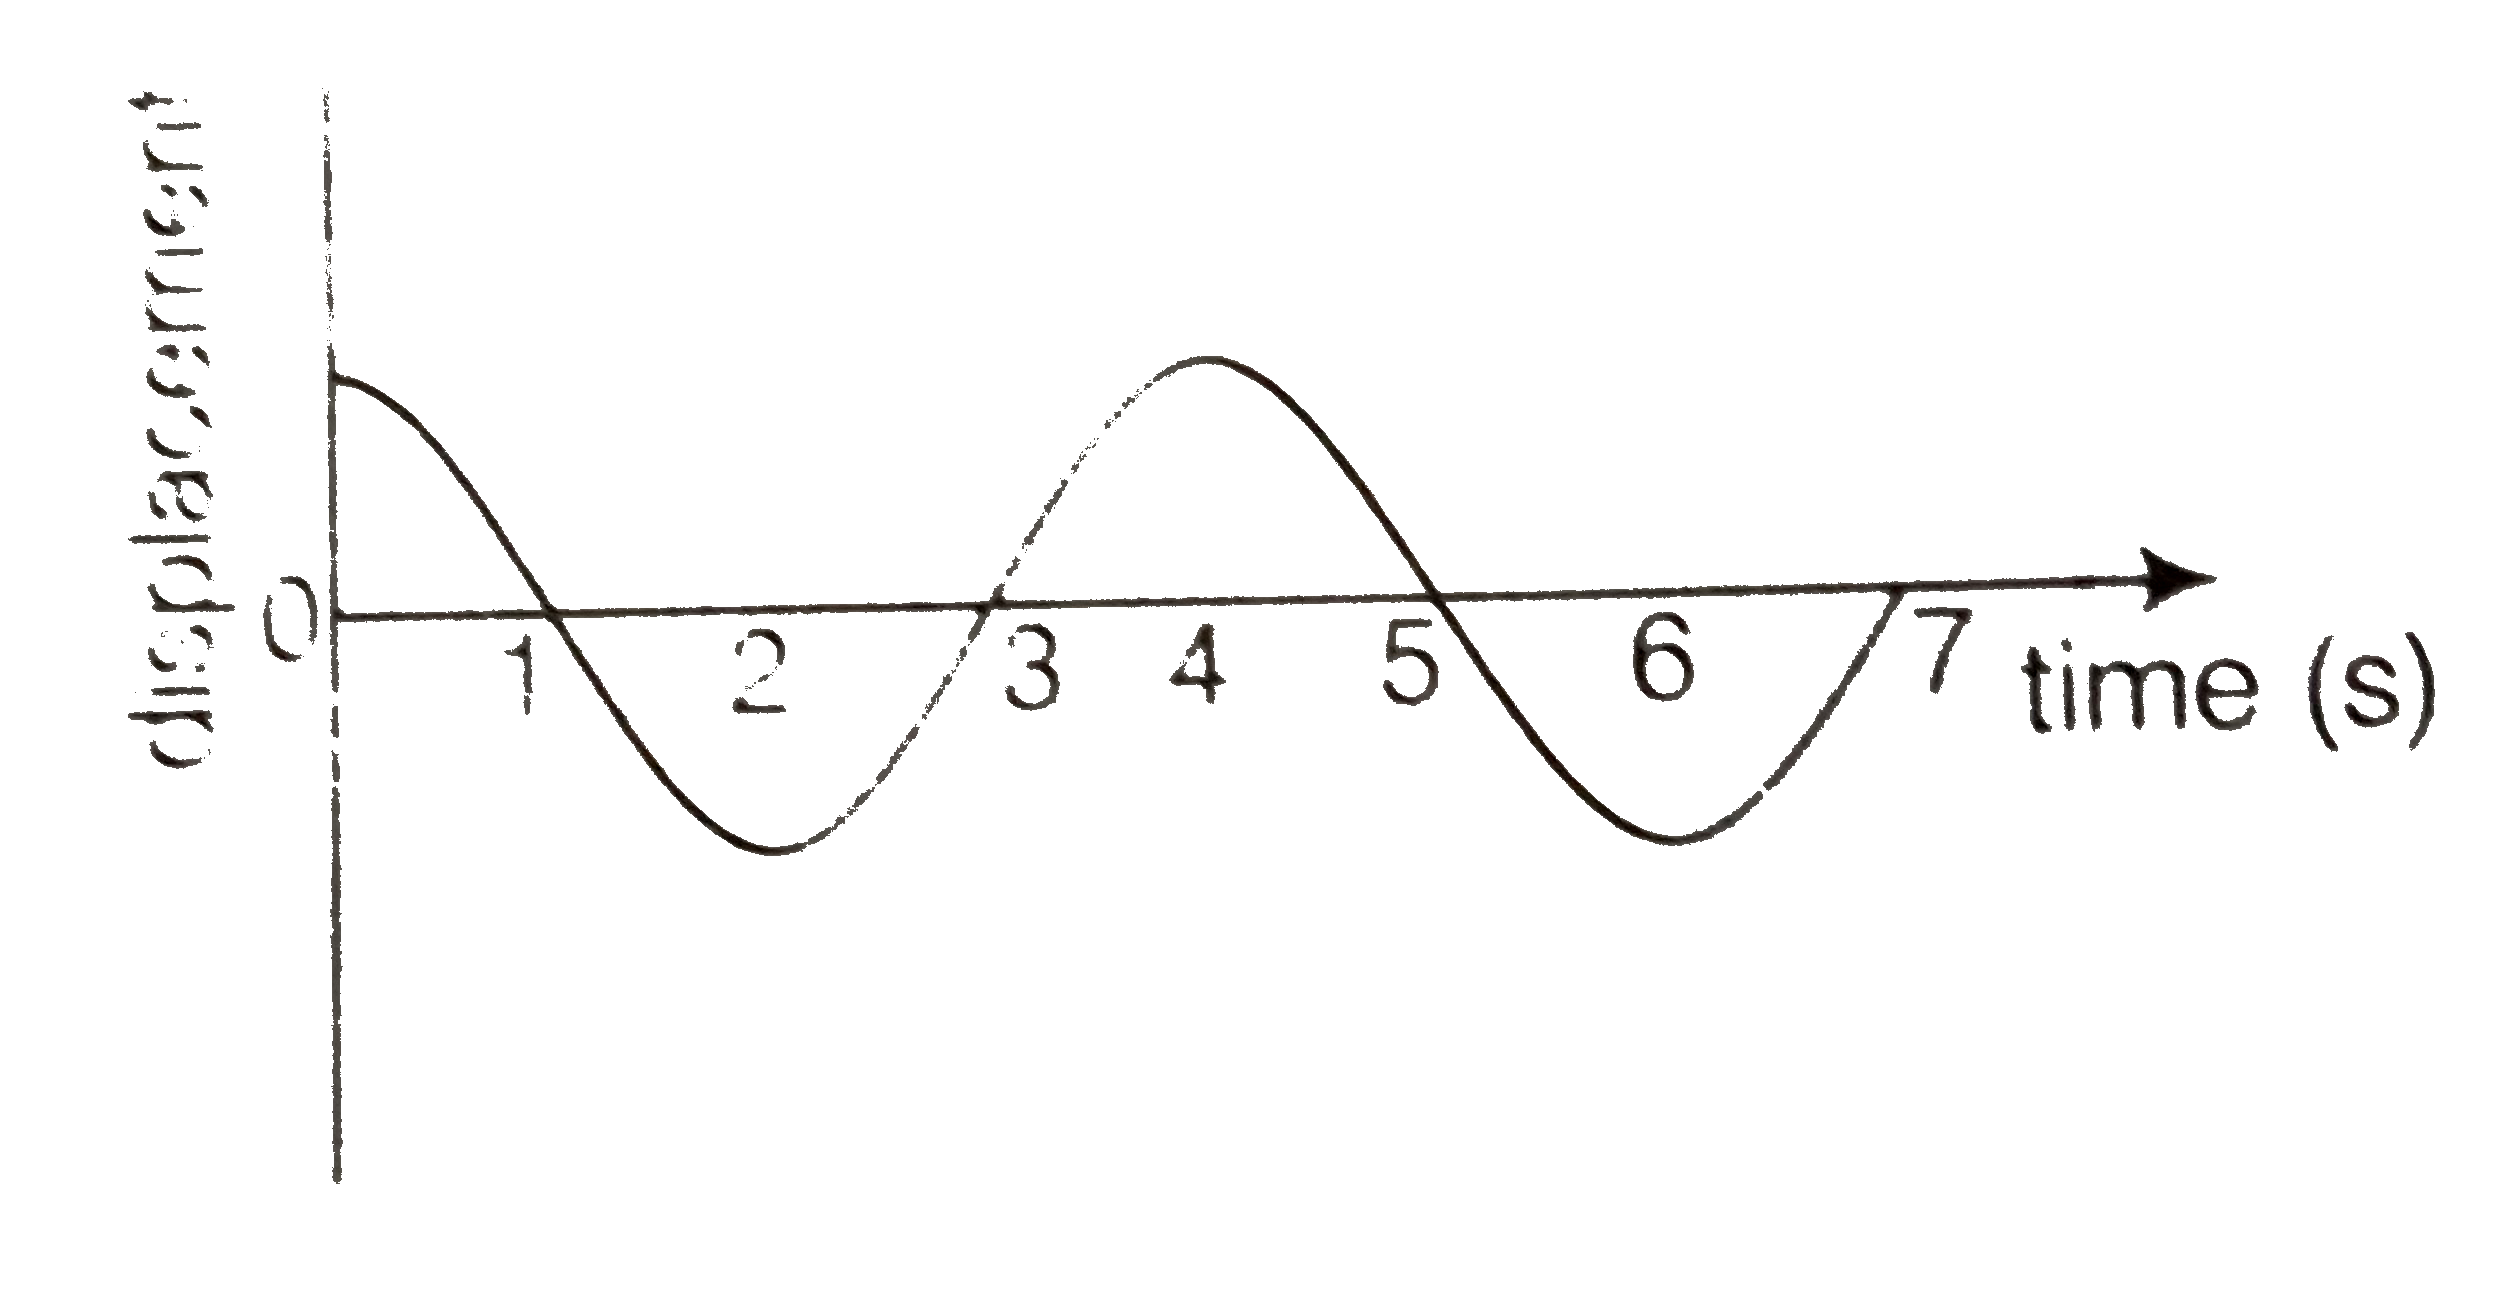 A(a) Phase of the oscillator is same at t=0s and t=2sBPhase of the oscillator is same at t=2s and t=6sCPhase of the oscillator is same at t=1sand t=7sDPhase of the oscillator is same at t=1sand t=5s
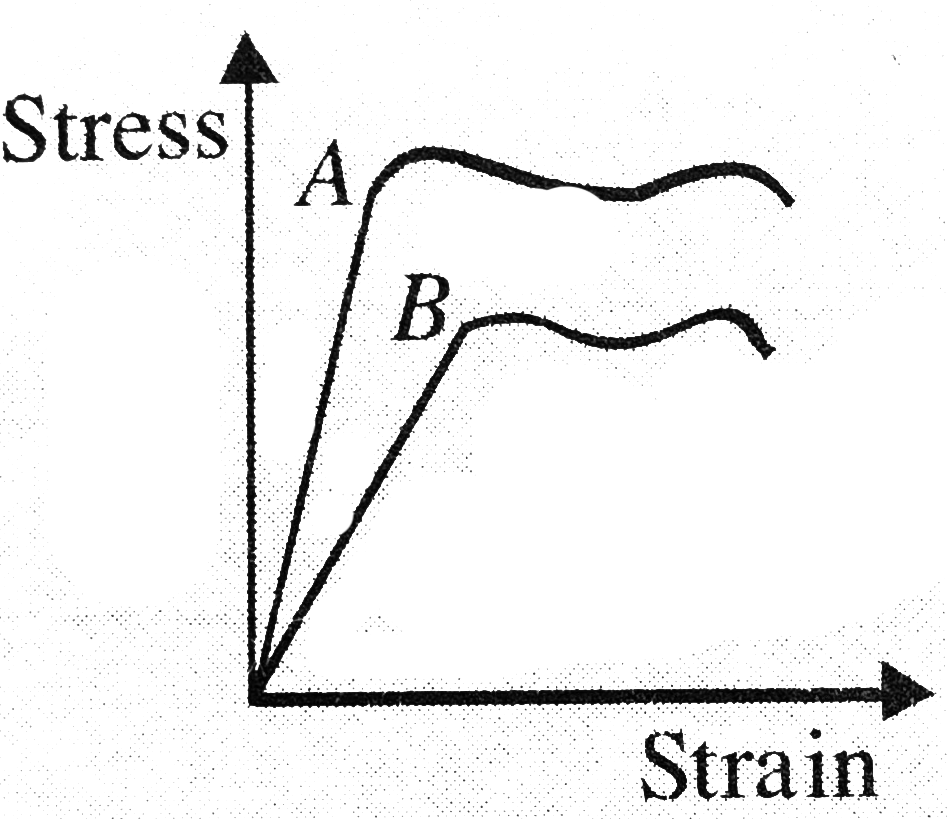
The diagram shows stress v/s strain curve for the materials A and B. From the curves we infer that
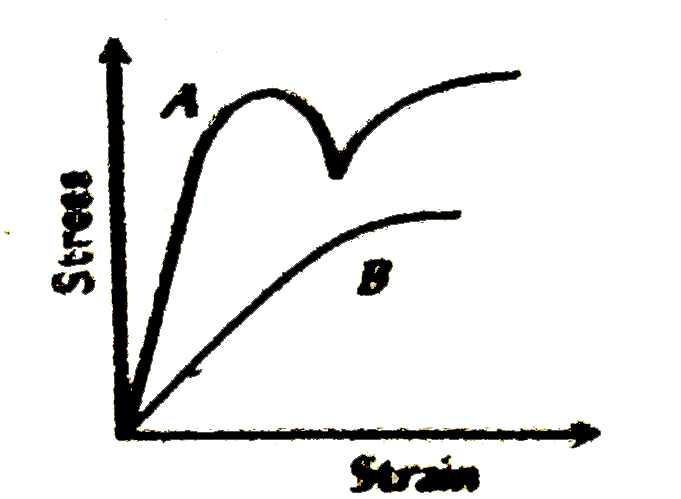 AA is brittle but B is ductileBA is ductile and B is brittleCBoth A and B are ductileDBoth A and B are brittle
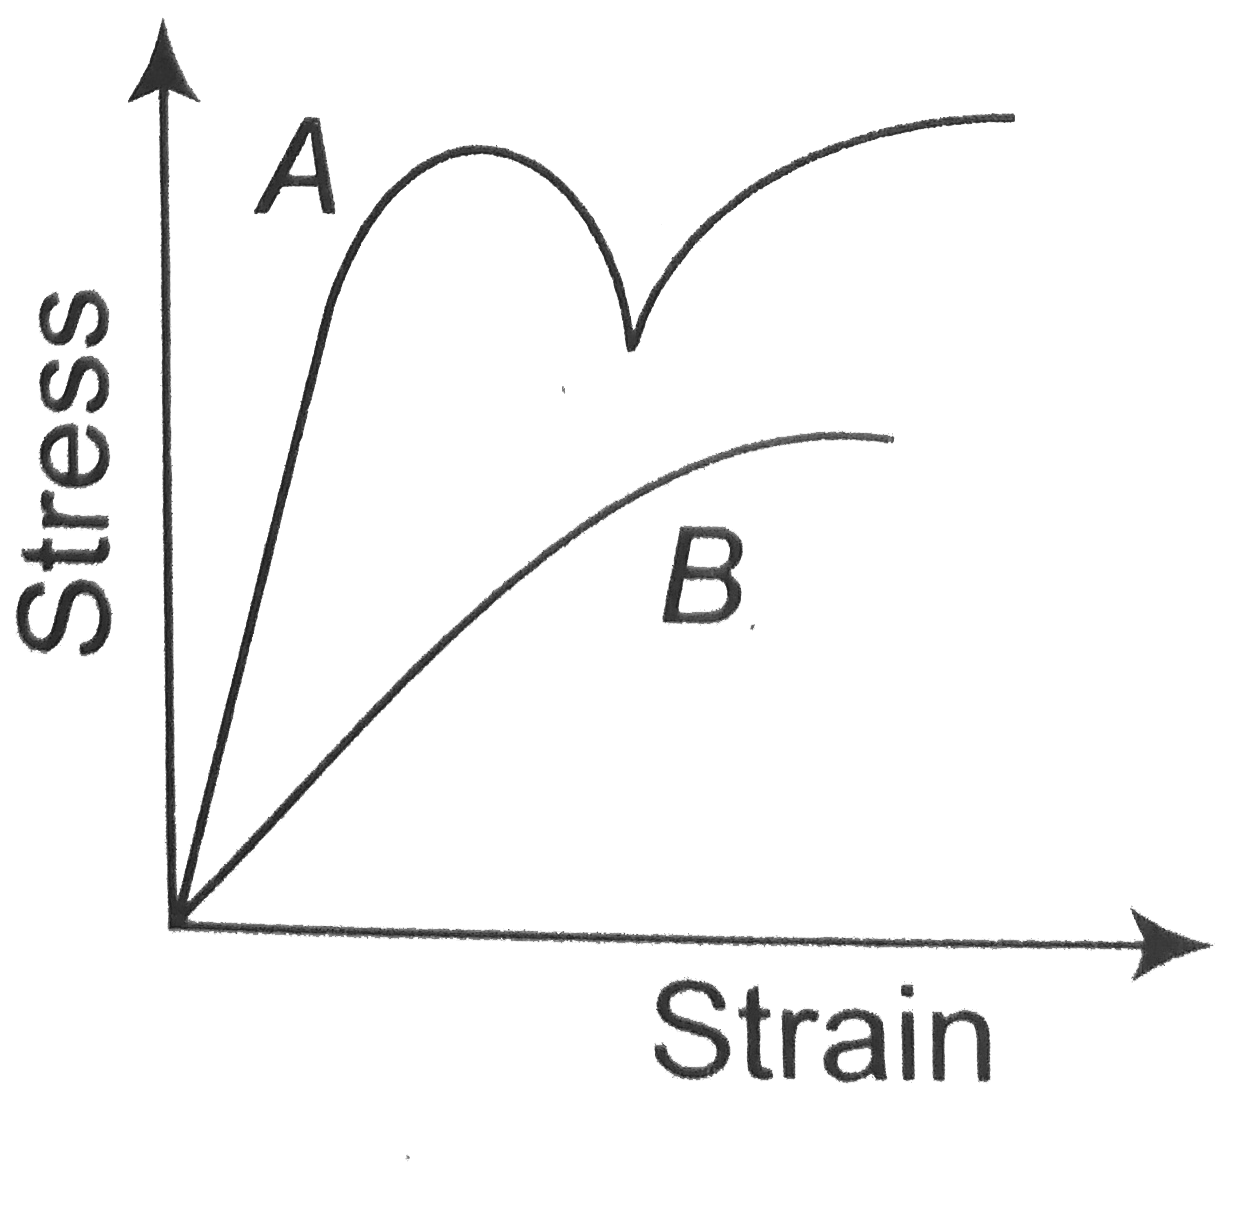
The diagram shoes stress v/s strain curve for the materials A and B. From the curves we infer that
View SolutionFigure shows the stress-strain curve of two metals P and Q. From the graph, it can be concluded that
View Solution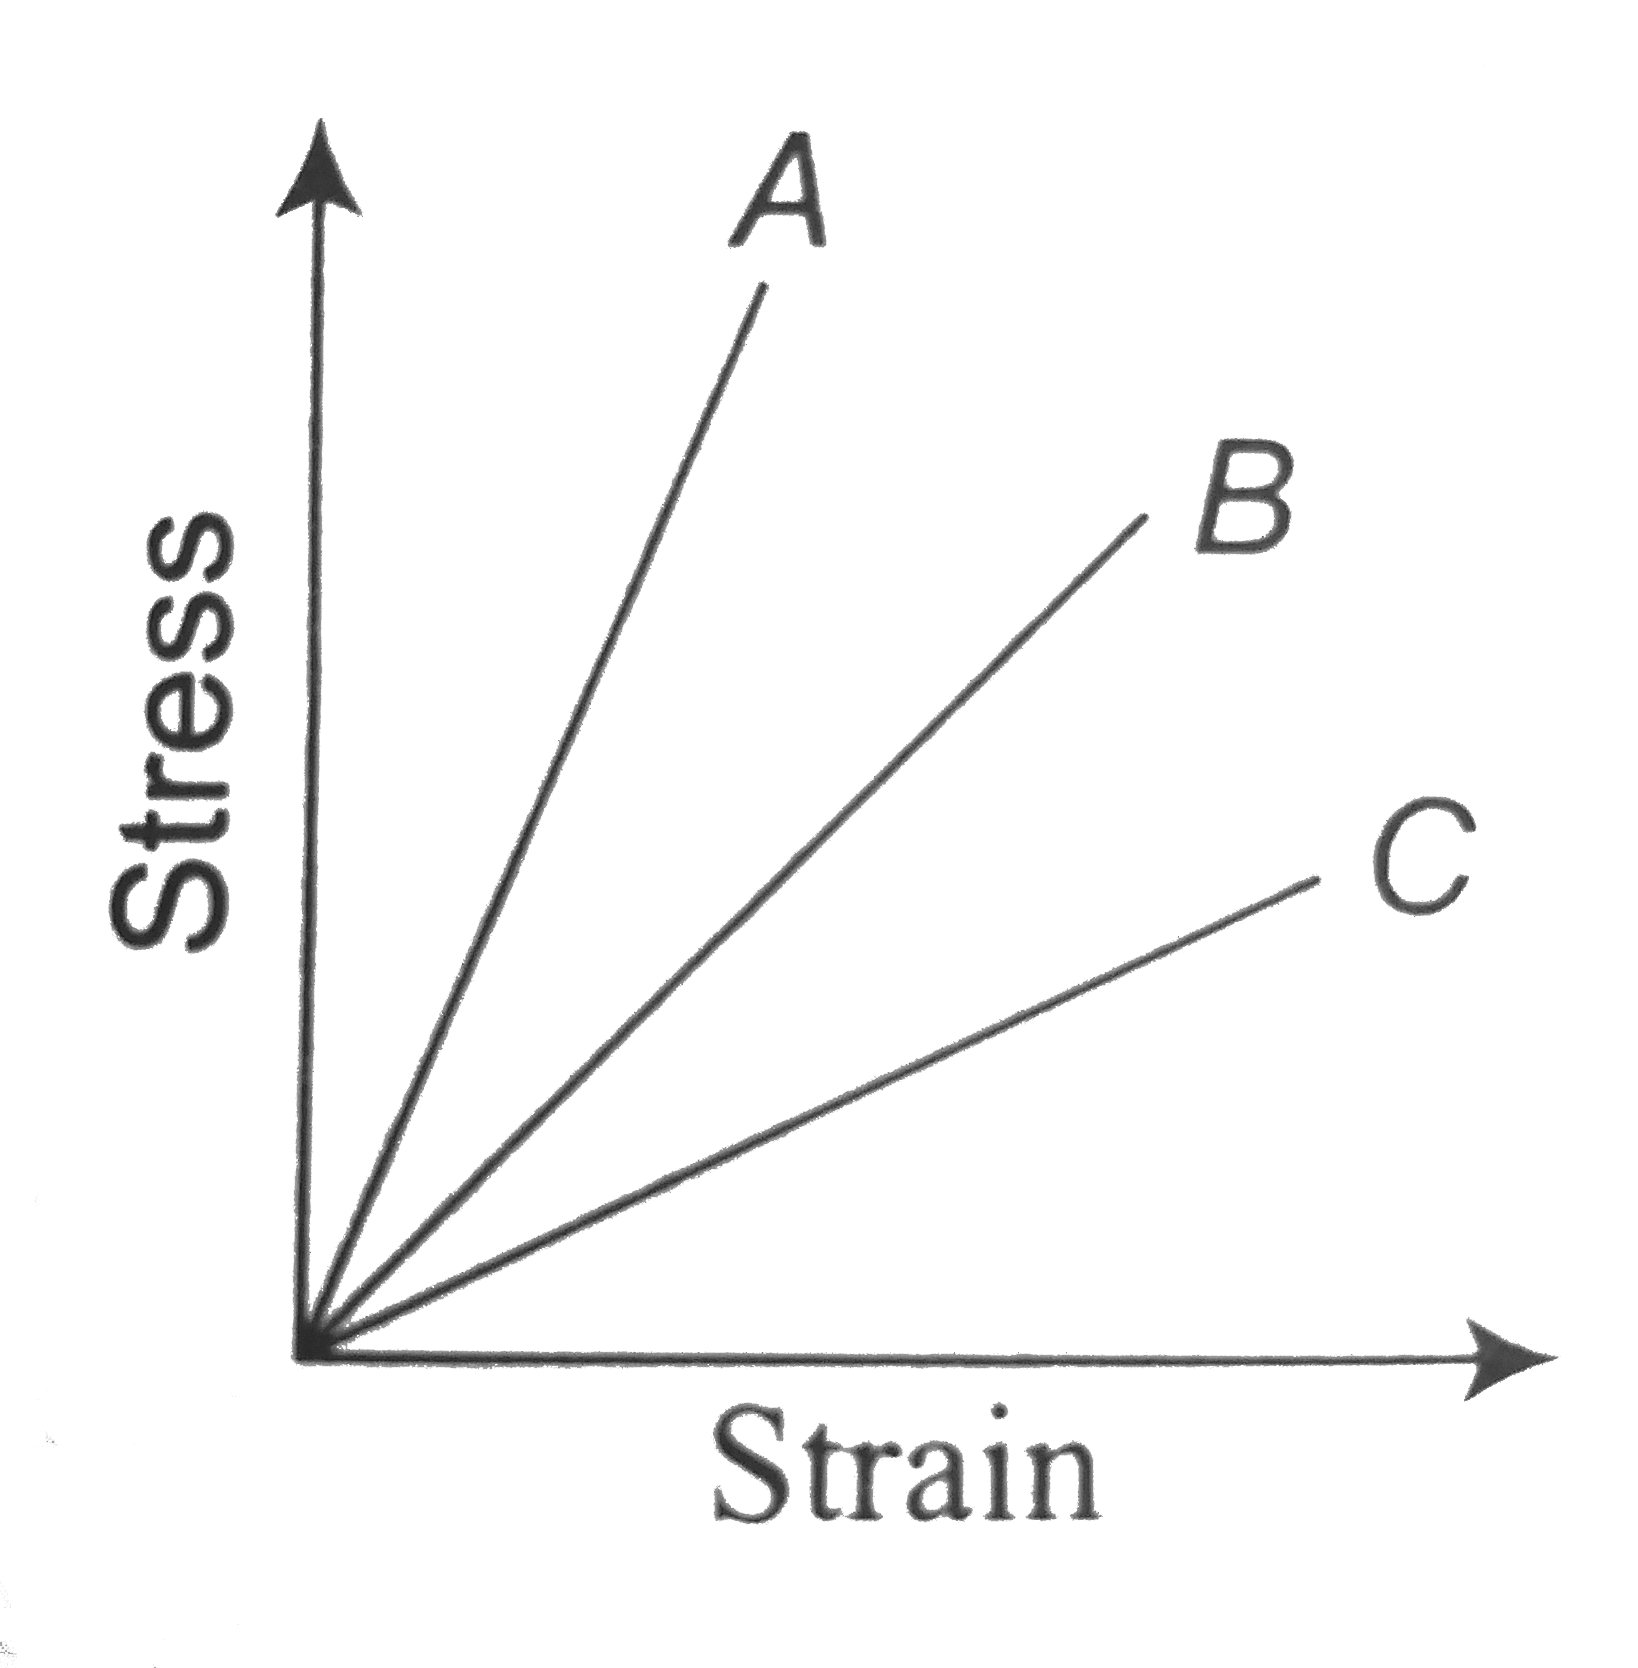
The stress strain curves for brass, steel and rubber are shown in the figure. The lines A, B and C are for
View SolutionThe stress and strain graphs for two materials, A and B are shown here. Answer the following:
 give reasons
View Solution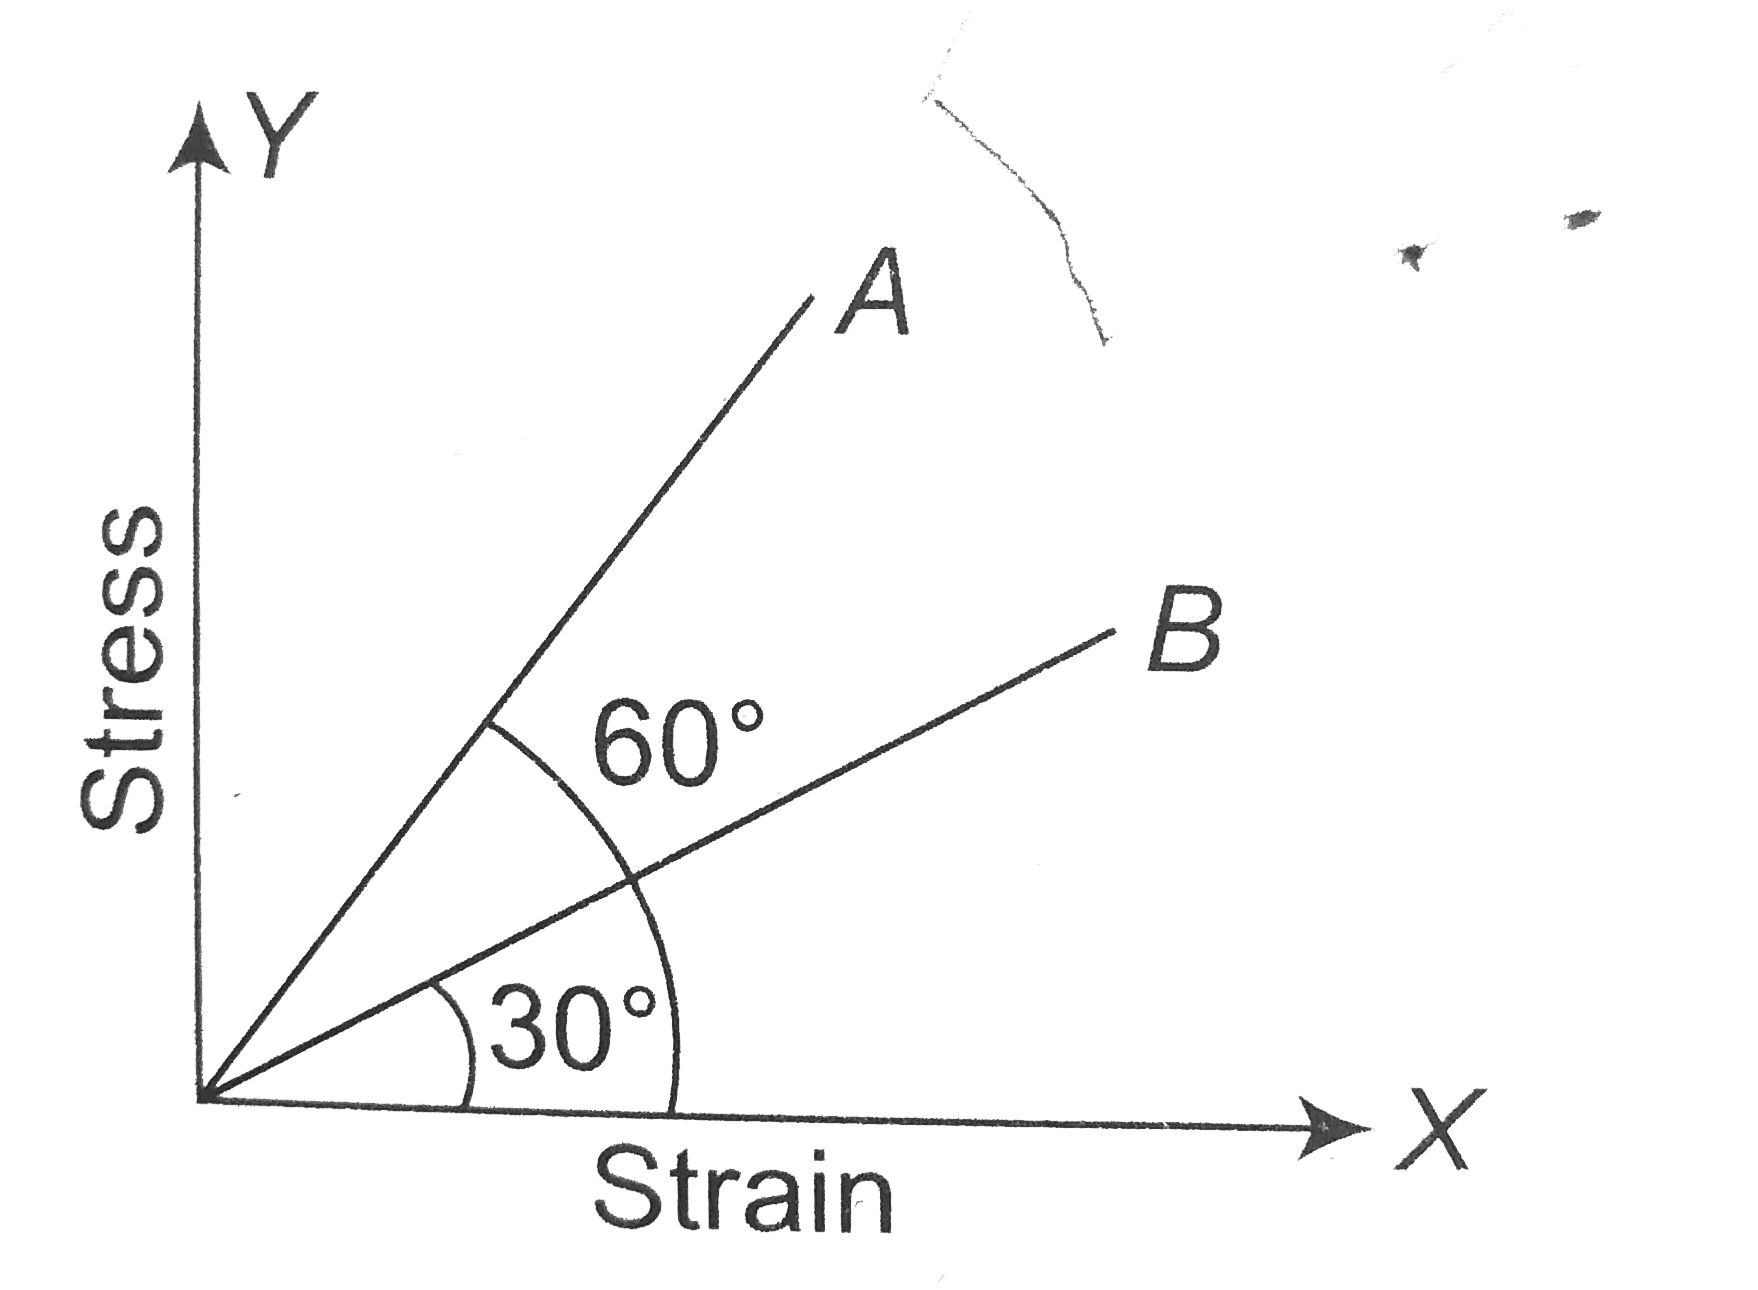
The stress versus strain graphs for wires of two materials A and B are as shown in the figure. If YA and YB are the Young's moduli of the materials then
View Solution

