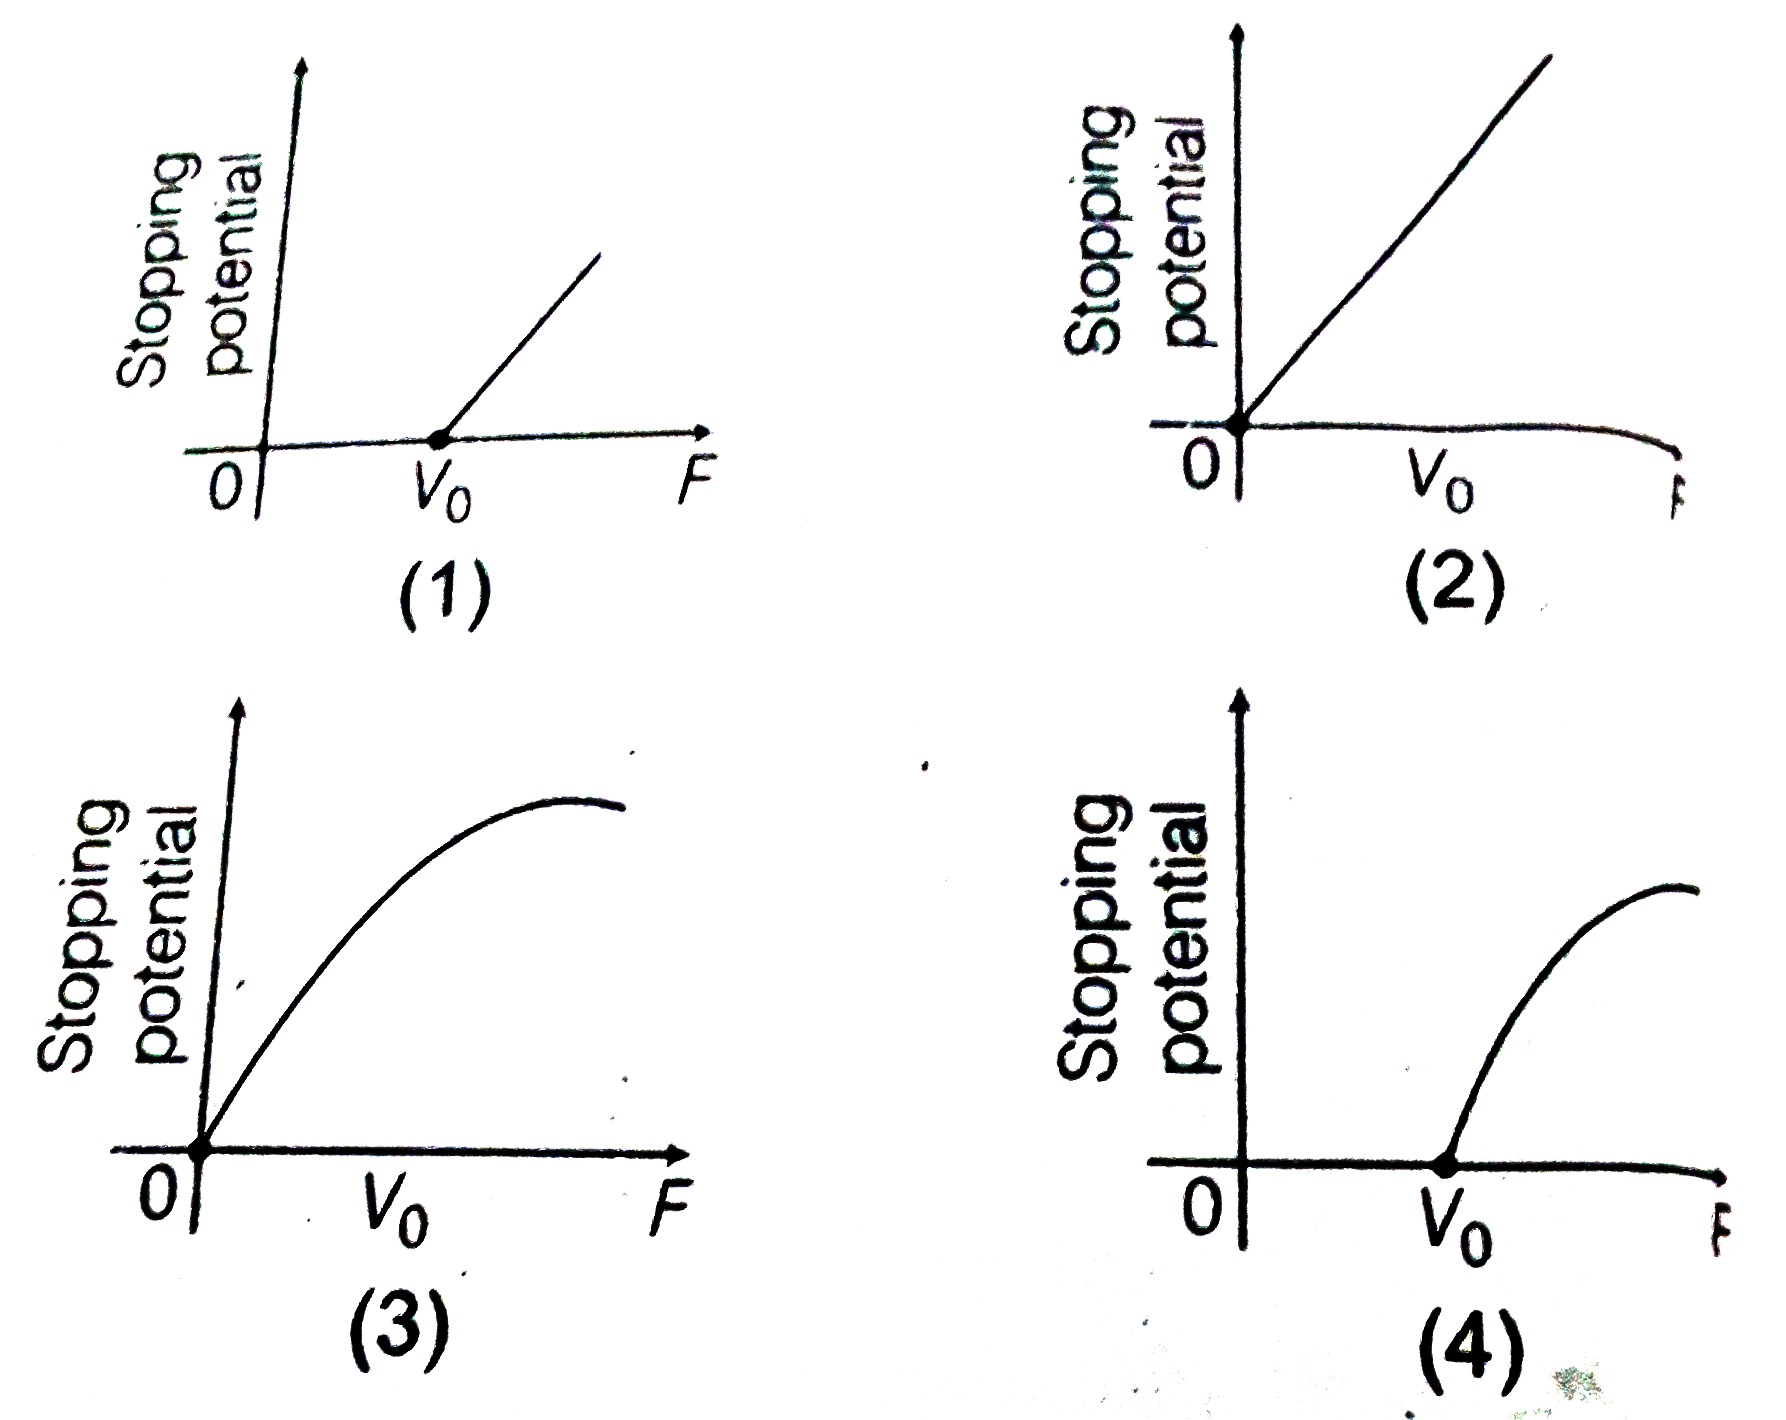
Following graphs show the variation of stopping potential corresponding to the frequency of incident radiation (F) for a given metal. The correct variation is shown in graph (where, = thershold frequency)

1
2
3
4
The correct Answer is:A
The graph showing the variation of stoppint potential with the frequency is shown below.

Topper's Solved these Questions
Similar Questions
Draw and explain the graph showing the variation of stopping potential with frequency of incident radiation in relation to photoelectric effect.
View SolutionDefine photoelectric effect. Draw a graph to show the variation of stopping potential with frequency of incident radiation on a metal plate.
View SolutionThe slope of the graph drawn between stopping potential and frequency of incident radiation will be
View SolutionPlot a graph showing variation of stopping potential (V0) with the frequency (v) of the incident radiation for a given photosensitive material. Hence, state the significance of the threshold frequency in photoelectric emission.
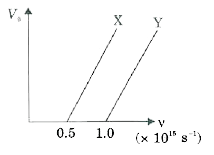
Using the principle of energy conservation, write the equation relating the energy of incident photon, threshold frequency and the maximum kinetic energy of the emitted photoelectrons.View SolutionThe following graph shows the variation of stopping potential V0 with the frequency v of the incident radiation for two photosensitive metals X and Y.
(i) Which metal has larger threshold wavelength ? Give reason.
(ii) Explain giving reason , which metal gives out electrons , having larger kinetic energy , for same wavelength of the incident radiation.
(iii) If the distance between the light source and metal X is halved , how will the kinetic energy of electrons emitted from it change ? Given reason.
 View Solution
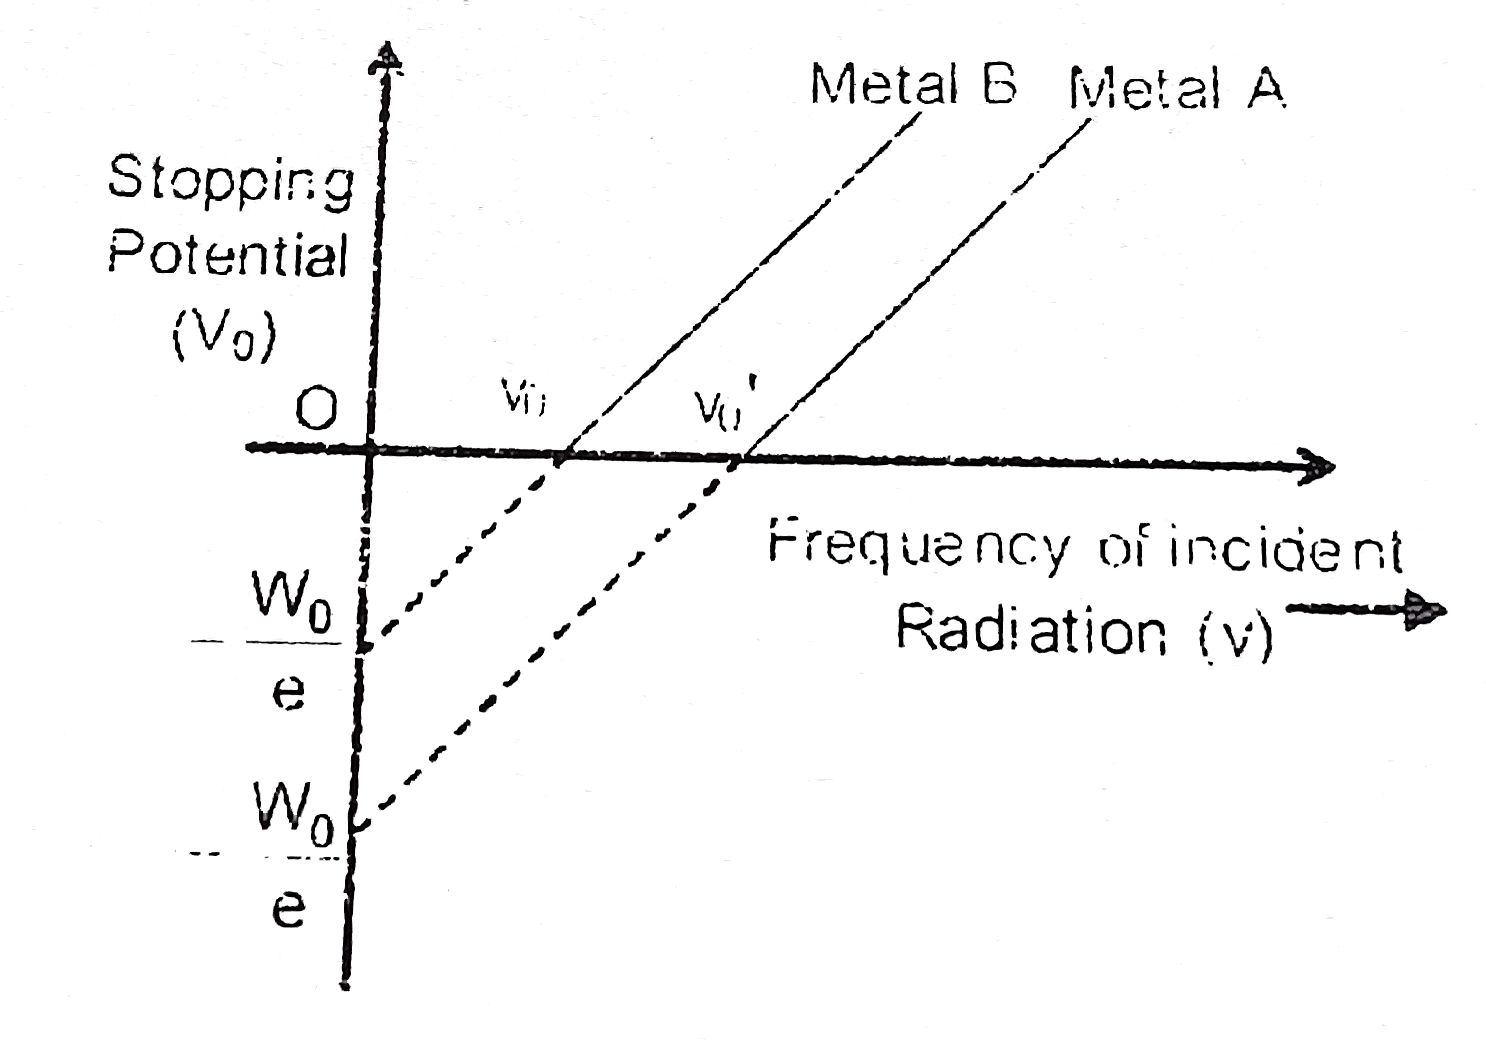
The graph shows variation of stopping potential V0 versus frequency of incident radiation v for two photosensitive metals A and B. Which of two metals has higher threshold frequency and why?
 View Solution
The graph shows variation of stopping potential V0 versus frequency of incident radiation v for two photosensitive metals A and B. Which of two metals has higher threshold frequency and why?
 View Solution
(i) Plot a labelled graph of |Vs| where Vs is stopping potential versus frequency f of the incident radiation.
(ii) State how will you use this graph to determine the value of Planck.s constant.View SolutionDraw a graph showing the variation of stopping potential with frequency of the incident on a metal plate. How can the value of Planck's constant be determined from this graph?
View SolutionThe figure shows the variation of stopping potential VQ with the frequency v of the incident radiations for two photosensitive metals P and
Which metal has smaller threshold wavelength ? Justify your answer.View Solution
