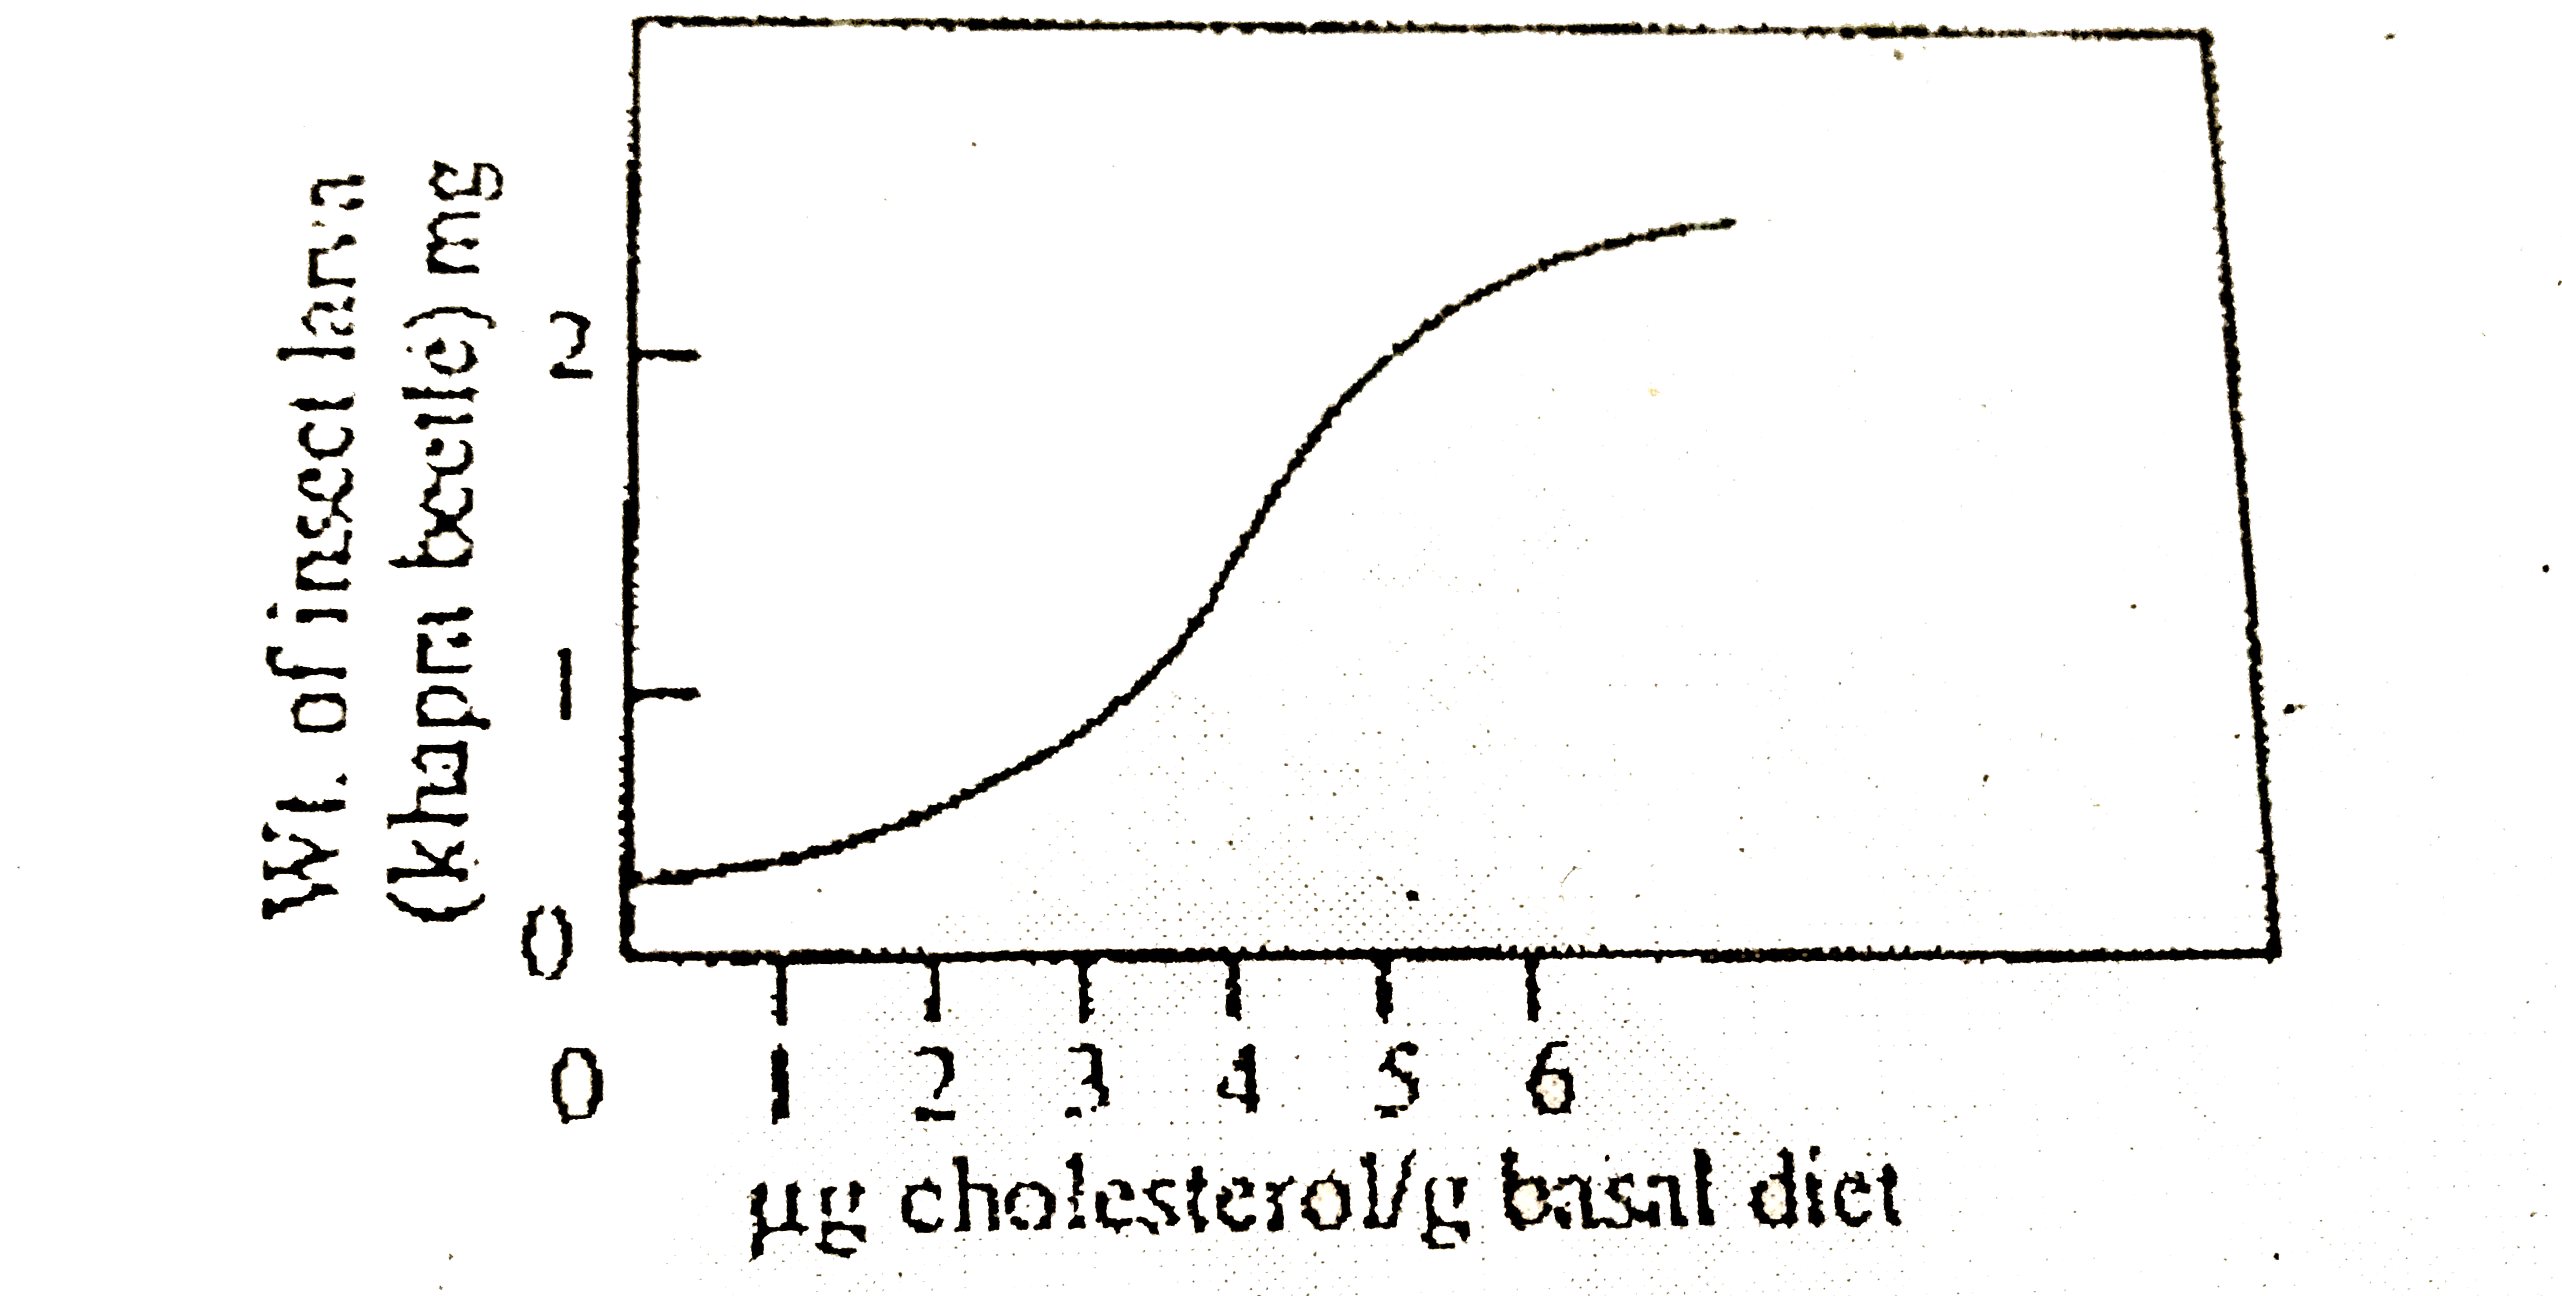
In an experiment freshly hatched larvae of an insect (Khapra beetle) were reared on a basal diet (complete diet without cholesterol) with increasing amounts of cholesterol. Results obtained are shown in the graph given in the table : The graph indicates that

cholesterol is an essential dietary requirement of khapra beetle
growth of khapra beetle is directly proportional to cholesterol concentration
cholesterol concentration of 2μgg diet is the optimum level
growth of khnpra beetle is inhibited when cholesterol concentration exceedsμg/g diet.
The correct Answer is:A
According to the graph the growth of the insect takes place as the amount of the cholesterol increase and at 6 μg cholesterol/g the growth get static. If the growth rate would have been directly propotional to the cholesterol concentration then the graph would have been straight line. (3) is worng as the optimum level is 6μgg cholesterol concentration.
Similar Questions
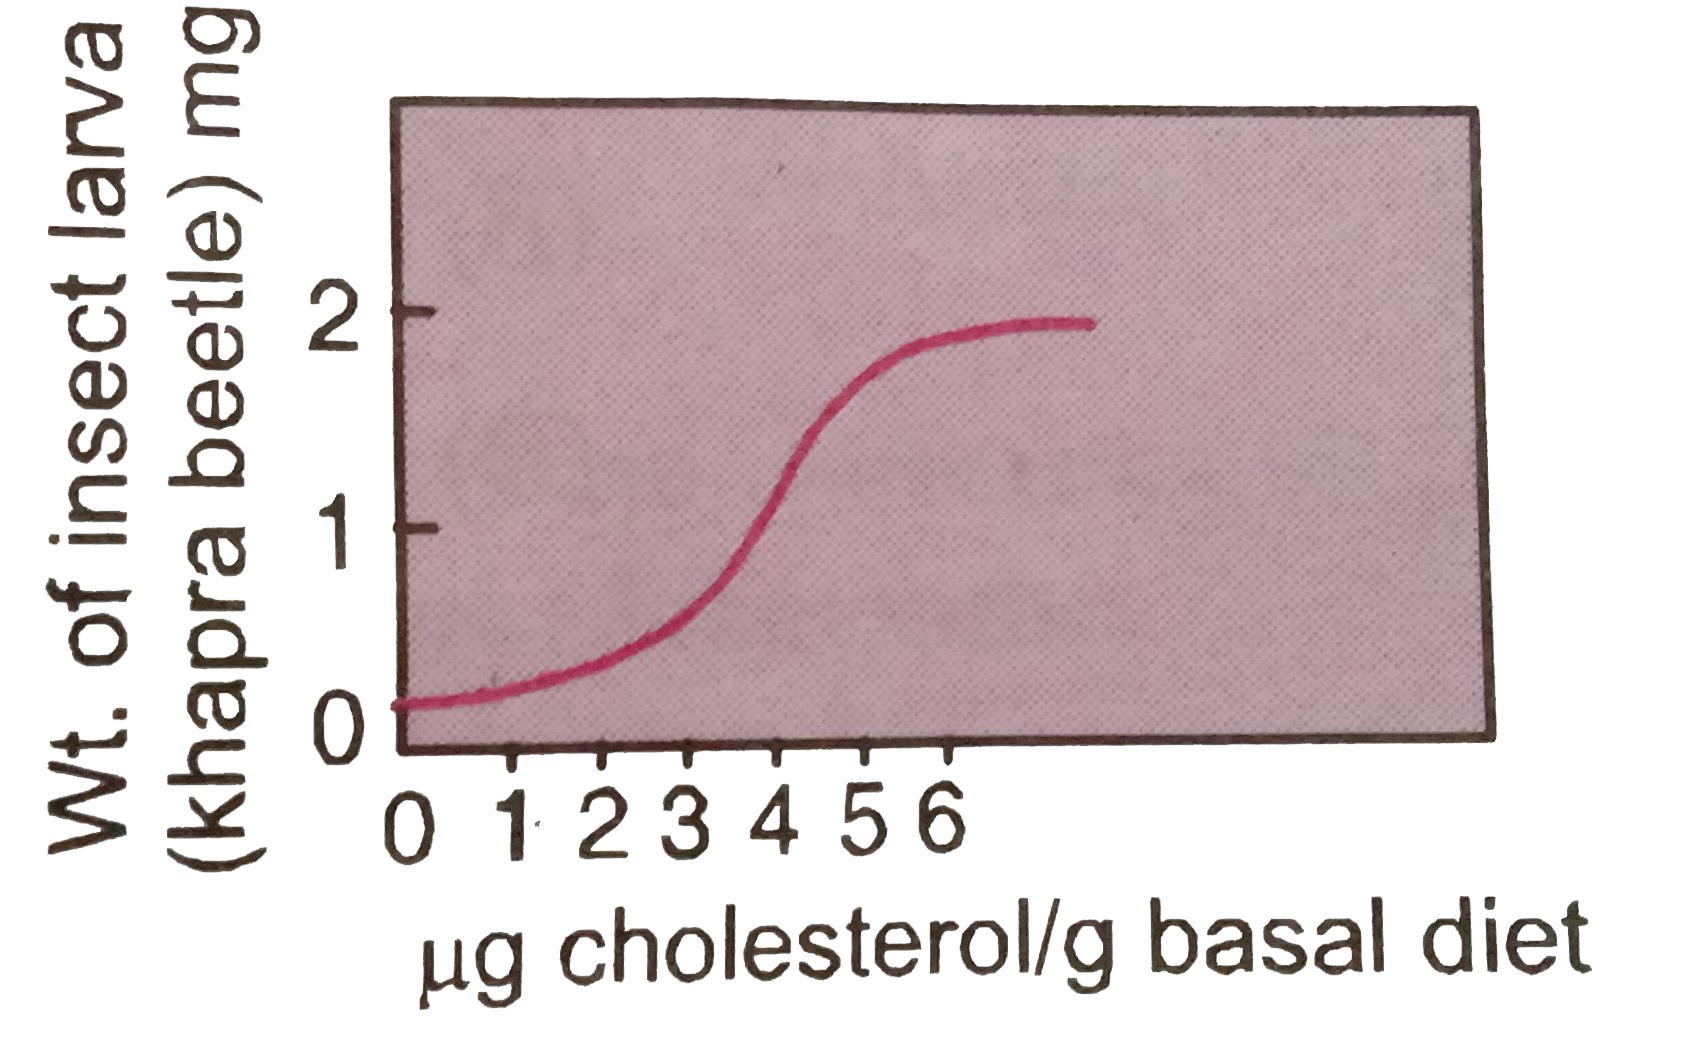
Khapra beetle larvae were raised on basal diet to which was added increasing amount of cholesterol. The result is shown in the accompanying graph. It indicates

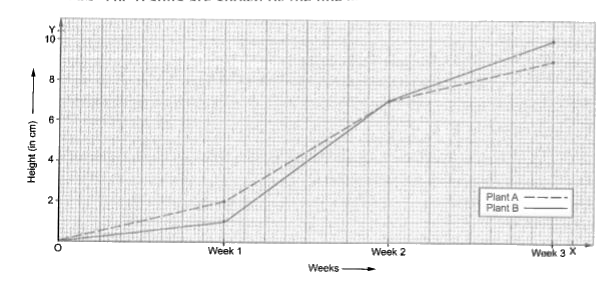
View SolutionFor an experiment in botany, two different plants, plant A and B, were grown under similar laboratory conditions. Their heights were measured at the end of each week for three weeks. The results are shown by the line graph given below :

Study the above line graph carefully and answer the questions given below:
(i) How high was plant A after (a)2 weeks (b)3 weeks ?
(ii) How high was plant B after (a)2 weeks (b)3 weeks?
(iii) How much did plant A grow during the 3rd week?
(iv) How much did plant B grow from the end of the 2nd week to the end of the 3rd week ?
(v) During which week did plant A grow most ?
(vi) During which week did plant B grow least ?
(vii) Were the two plants of the same height during any week shown here ? Specify.
View Solution
Knowledge Check
Khapra beetle larvae were raised on basal diet to which was added increasing amount of cholesterol. The result is shown in the accompanying graph. It indicates
 ACholesterol concentration of 2μg diet is optimumÂBGrowth of beetles is inhibited when concentration exceeds 5μgg dietÂCGrowth of beetles is directly proportional to cholesterol concentration.ÂDCholesterol is an essential dietary equirement of Khapra Beetle.
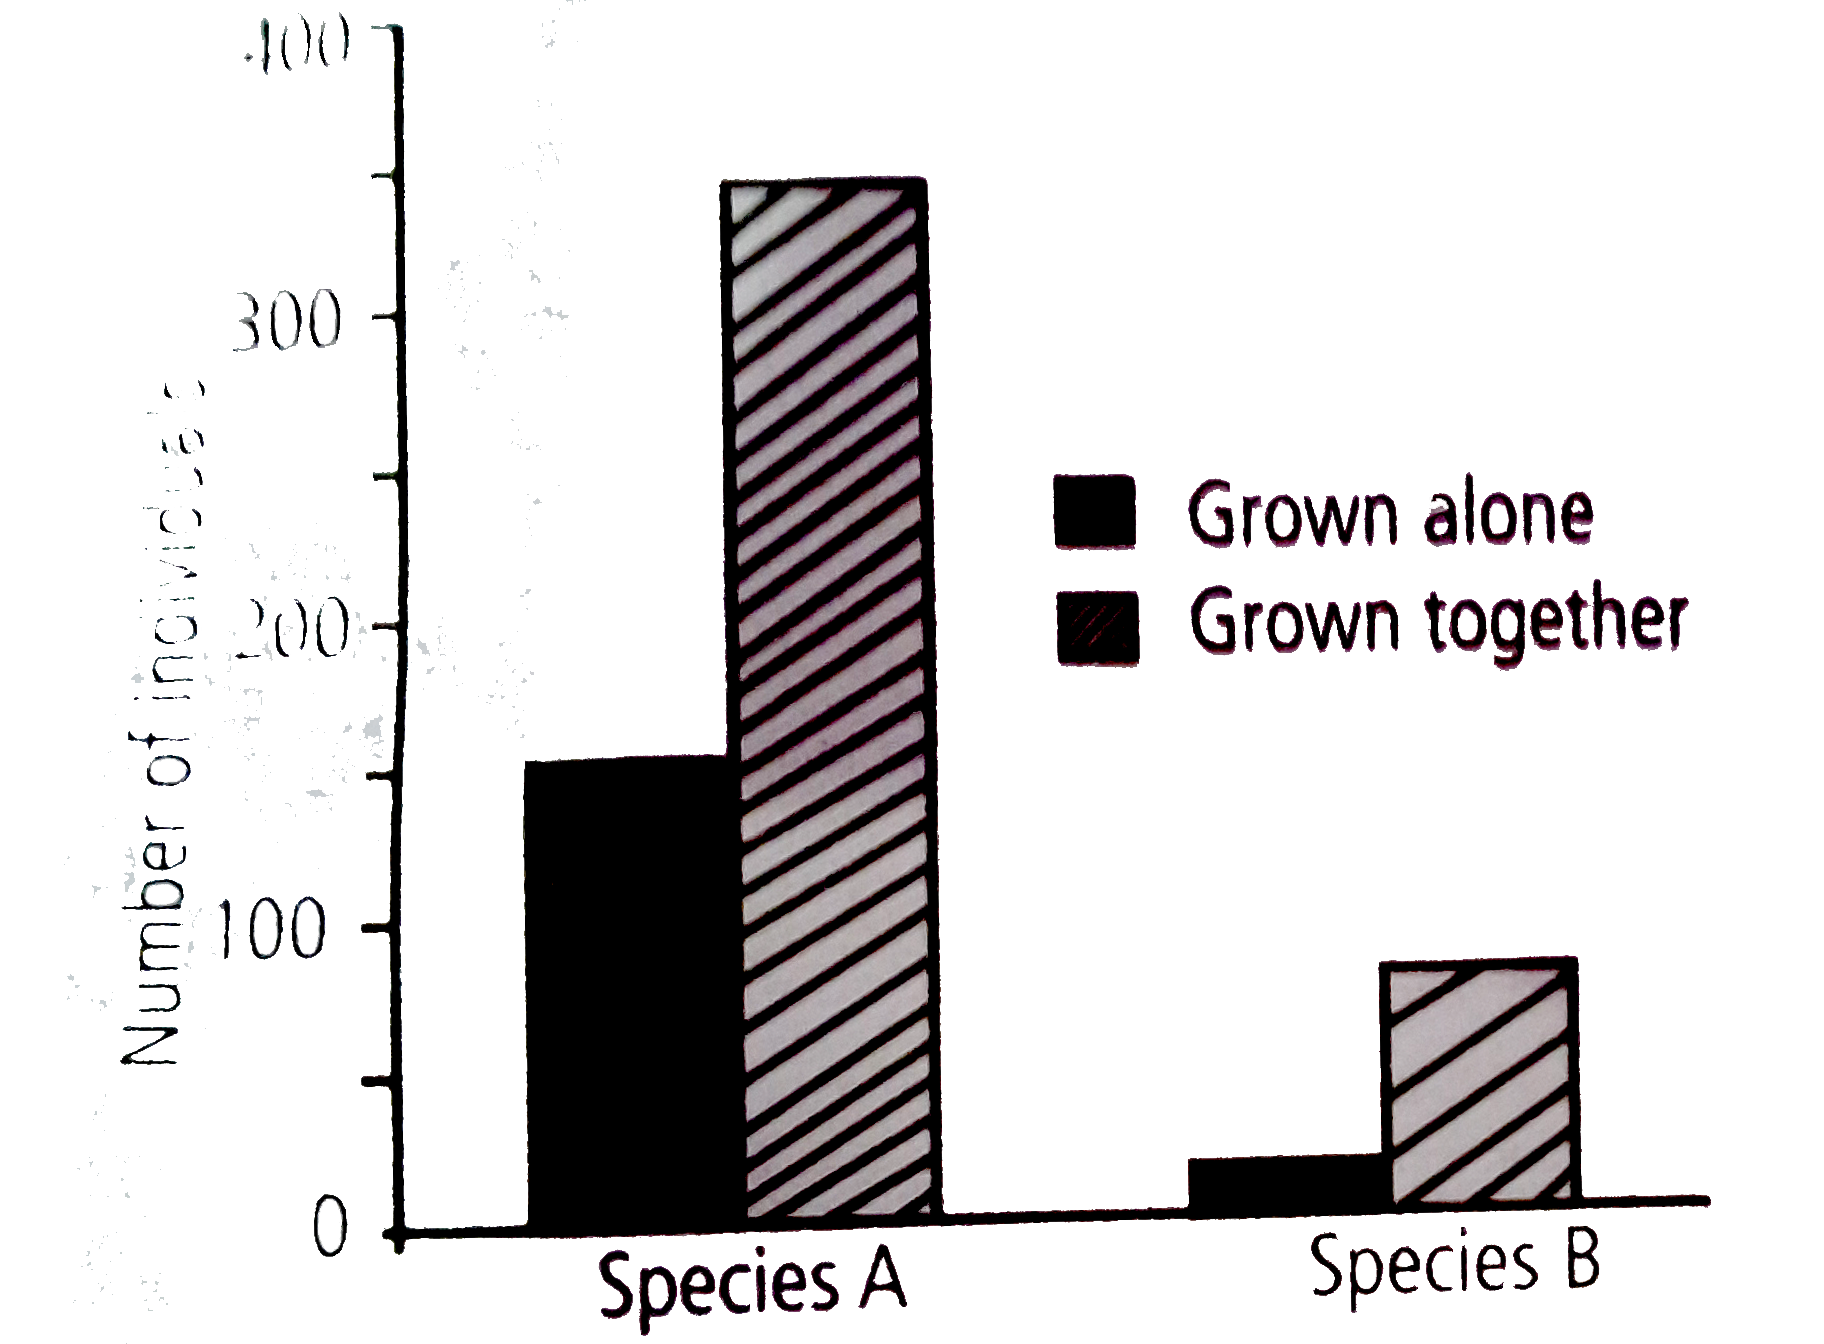
Two insect species were used in a laboratory experiment. For one treatment, both species were grown by themselves (in separate chambers) on a suitable food source. For the second treatment, the two species were grown together (in the same chamber) on the same type and amount of food as in the first treatment. The given figure showns the results (the number of individuals of each species in the two treatments) at the end of the experiment. Based on these results the two species should be classified as
 AcompetitorsBmutualistsCpredators of pathogensDcommensalists
Two insect species were used in a laboratory experiment. For one treatment, both species were grown by themselves (in separate chambers) on a suitable food source. For the second treatment, the two species were grown together (in the same chamber) on the same type and amount of food as in the first treatment. The given figure showns the results (the number of individuals of each species in the two treatments) at the end of the experiment. Based on these results the two species should be classified as
 AcompetitorsBmutualistsCpredators of pathogensDcommensalists
Two hundred students of 6th and 7th class were asked to name their favourite colour so as to decide upon what should be the colour of their School Building. The results are shown in the following table. Represent the given data on a bar graph.
View SolutionRead the given passage and answer the questions.
P, Q, R are different colourless solids, while S is a colourless solution. They are in random order) Sodium chloride (NaCl), Calcium Carbonate (CaCO3), Acetic acid (CH3COOH) and Phenolphthalein indicator. Small amount of the above substances were added in pairs (e.g. P with Q, Q with R etc.) to a small amount of water in a test tube. They give the following results as shown in the observation table.
Observation Table:

The chemicals that can be used as an acid base indicator by a visually impaired student is _____ .
View SolutionRead the given passage and answer the questions.
P, Q, R are different colourless solids, while S is a colourless solution. They are in random order) Sodium chloride (NaCl), Calcium Carbonate (CaCO3), Acetic acid (CH3COOH) and Phenolphthalein indicator. Small amount of the above substances were added in pairs (e.g. P with Q, Q with R etc.) to a small amount of water in a test tube. They give the following results as shown in the observation table.
Observation Table:

The chemicals are:

View SolutionRead the given passage and answer the questions.
P, Q, R are different colourless solids, while S is a colourless solution. They are in random order) Sodium chloride (NaCl), Calcium Carbonate (CaCO3), Acetic acid (CH3COOH) and Phenolphthalein indicator. Small amount of the above substances were added in pairs (e.g. P with Q, Q with R etc.) to a small amount of water in a test tube. They give the following results as shown in the observation table.
Observation Table:

Which of the following reaction is incorrect ?
View SolutionRead the given passage and answer the questions.
P, Q, R are different colourless solids, while S is a colourless solution. They are in random order) Sodium chloride (NaCl), Calcium Carbonate (CaCO3), Acetic acid (CH3COOH) and Phenolphthalein indicator. Small amount of the above substances were added in pairs (e.g. P with Q, Q with R etc.) to a small amount of water in a test tube. They give the following results as shown in the observation table.
Observation Table:

If acetic acid and hydrochloric acid of same concentration are taken, HCl is a stronger acid because it contains:
View Solution
