A graph is plotted between and for of gas at constant pressure of . and are in litre and . Which of the following statements are not correct?
() The curve is straight line with slope .
() The curve is straight line with slope .
() The intercepet on axis is equal to .
() The intercepet on axis is equal to .
,
,
,
or
Slope
Intercept
Topper's Solved these Questions
- BOOK - CENGAGE CHEMISTRYCHAPTER - STATES OF MATTEREXERCISE - Exercises (Assertion-Reasoning)24videos
STATES OF MATTER
- BOOK - CENGAGE CHEMISTRYCHAPTER - STATES OF MATTEREXERCISE - Exercises (Integer)10videos
STATES OF MATTER
- BOOK - CENGAGE CHEMISTRYCHAPTER - STATES OF MATTEREXERCISE - Exercises (Multiple Correcttype)32videos
STATES OF MATTER
- BOOK - CENGAGE CHEMISTRYCHAPTER - SOME BASIC CONCEPTS AND MOLE CONCEPTEXERCISE - Archives Subjective11videos
SOME BASIC CONCEPTS AND MOLE CONCEPT
- BOOK - CENGAGE CHEMISTRYCHAPTER - STOICHIOMETRYEXERCISE - Archives Subjective33videos
STOICHIOMETRY
Similar Questions
What is the type of graph that would result between log(V) and log(1T) at constant pressure?
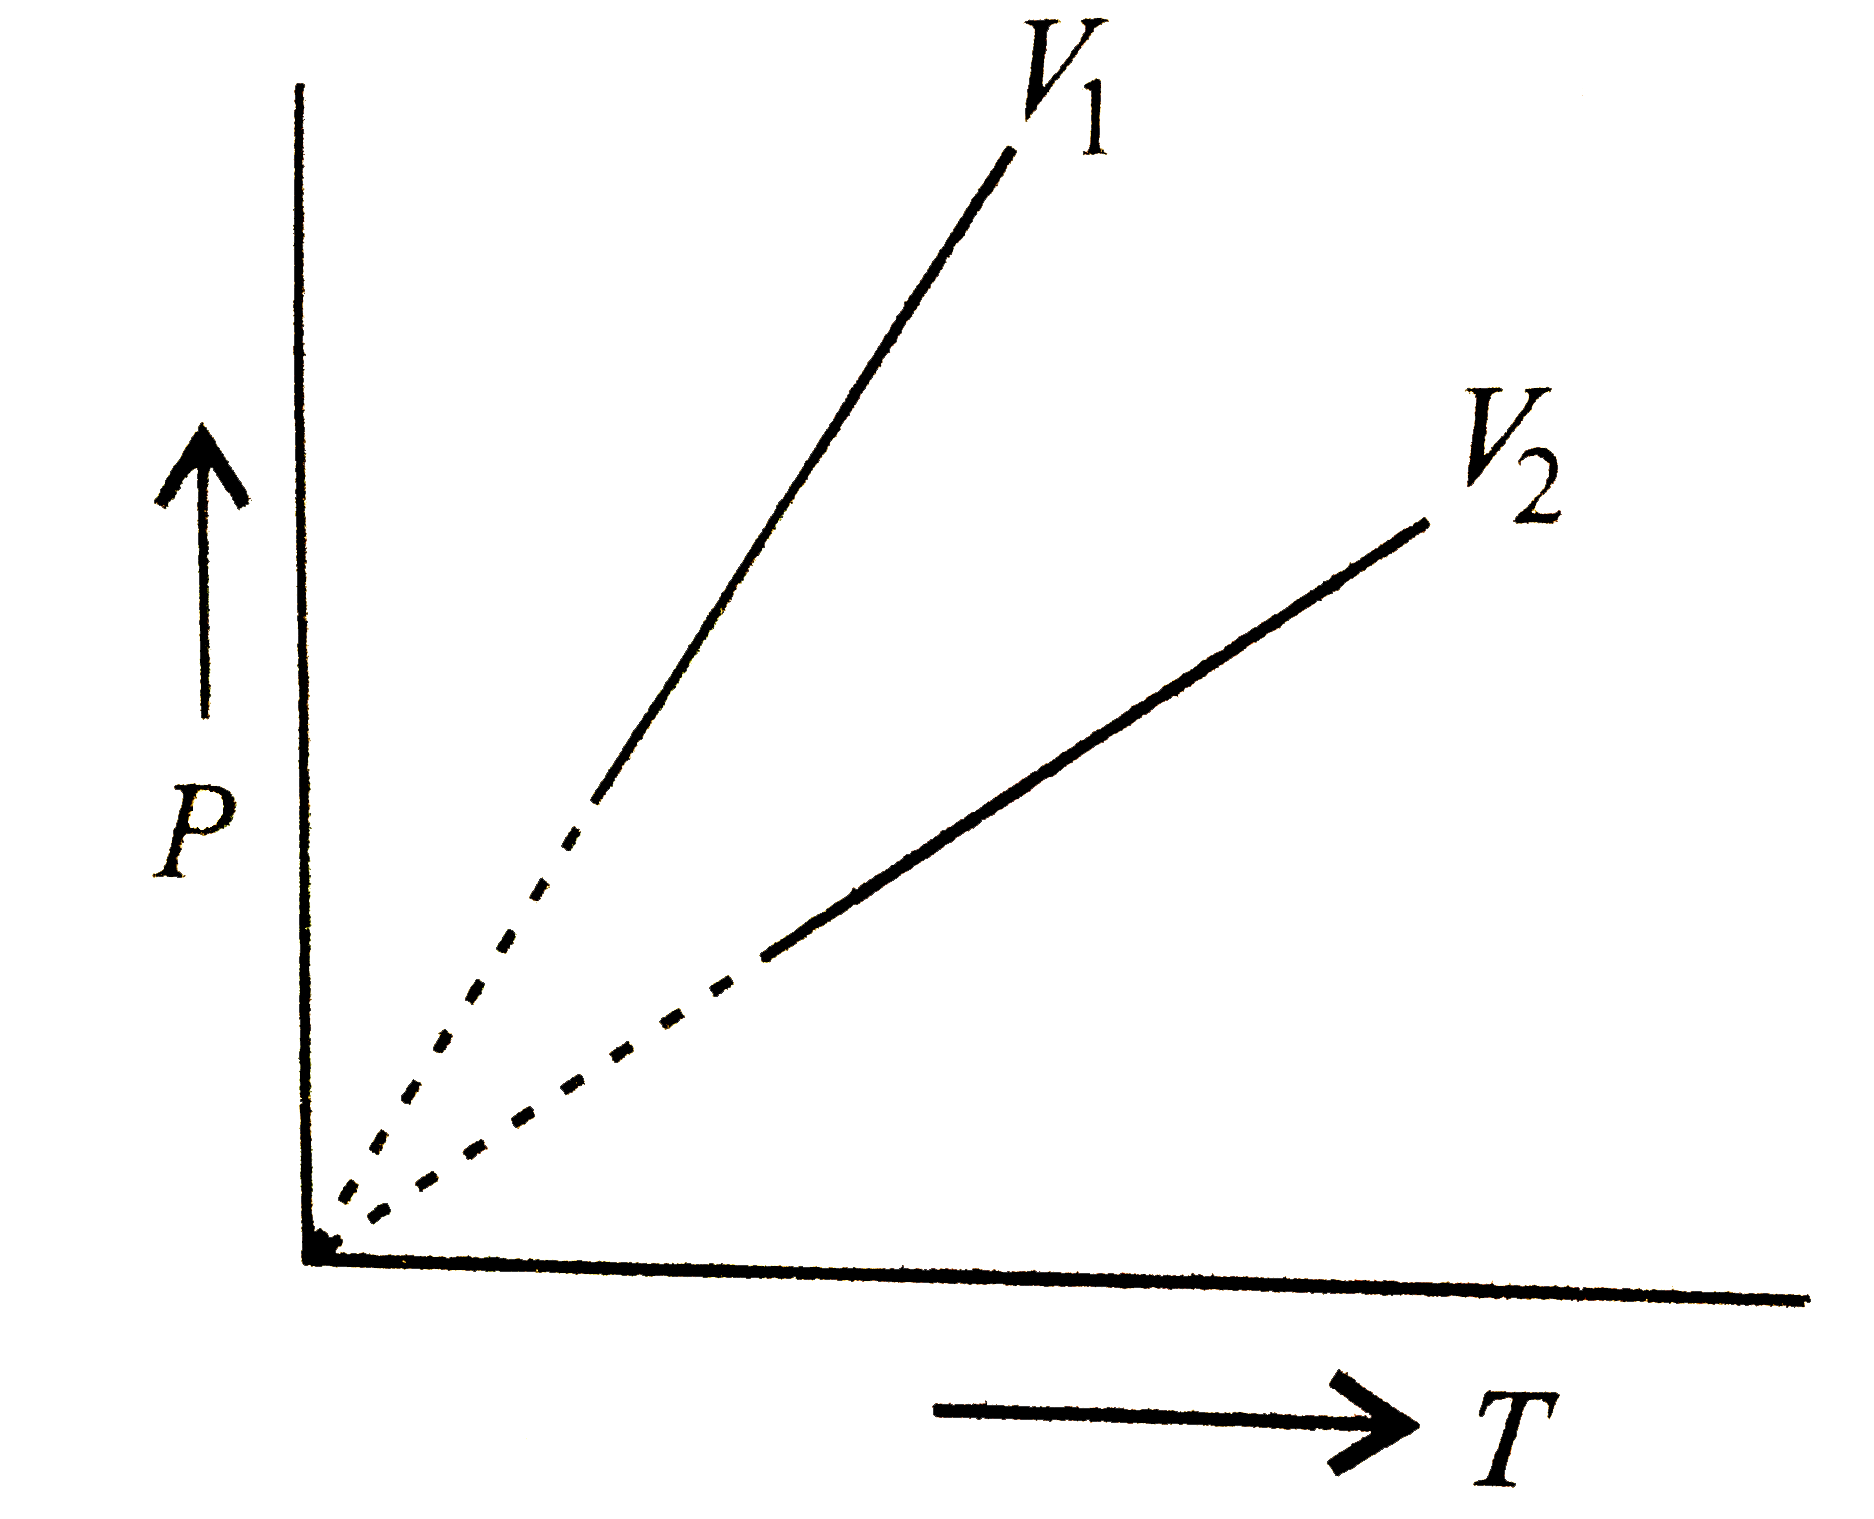
View SolutionA plot of P vs T for a given mass of gas at constant volume is a straight line . P vs T at constant volumes V1 and V2 for an ideal gas are shown below :
Which of the following is correct ?
 View Solution
Knowledge Check
- Question 1 - Select One
If a graph is plotted between log V and log T for 2 moles of a gas of constant pressure of 0.0821 atm, then which of the following statements are correct?
AThe curve is straight line with slope -1.BThe curve is straight line with slope +1CThe intercept on y-axis is equal to 2.DThe intercept on y-axis is equal to 0.3010. - Question 2 - Select One
Which of the following curves between log K and 1T is correct?
A B
B C
C D
D
- Question 3 - Select One
If indifference curve is straight line downward sloping ,
AMRS is increasingBMRS is decreasingCMRS is constantDMRS is zero
The slope of the graph between log P and log V at constant temperature for a given mass of gas is
View SolutionIf a graph is plotted between log(a−x) and t, the slope of the straight line is equal to −0.03. The specific reaction rate will be
View SolutionIf a graph is plotted between ln k and 1/T for the first order reaction, the slope of the straight line so obtained is given by
View SolutionThe graph between the log K versus 1T is a straight line. The slope of the line is
View SolutionFor a first order reaction the plot of ‘t’ against log c gives a straight line with a slope equal to :
View Solution

