V vs T curves at different pressures P1 and P2 for an ideal gas are shown below:

Which one of the following is correct?
P1>P2
P1<P2
P1=P2
P2/P1=1/2
Step by step video & image solution for V vs T curves at different pressures P_(1) and P_(2) for an ideal gas are shown below: Which one of the following is correct? by Chemistry experts to help you in doubts & scoring excellent marks in Class 11 exams.
Updated on:21/07/2023Topper's Solved these Questions
- STATES OF MATTERBOOK - CENGAGE CHEMISTRYCHAPTER - STATES OF MATTEREXERCISE - Exercises (Assertion-Reasoning)
24 Videos
- STATES OF MATTERBOOK - CENGAGE CHEMISTRYCHAPTER - STATES OF MATTEREXERCISE - Exercises (Integer)
10 Videos
- STATES OF MATTERBOOK - CENGAGE CHEMISTRYCHAPTER - STATES OF MATTEREXERCISE - Exercises (Multiple Correcttype)
32 Videos
- SOME BASIC CONCEPTS AND MOLE CONCEPTBOOK - CENGAGE CHEMISTRYCHAPTER - SOME BASIC CONCEPTS AND MOLE CONCEPTEXERCISE - Archives Subjective
11 Videos
- STOICHIOMETRYBOOK - CENGAGE CHEMISTRYCHAPTER - STOICHIOMETRYEXERCISE - Archives Subjective
33 Videos
Similar Questions
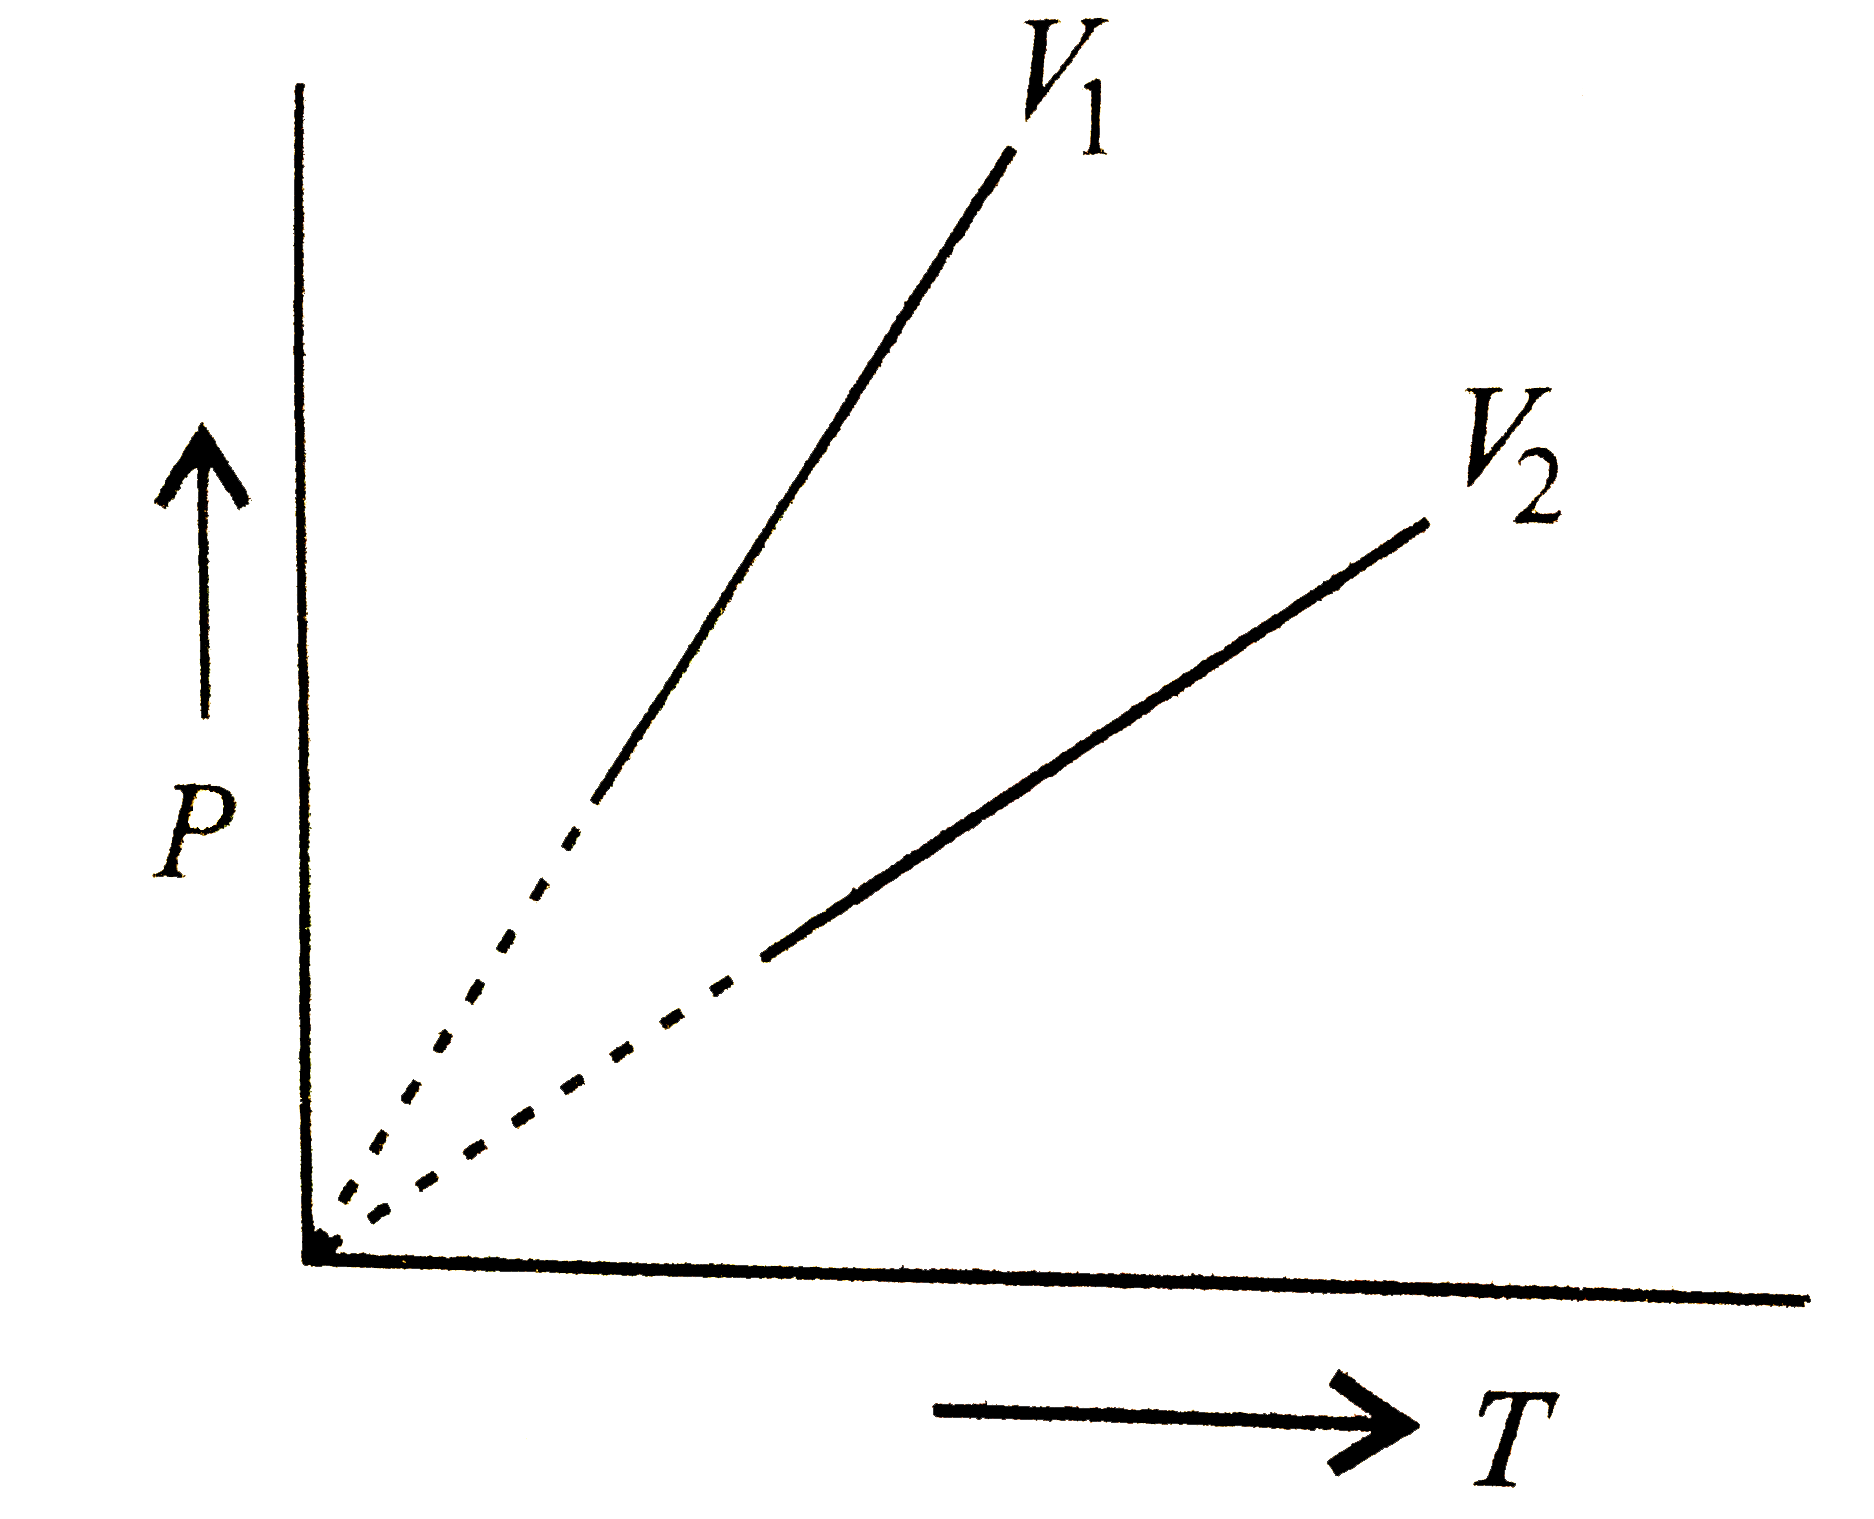
A plot of P vs T for a given mass of gas at constant volume is a straight line . P vs T at constant volumes V1 and V2 for an ideal gas are shown below :
Which of the following is correct ?
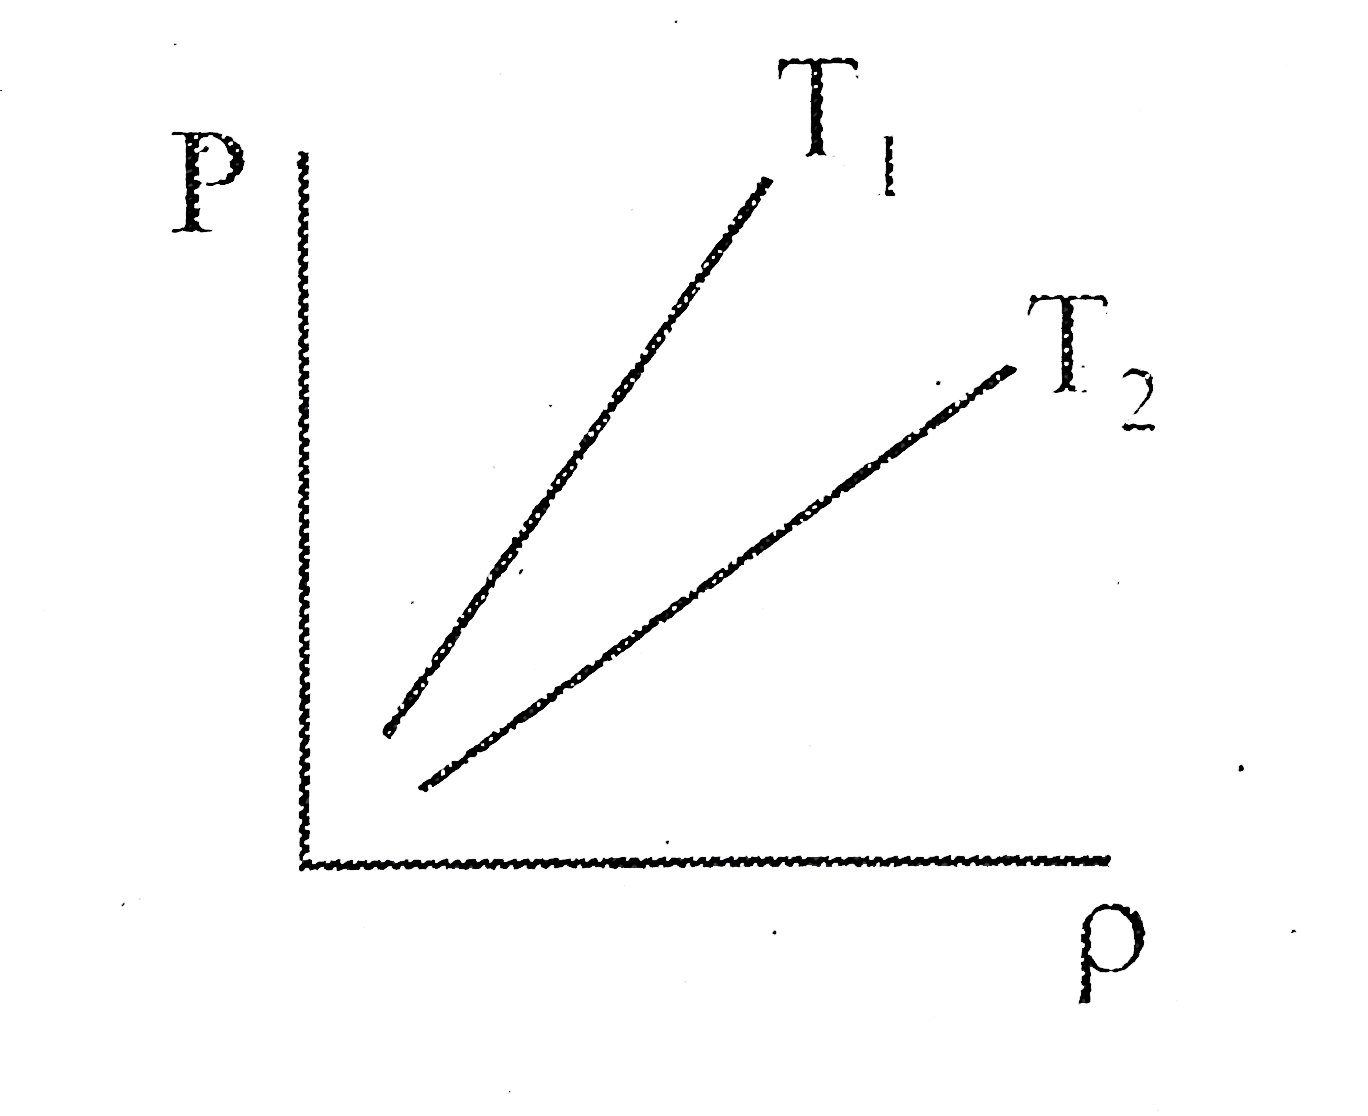
View SolutionFigure shows graphs of pressure vs density for an ideal gas at two temperature T1 and T2 . Which of the following is correct ?
View Solution
Knowledge Check
V vs T curves at constant pressure P1 and P2 for an ideal gas are shown below
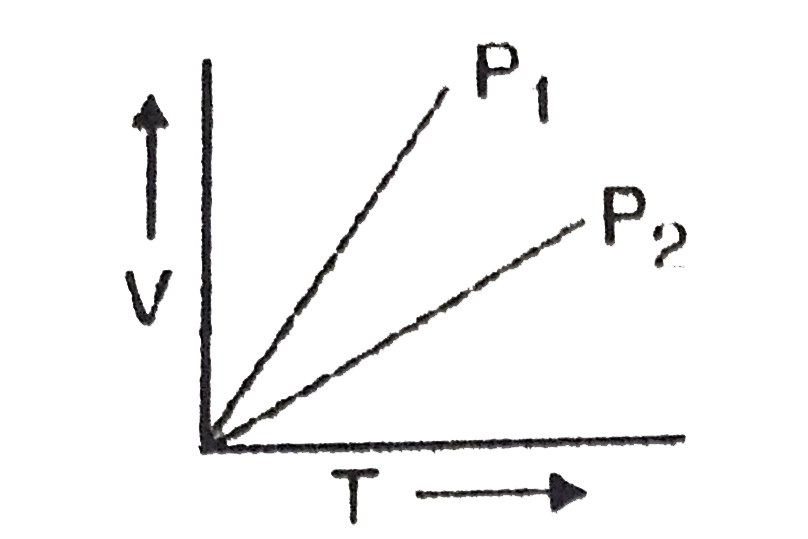
Which is correct ?AP1>P2BP1<P2CP1=P2DAll of the aboveFor V versus T curves at constant pressure P1andP2 for and ideal gas shown in figure-
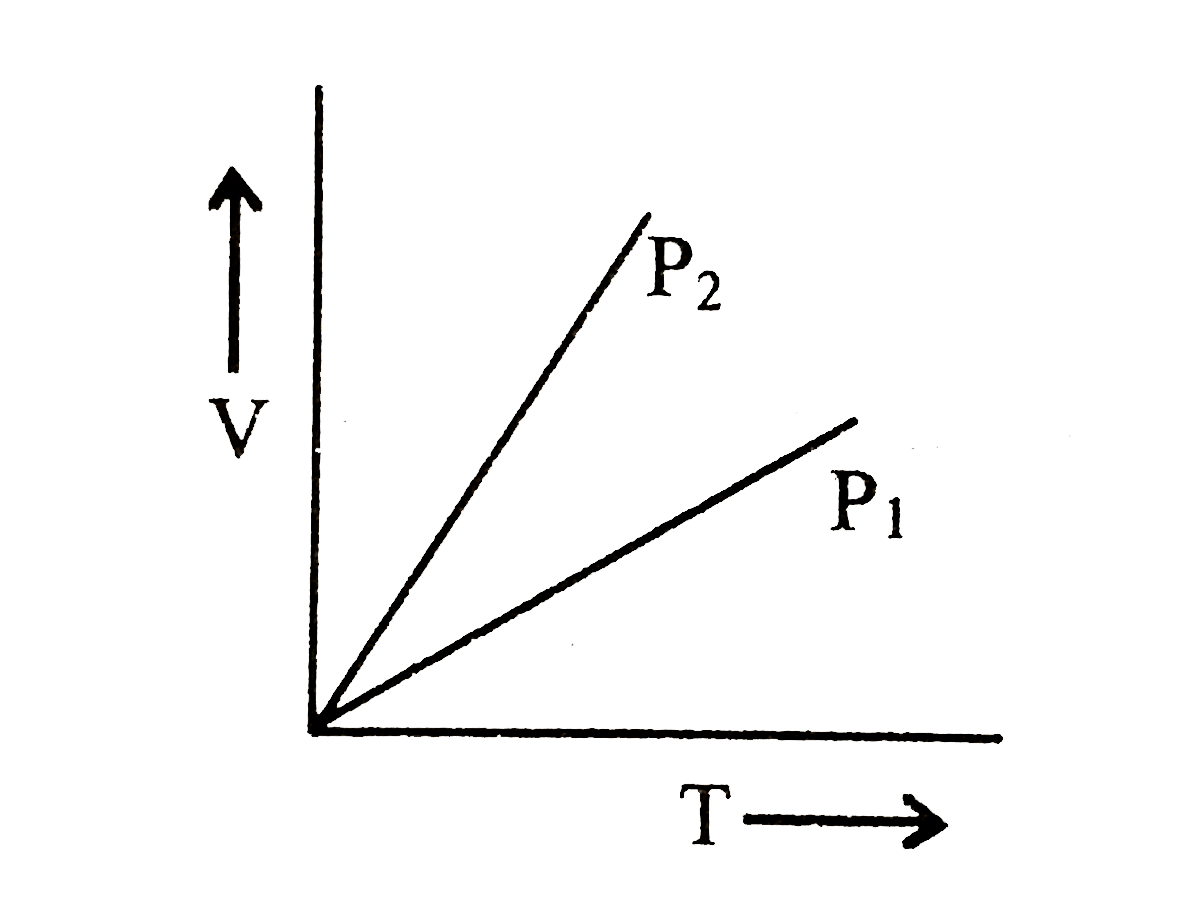 AP1>P2BP1<P2CP1=P2DP1P2
Figure shows graphs of pressure vs density for an ideal gas at two temperature T1andT2. Which of the following is correct?
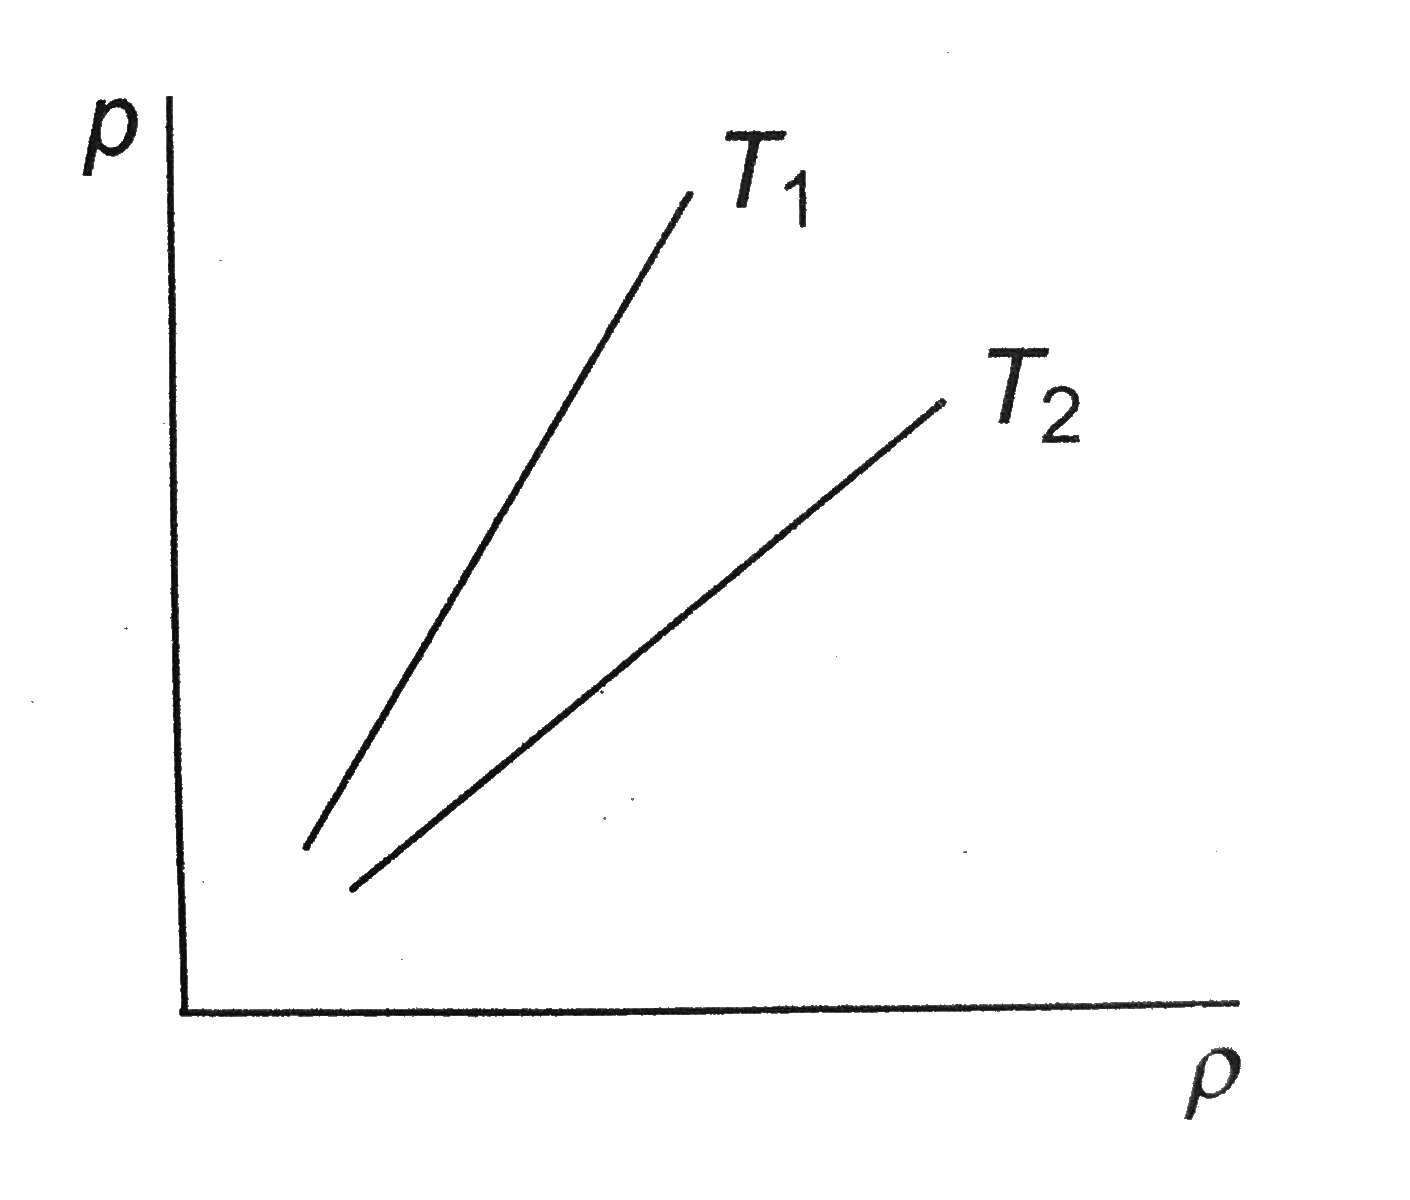 AT1>T2BT1=T2CT1<T2Dany of the three is possible
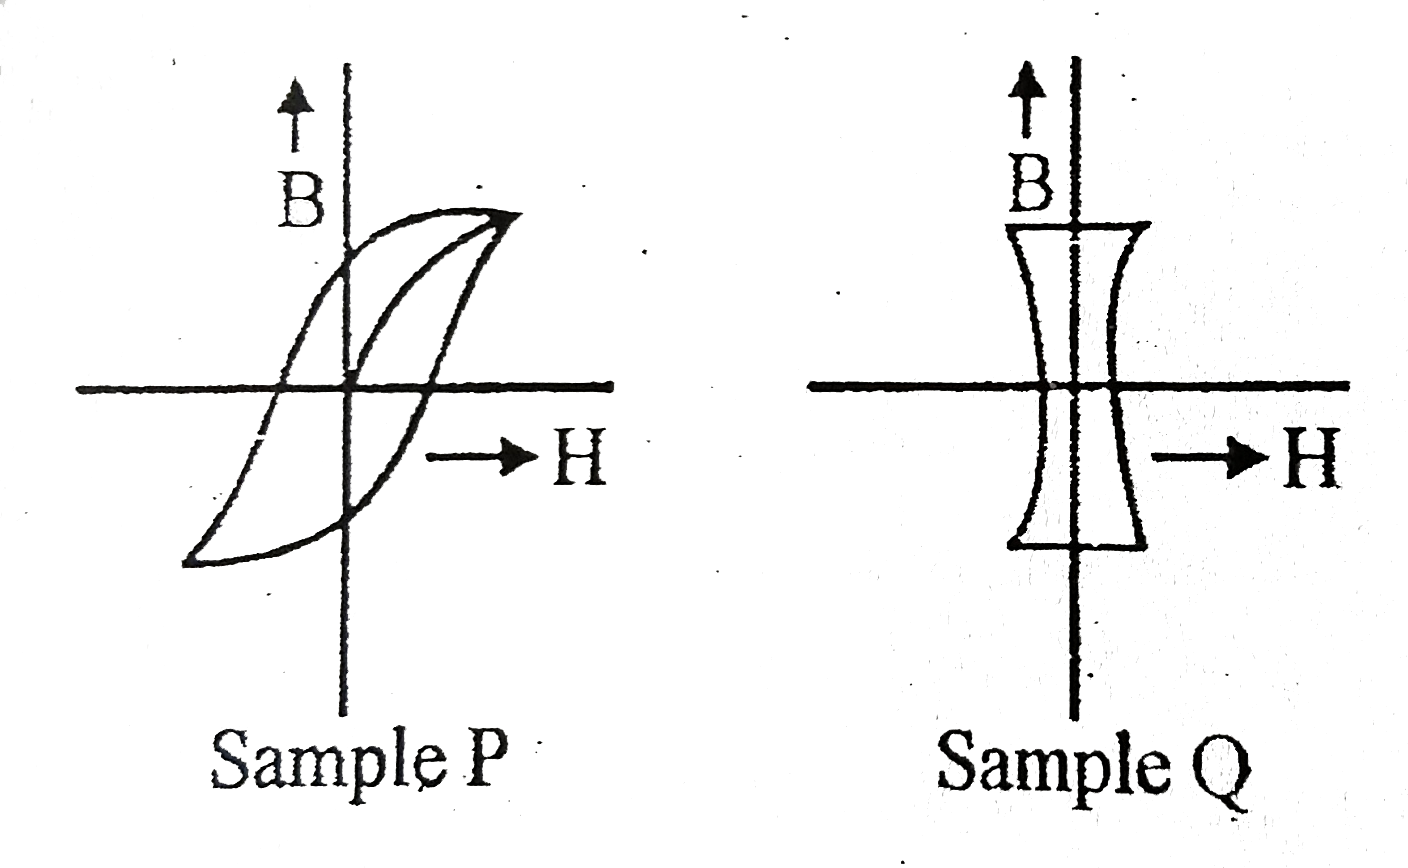
If the B-H curves of two samples of P and Q of iron are as shown below, then which one of the following statements is CORRECT?
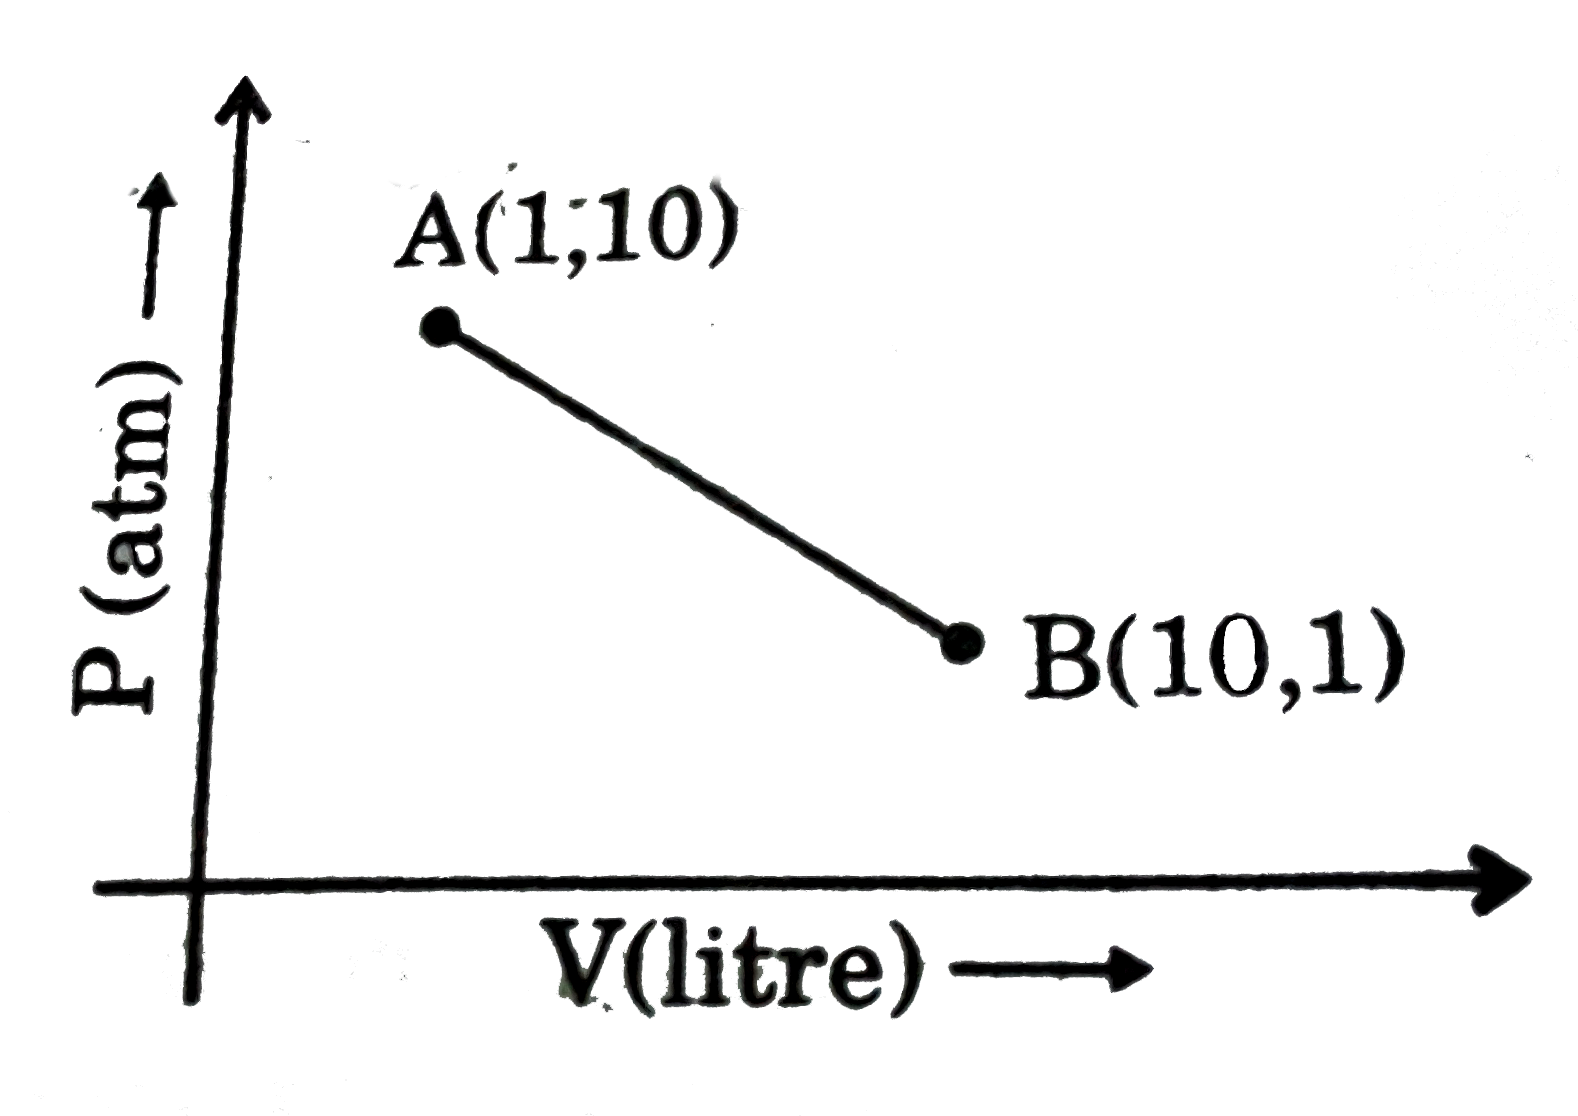
View SolutionFor 1 mole of an ideal gas, a graph of pressure vs volume is plotted as shown. Which of the following option is correct ?
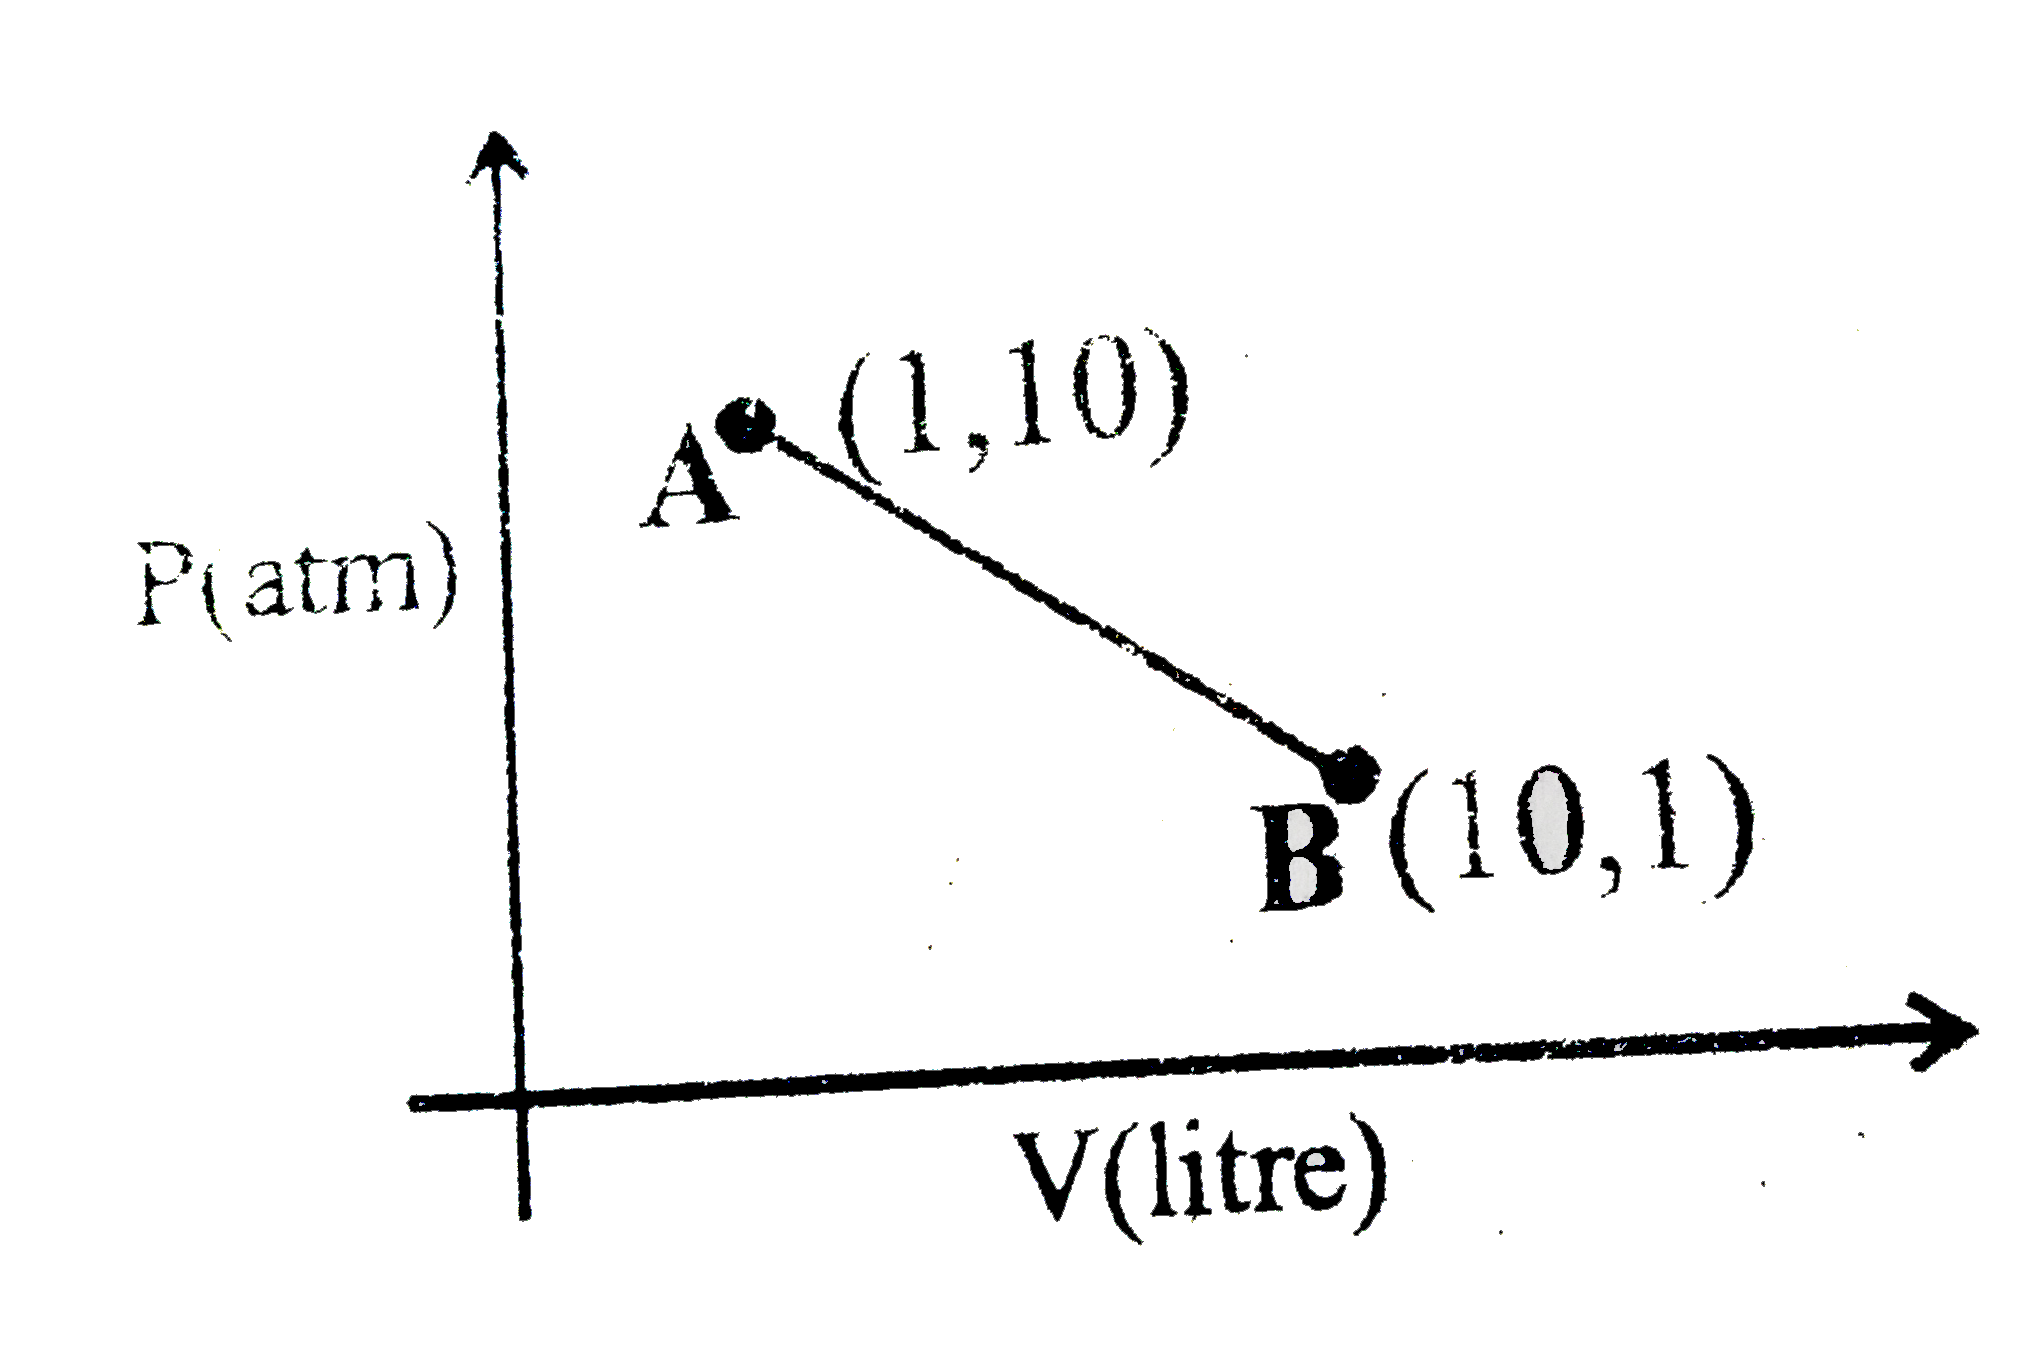
View SolutionFor 1 mole of an ideal gas, a graph of pressure vs volume is plotted as shown. Which of the following options is correct ?
View SolutionFor an ideal gas V−T curves at constant pressure P1 & P2 are shown in figure, from the figure
_E01_061_Q01.png)
View SolutionAn ideal gas is expandend isothermally from(P1V1) and to (P2V2) against a constant external pressure. Which of the following is/are correct regarding above process ?
View Solution
