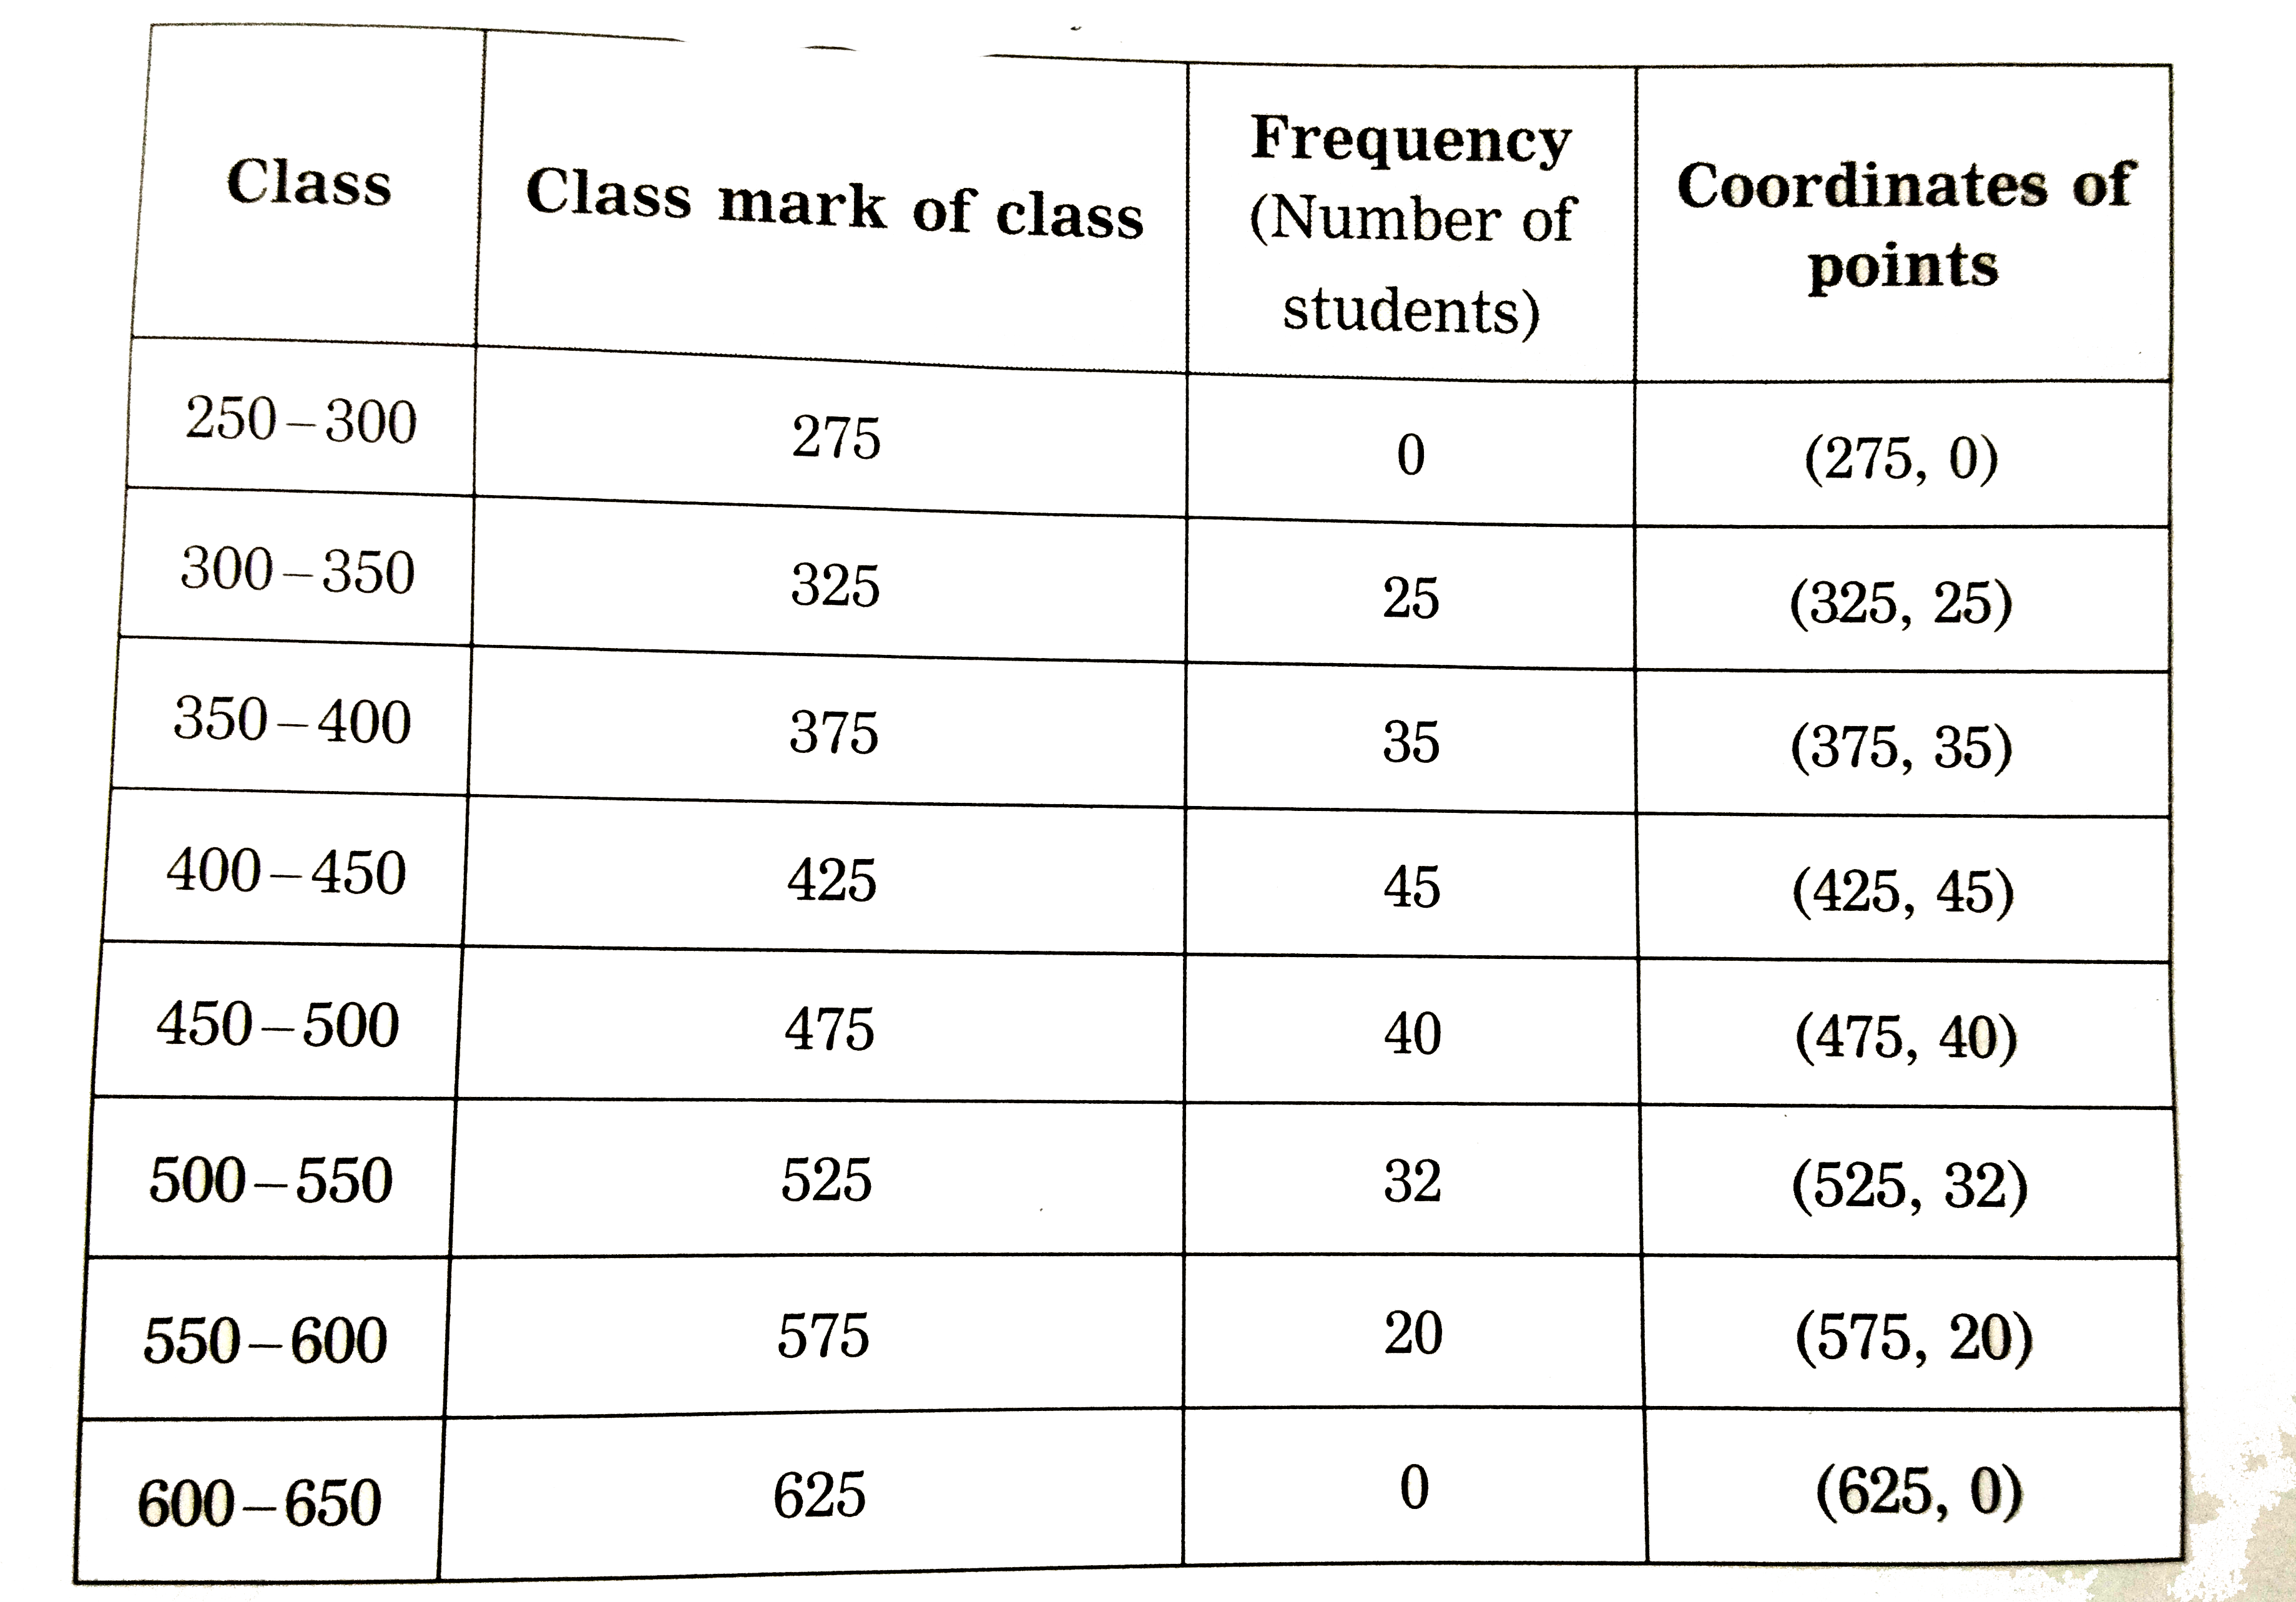
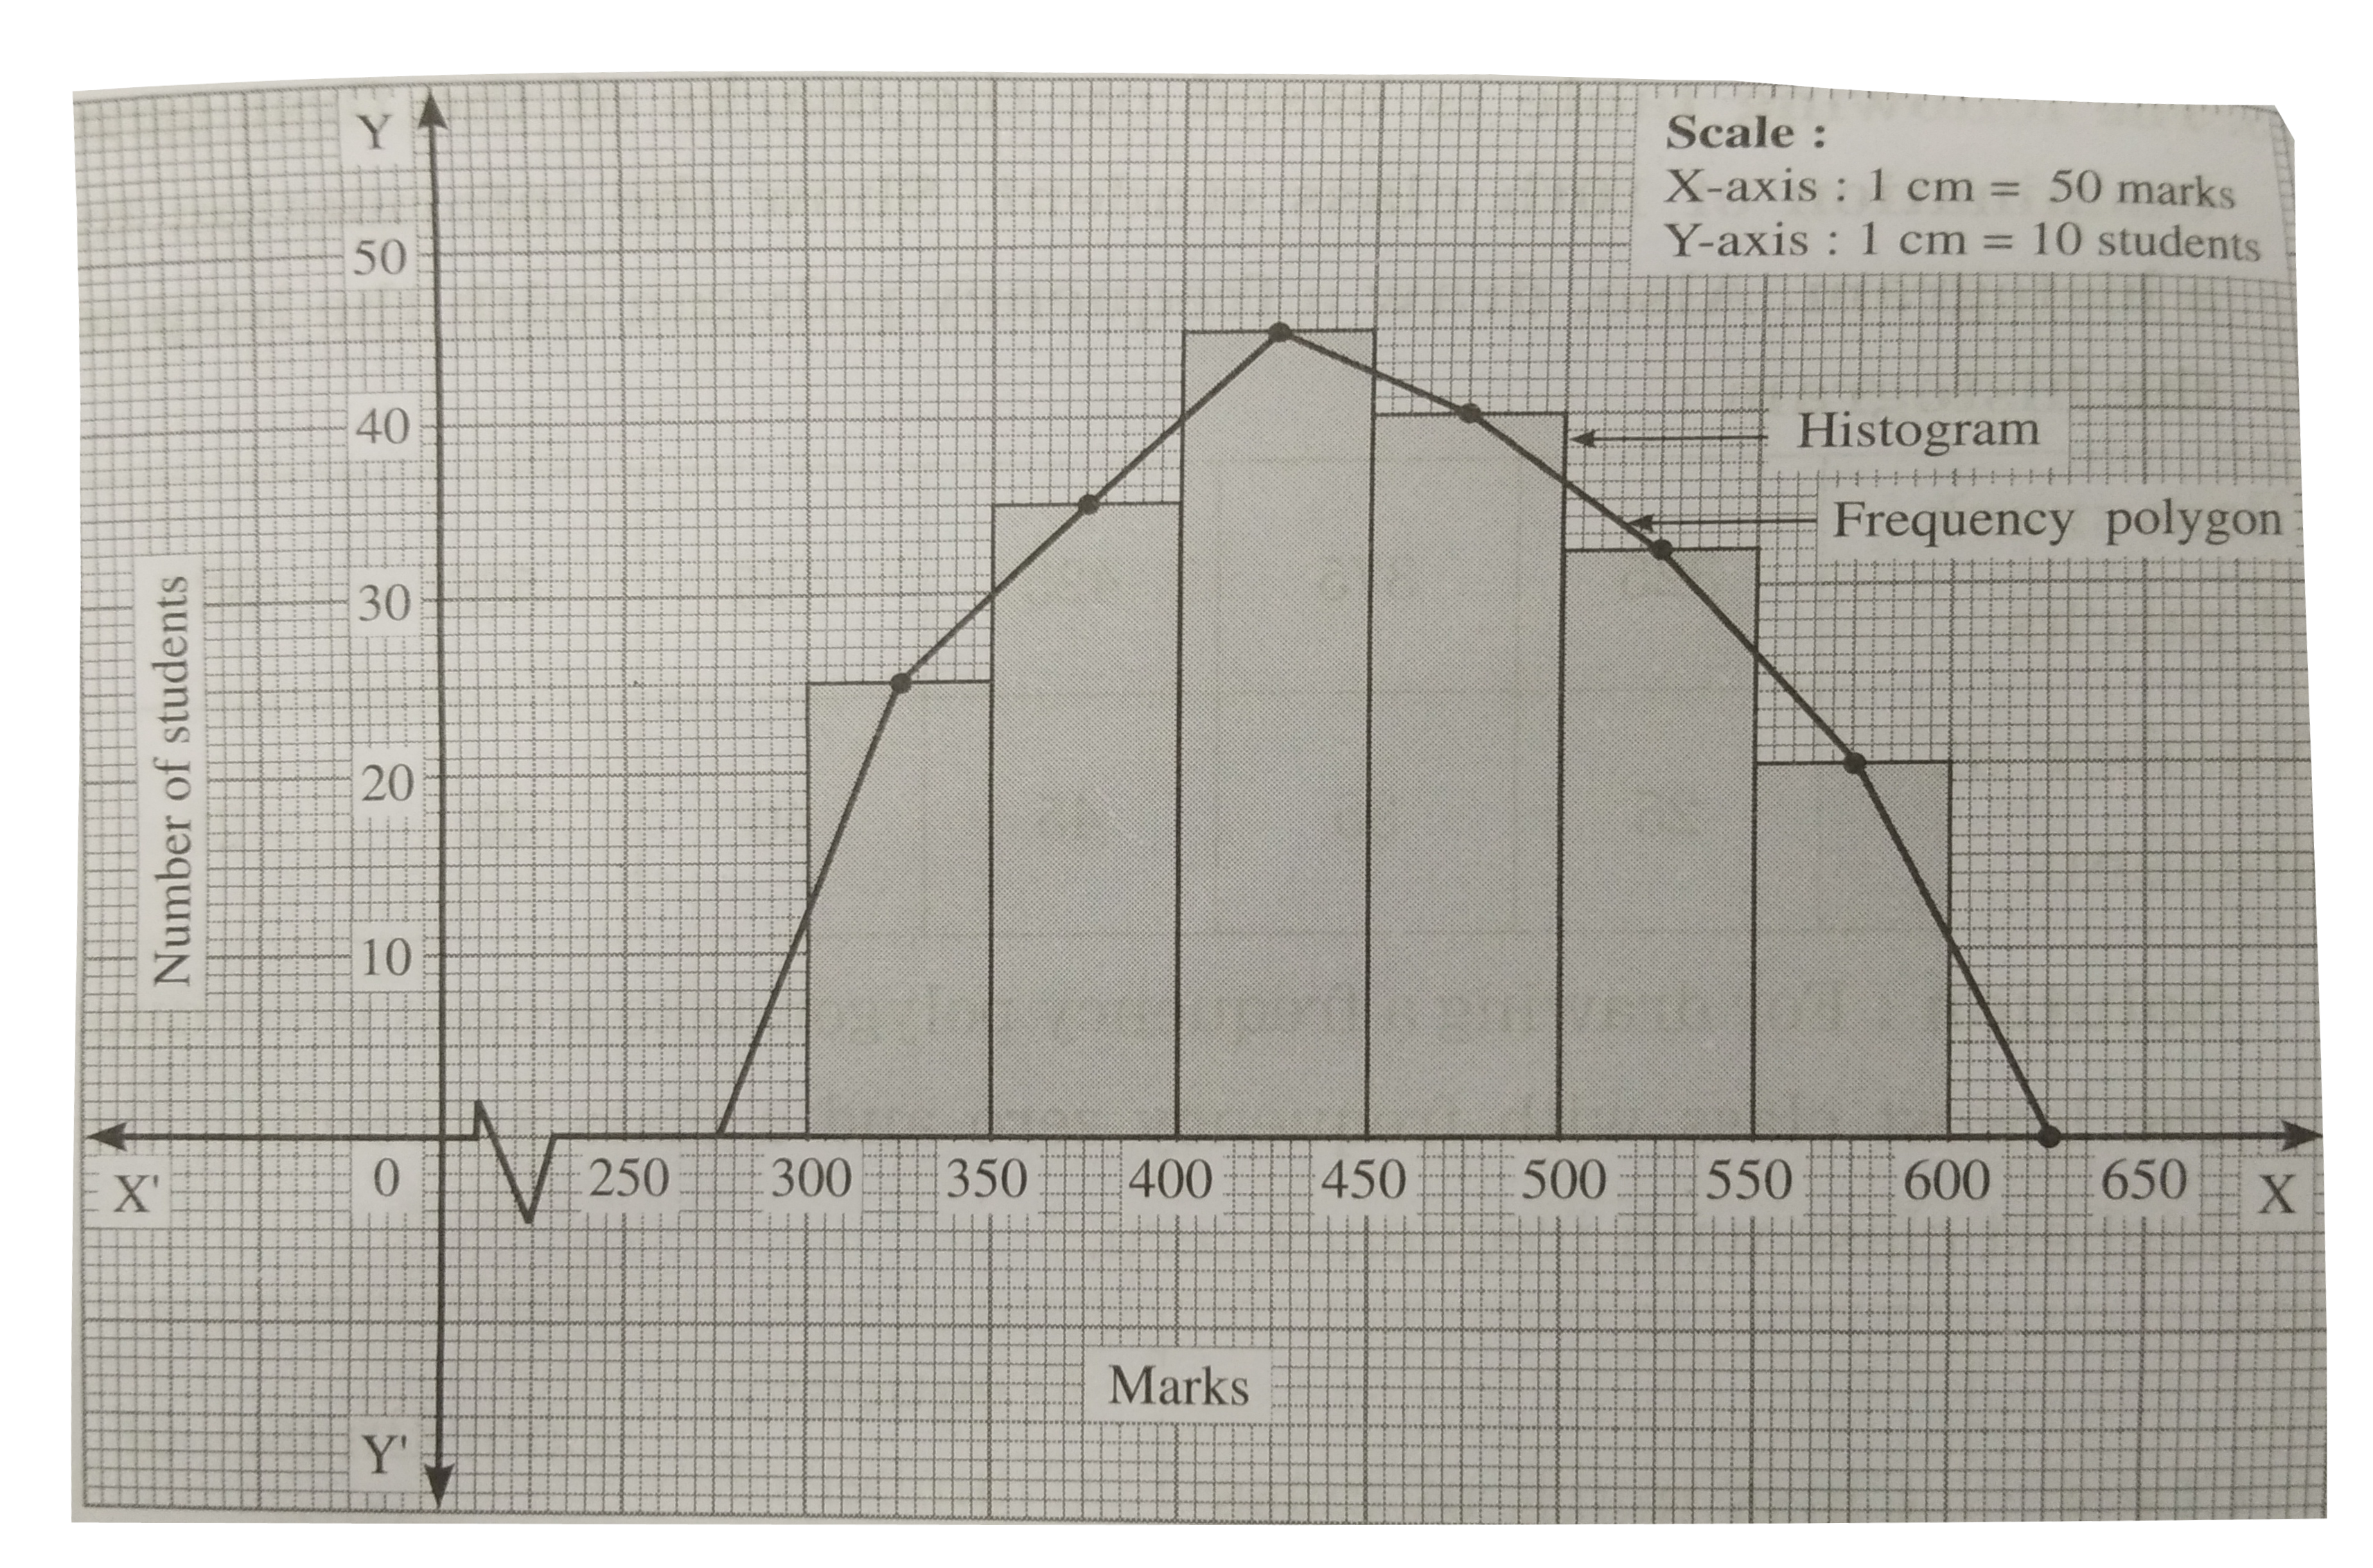
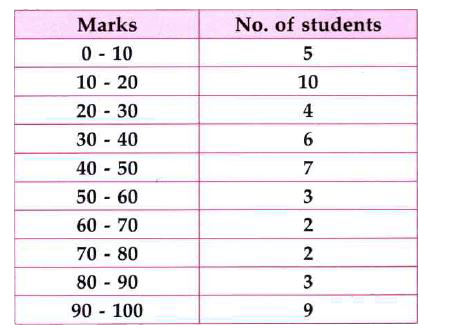
The following table is based on the marks of the first term examination of 10 th class student. Show the information by a histogram. Also, draw a frequency polygon with the help of the histogram:

For drawing a frequency polygon take a class preceding the lowest class with frequency zero and a class succeeding the highest class with frequency zero.


Topper's Solved these Questions
- BOOK - NAVNEET PUBLICATION - MAHARASHTRA BOARDCHAPTER - CHALLENGING QUESTIONS EXERCISE - EXAMPLE FOR PRACTICE22videos
CHALLENGING QUESTIONS
- BOOK - NAVNEET PUBLICATION - MAHARASHTRA BOARDCHAPTER - BOARD'S QUESTION PAPER : MARCH 2019EXERCISE - QUESTION30videos
BOARD'S QUESTION PAPER : MARCH 2019
- BOOK - NAVNEET PUBLICATION - MAHARASHTRA BOARDCHAPTER - CHALLENGING QUESTIONSEXERCISE - SECTION 3 (MODEL QUESTION PAPER FOR PRACTICE ) Solve any one of the following subquestions :1videos
CHALLENGING QUESTIONS
Similar Questions
The following table is based on the marks of the first term examination of 10th class students . Show the information by a histogram. Also, draw a frequency polygon with the help of the histogram :
 View Solution
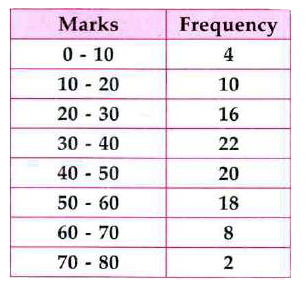
For the following data, draw a histogram and a frequency polygon
 View Solution
The following table gives the marks scored by 100 students in an entrance examination

Represent this data in the form of a histogram.View SolutionThe following table shows the marks obtained by Sumit in the annual examination.

Draw a bar graph to show the above information.View SolutionDraw a histogram, a frequency polygon and frequency curve of the following data :
 View Solution
The following tale gives the result of certain examination for 180 students. Find the value of x and draw histogram.
 View Solution
Draw histogram and frequency polygon for the following distribution :
 View Solution
The following table shows the investment made by some families. Shows the information by a histogram.
 View Solution
The following table shows the distribution of weights of seeds. Draw a frequency polygon.
 View Solution
The following table shows the weights of children and the number of children. Draw a frequency polygon showing the information.
 View Solution

