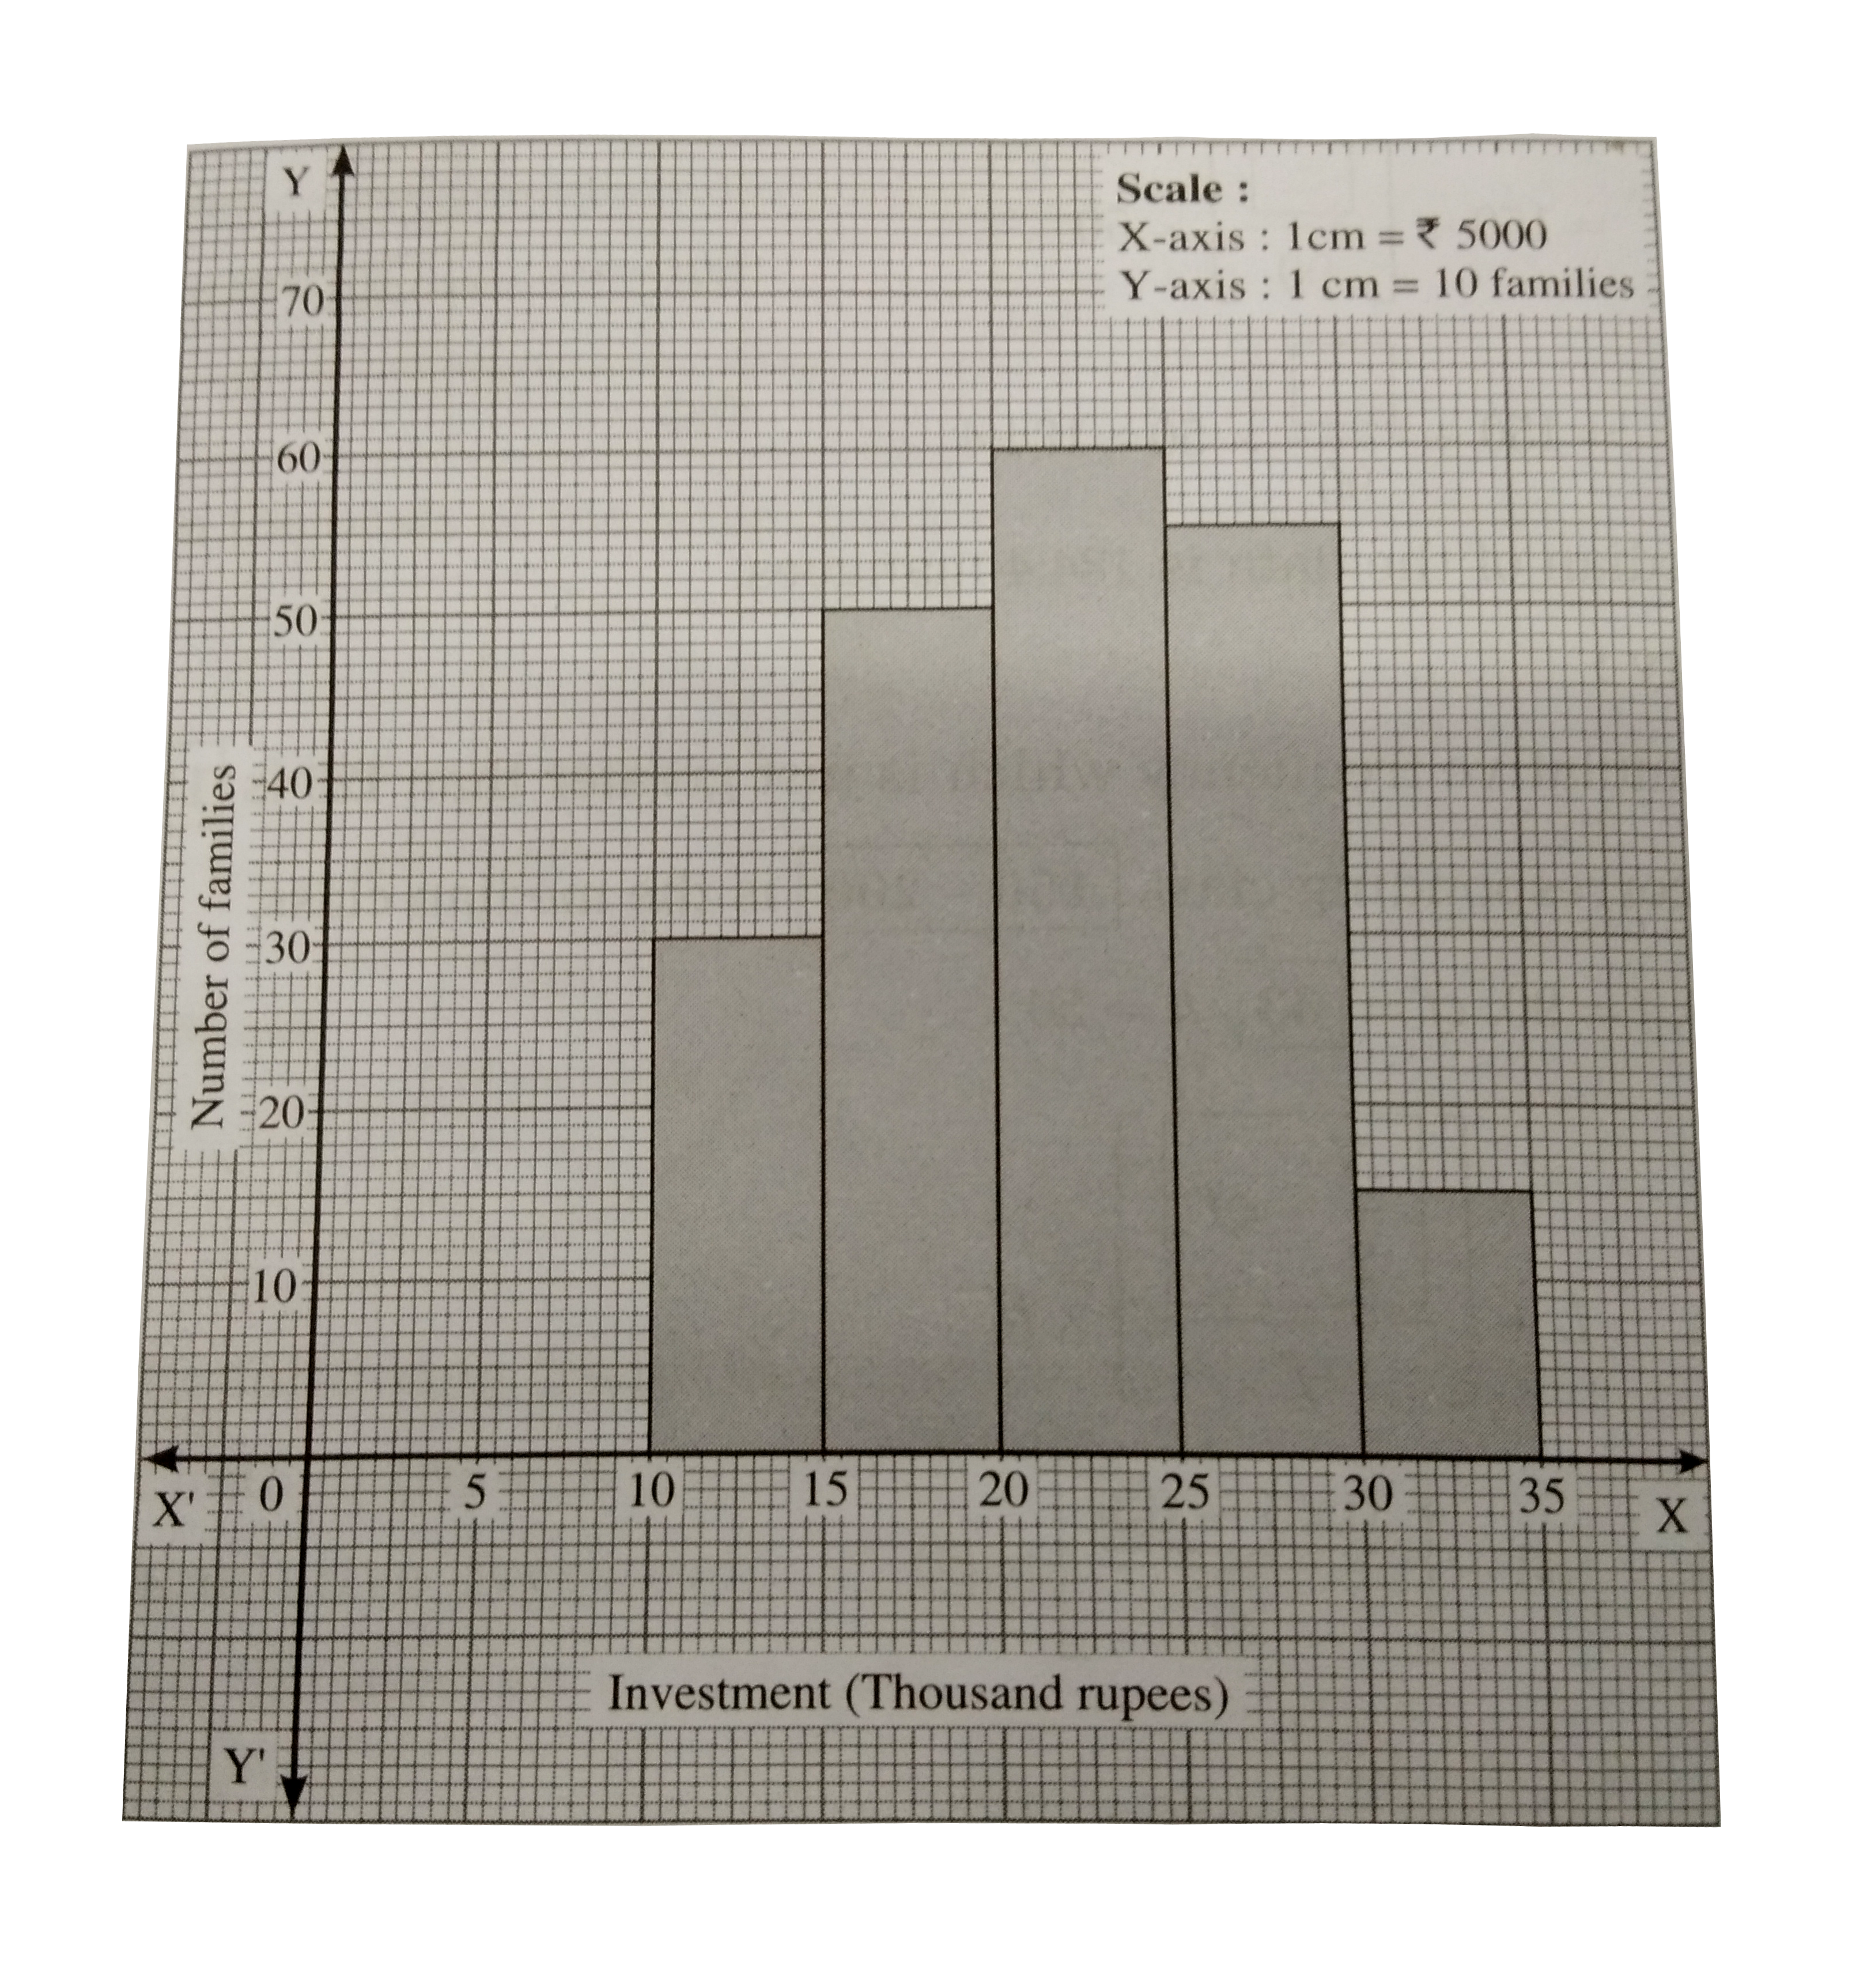
The following table shows the investment made by some families. Shows the information by a histogram.

Topper's Solved these Questions
- BOOK - NAVNEET PUBLICATION - MAHARASHTRA BOARDCHAPTER - STATISTICSEXERCISE - Assignment 6.14videos
STATISTICS
- BOOK - NAVNEET PUBLICATION - MAHARASHTRA BOARDCHAPTER - STATISTICSEXERCISE - Assignment 6.25videos
STATISTICS
- BOOK - NAVNEET PUBLICATION - MAHARASHTRA BOARDCHAPTER - SIMILARITYEXERCISE - SUBJECTIVE TYPE20videos
SIMILARITY
- BOOK - NAVNEET PUBLICATION - MAHARASHTRA BOARDCHAPTER - THEOREMS EXERCISE - CIRCLE15videos
THEOREMS
Similar Questions
Knowledge Check
- Question 1 - Select One
The following table shows the monthly salaries (in Rs) of 50 families.

How many families have a monthly salary less than Rs. 40,000?A46B9C18D27
IN the following table,the investment made by 210 families is shown.Present it in the form of a histogram.
 View Solution
The following table shows the average rainfall in 150 towns. Towns. Show the information by a ferquency polygon.
 View Solution
The following table is based on the marks of the first term examination of 10 th class student. Show the information by a histogram. Also, draw a frequency polygon with the help of the histogram:
 View Solution
The following table is based on the marks of the first term examination of 10th class students . Show the information by a histogram. Also, draw a frequency polygon with the help of the histogram :
 View Solution
The following table shows the number of students in different classes of a high school. Draw a histogram to represent the given data.
ClassesVIVIIVIIIIXXNumber of students3742355048View SolutionThe following table shows the income of formers in a grape season. Find the mean of their income.
 View Solution
The following table shows the income of farmers in a grape season. Find the mean of their income.
 View Solution


