Which is not the graphical representation for the zeroth order reaction ?
The correct Answer is:C
To determine which graphical representation is not appropriate for a zero-order reaction, we need to understand the characteristics of zero-order kinetics.
1. Understanding Zero-order Reactions:
- In a zero-order reaction, the rate of reaction (R) is constant and does not depend on the concentration of the reactants. This can be expressed mathematically as:
R=k
where k is the rate constant.
2. Graphical Representations:
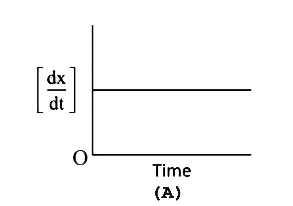
- Rate vs. Concentration: Since the rate is constant and does not depend on concentration, plotting the rate (dx/dt) against concentration will yield a horizontal line (a straight line parallel to the x-axis).
- Rate vs. Time: The rate remains constant over time, so this plot will also be a horizontal line.
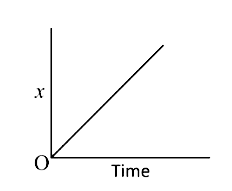
- Concentration vs. Time: For a zero-order reaction, the concentration of the reactant decreases linearly over time. This will yield a straight line with a negative slope.
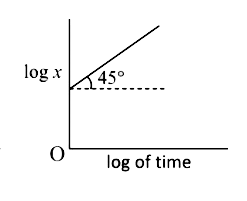
- Log(Concentration) vs. Time: This plot will not yield a straight line for a zero-order reaction. Instead, it will be a curve since the logarithm of a linear function does not produce a linear graph.
3. Identifying the Incorrect Representation:
- Based on the analysis:
- Option 1: Rate vs. Concentration - Correct representation (horizontal line).
- Option 2: Rate vs. Time - Correct representation (horizontal line).
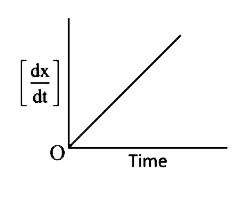
- Option 3: Rate vs. Time - Incorrect representation (this is the same as option 1).
- Option 4: Log(Concentration) vs. Time - Incorrect representation (not a straight line).
4. Conclusion:
- The graphical representation that is not appropriate for a zero-order reaction is the one that plots Log(Concentration) vs. Time. Therefore, the answer is Option 3.
- In a zero-order reaction, the rate of reaction (R) is constant and does not depend on the concentration of the reactants. This can be expressed mathematically as:
R=k
where k is the rate constant.
- Rate vs. Concentration: Since the rate is constant and does not depend on concentration, plotting the rate (dx/dt) against concentration will yield a horizontal line (a straight line parallel to the x-axis).
- Rate vs. Time: The rate remains constant over time, so this plot will also be a horizontal line.
- Concentration vs. Time: For a zero-order reaction, the concentration of the reactant decreases linearly over time. This will yield a straight line with a negative slope.
- Log(Concentration) vs. Time: This plot will not yield a straight line for a zero-order reaction. Instead, it will be a curve since the logarithm of a linear function does not produce a linear graph.
- Based on the analysis:
- Option 1: Rate vs. Concentration - Correct representation (horizontal line).
- Option 2: Rate vs. Time - Correct representation (horizontal line).
- Option 3: Rate vs. Time - Incorrect representation (this is the same as option 1).
- Option 4: Log(Concentration) vs. Time - Incorrect representation (not a straight line).
- The graphical representation that is not appropriate for a zero-order reaction is the one that plots Log(Concentration) vs. Time. Therefore, the answer is Option 3.
Topper's Solved these Questions
- CHEMICAL KINETICS Book:VMC MODULES ENGLISHChapter:CHEMICAL KINETICS Exercise:Level-2
Explore 50 Videos
- CHEMICAL KINETICS Book:VMC MODULES ENGLISHChapter:CHEMICAL KINETICS Exercise:Level-2 ( Numerical Value Type for JEE Main )
Explore 15 Videos
- CHEMICAL KINETICS Book:VMC MODULES ENGLISHChapter:CHEMICAL KINETICS Exercise:Level-0 (Long Answer Type )
Explore 6 Videos
- CHEMICAL EQUILIBRIUMBook:VMC MODULES ENGLISHChapter:CHEMICAL EQUILIBRIUMExercise:IN-CHAPTER EXERCISE - G
Explore 10 Videos
- CHEMICAL THERMODYNAMICS Book:VMC MODULES ENGLISHChapter:CHEMICAL THERMODYNAMICS Exercise:IN - CHAPTER EXERCISE - L
Explore 10 Videos
Similar Questions
Knowledge Check
Which is the true graphical representation of V vs 1/P
A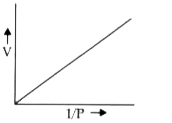 B
B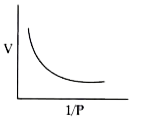 C
C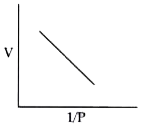 D
D
The true graphical representation of volume versus temperature relationship at constant pressure is :
A B
B C
C D
D
Which of the following graph is correct for a zero order reaction ?
View SolutionGive a graphic representation of the C3 cycle.
View SolutionIn the following graphical representation for the reaction A→B, there are two types of regions:
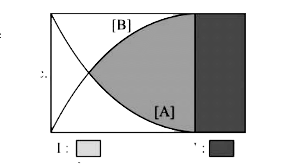
View SolutionWhich is the correct graphical representation based on photoelectric effect ?
View SolutionSymbolic representation of a chemical reaction.
View SolutionWhich of the following graph is correct for zero order reaction?
View Solution