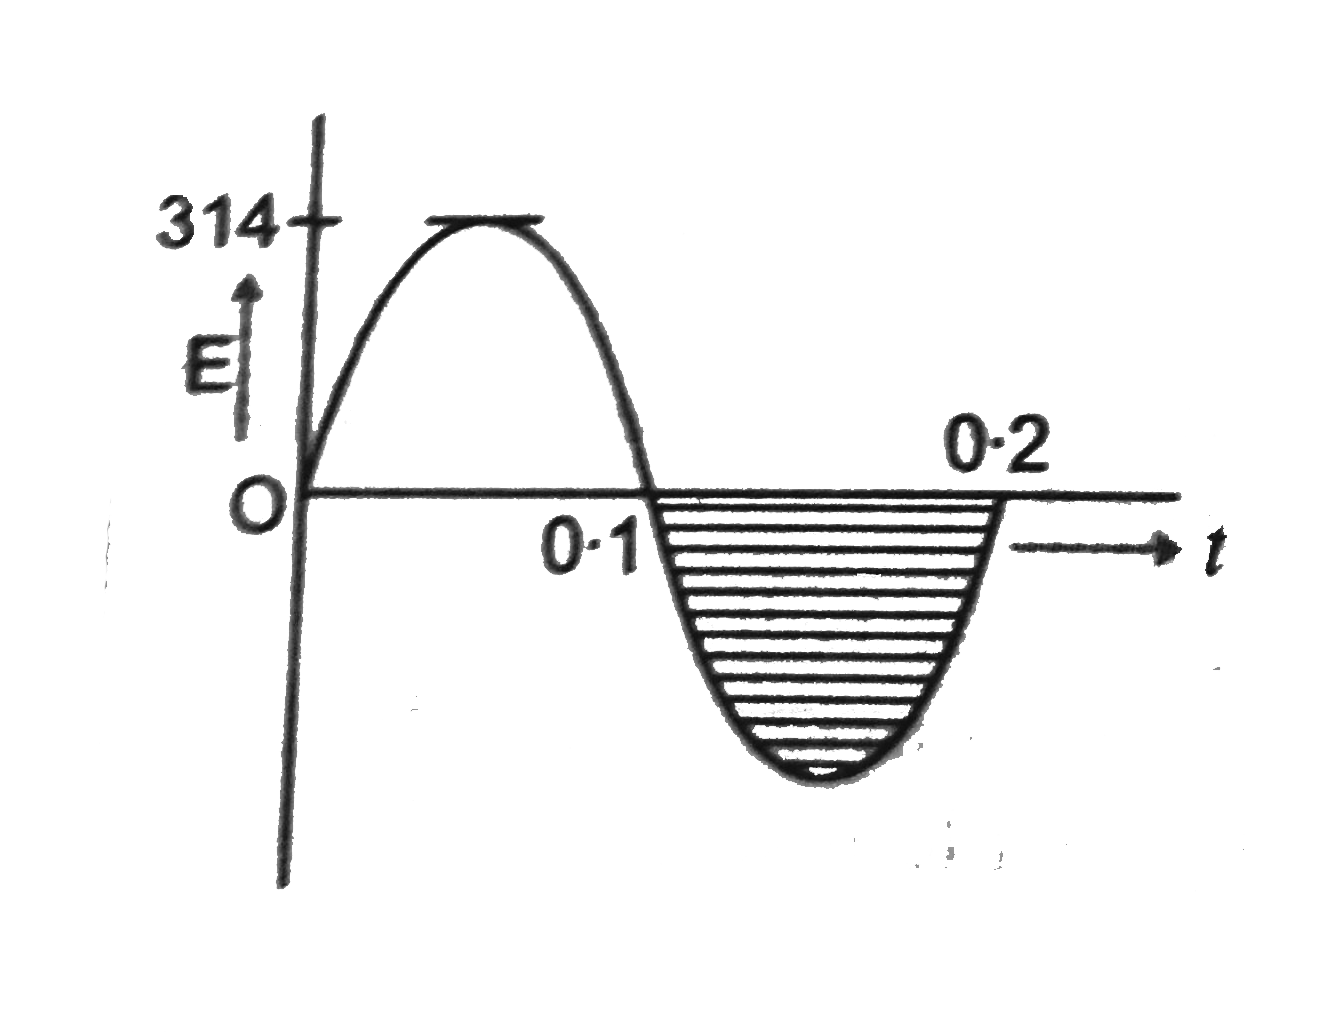
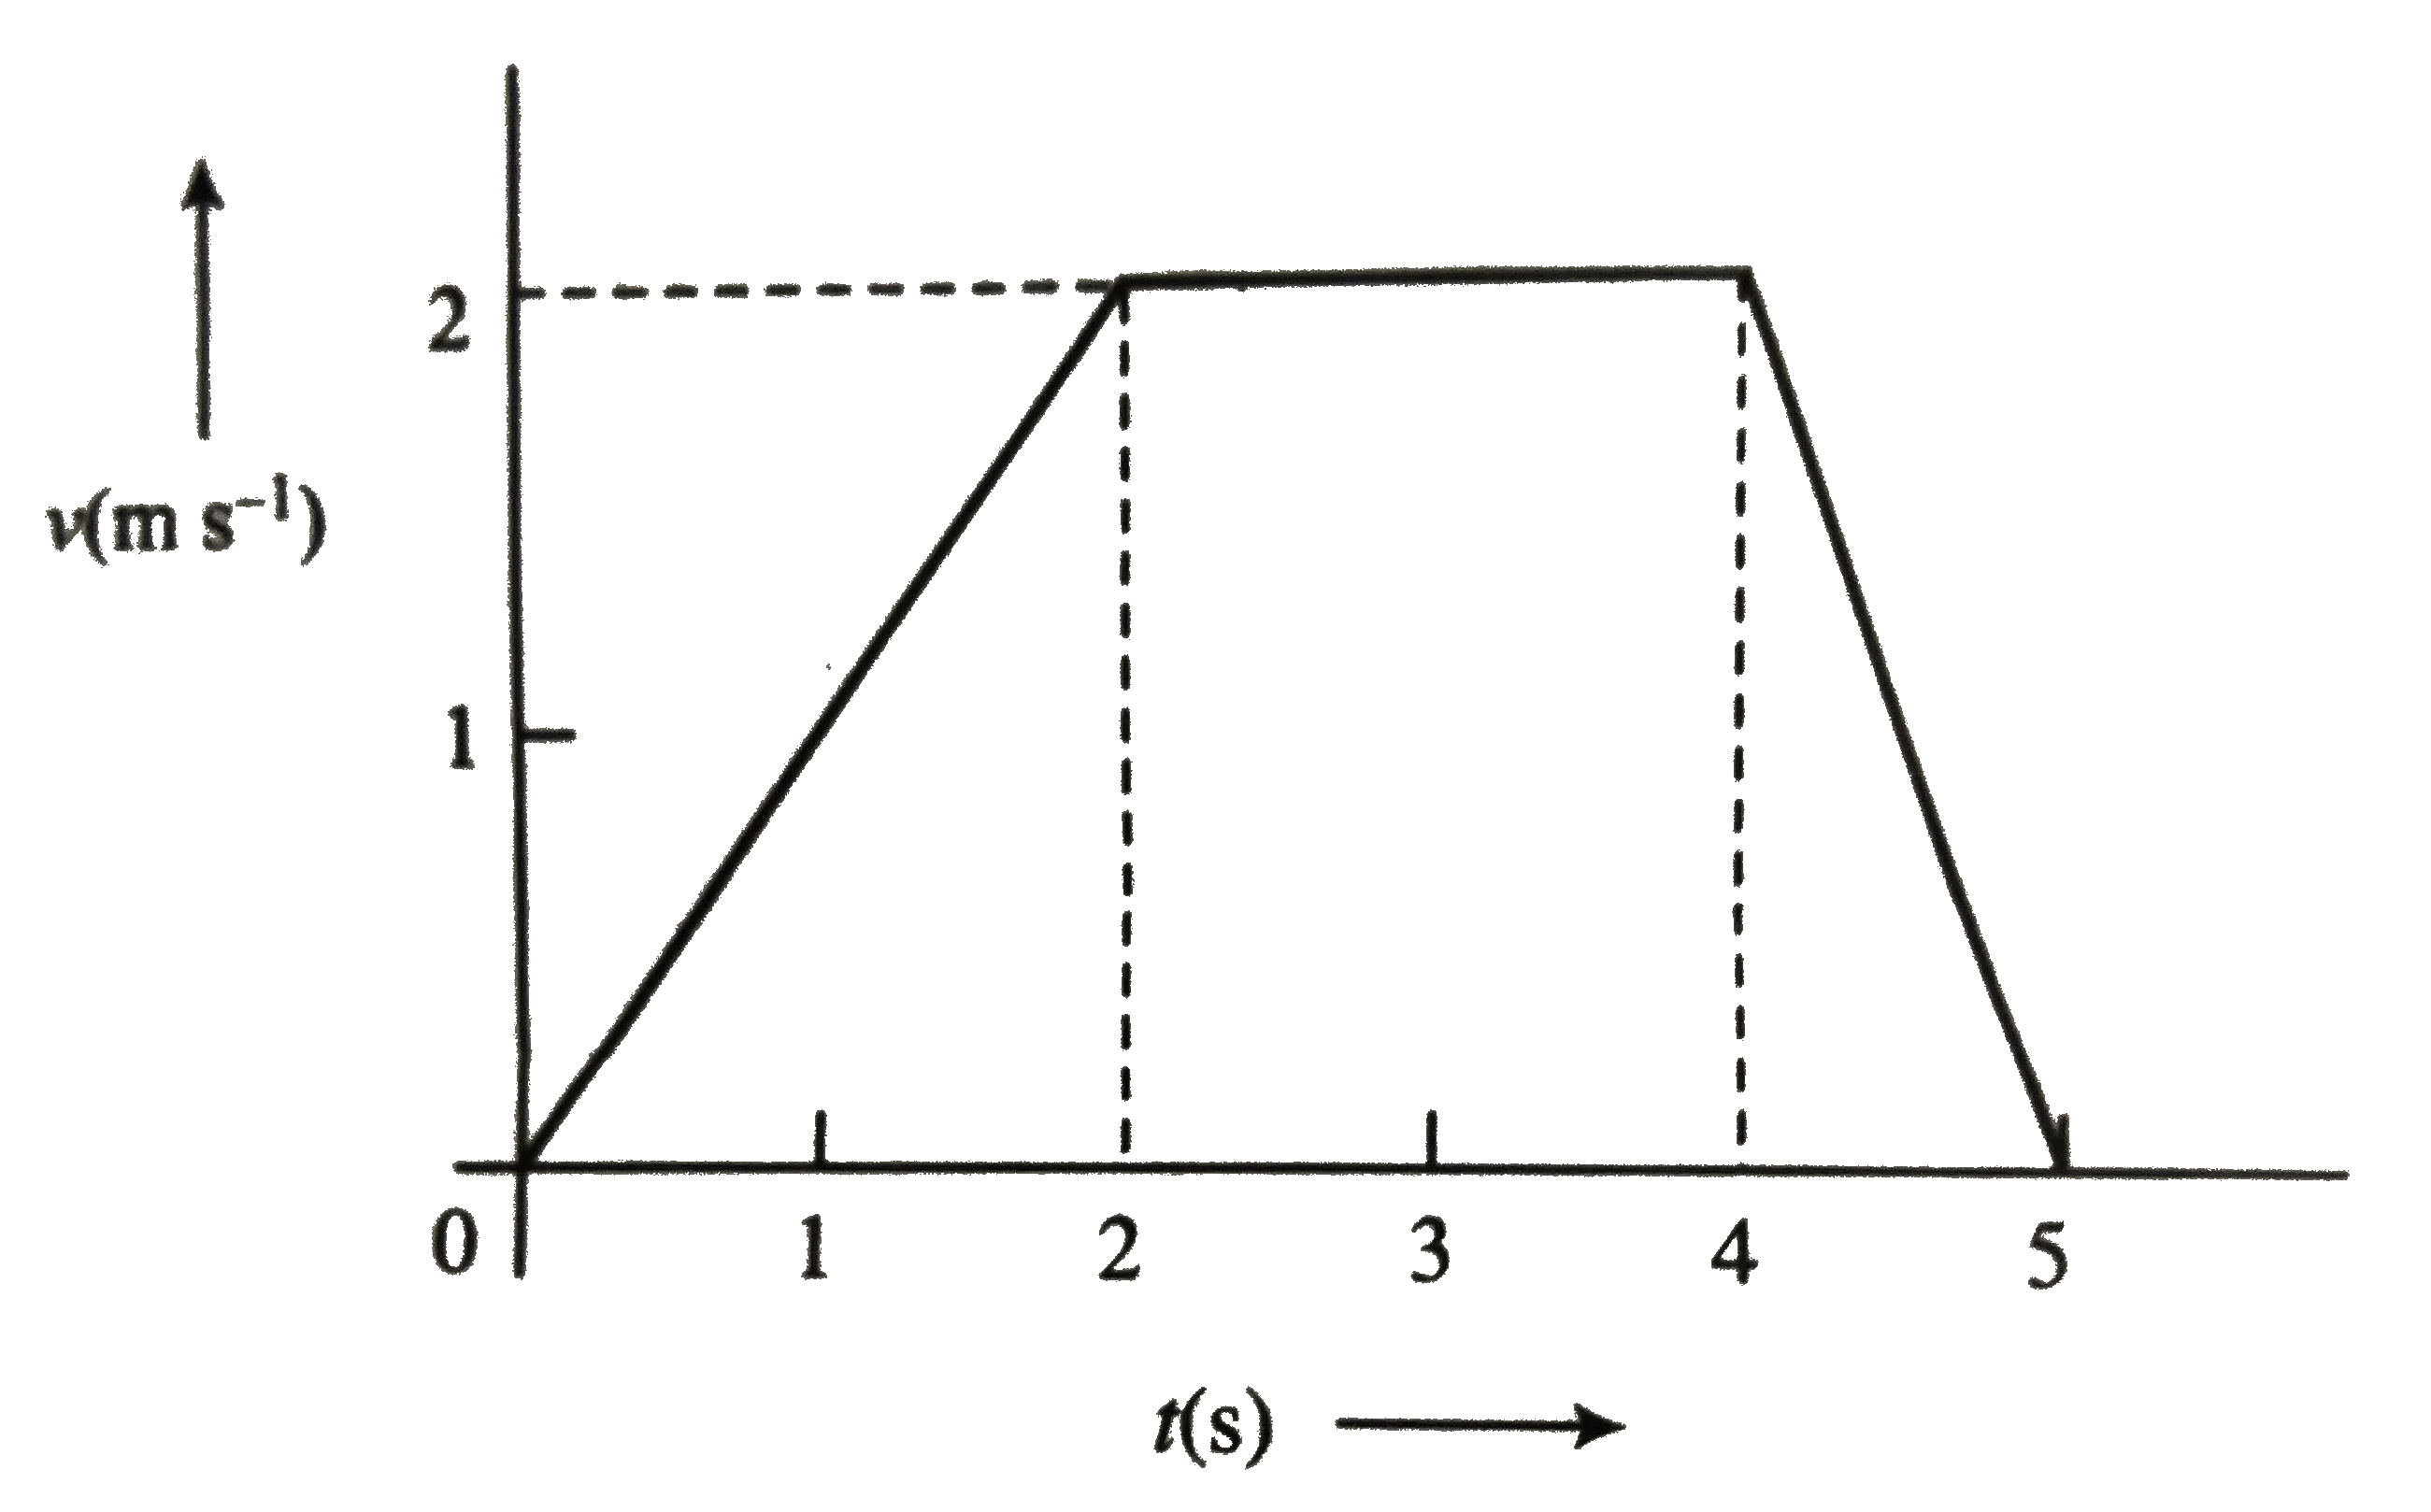
Starting at x=0, a particle moves according to the graph of v vs t shown in . Sketch a staph of the instantaneoud acceleration a vs t, indicationg numerical values at significant points of the graph.
 .
.
Video Solution
Text Solution
The correct Answer is:N//S
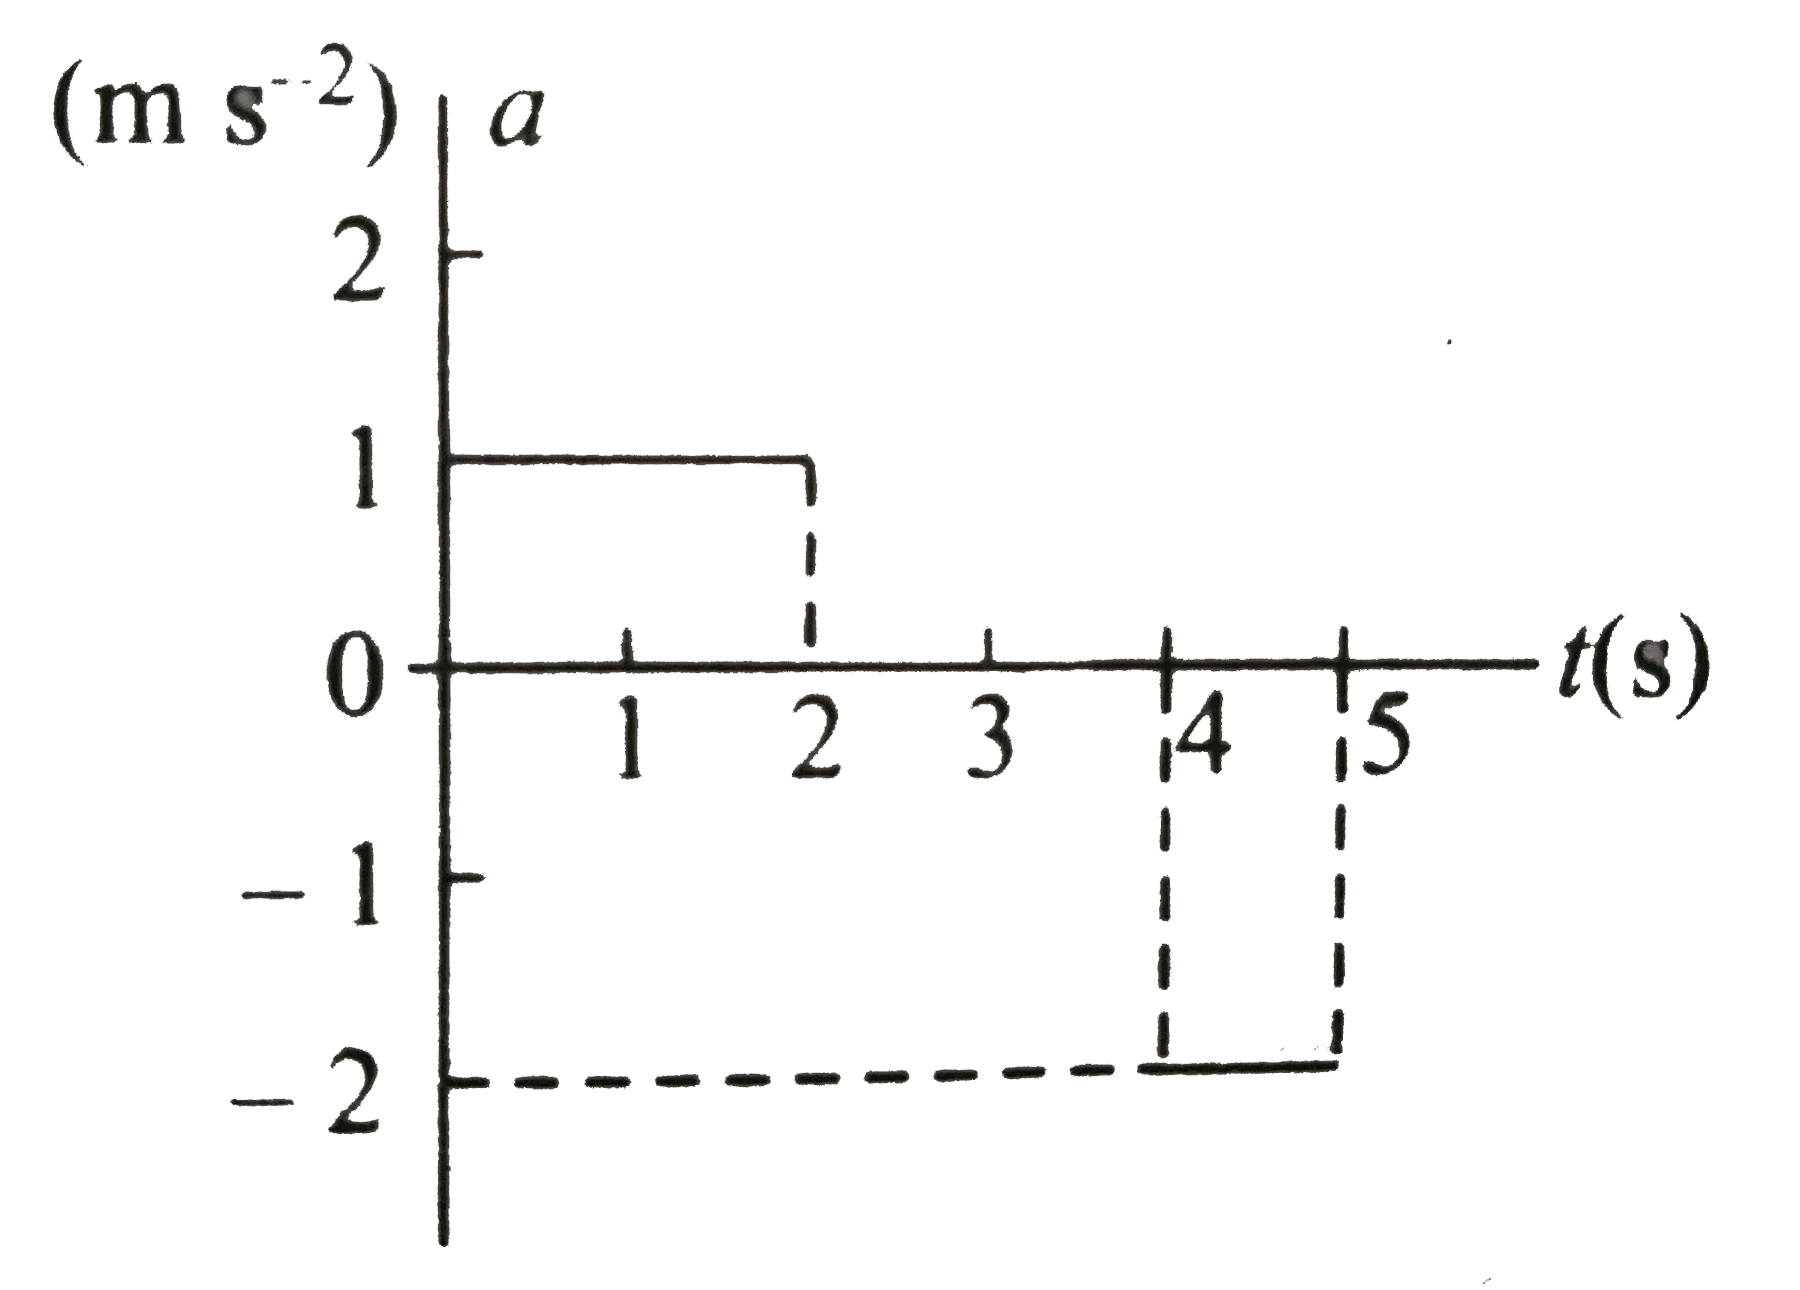
To find a, we apply the relation a=dv/dt, which is the sane as a=Δv/Δ over time intervals in which v varies linearly with t. For the time interval between t0=0 and t1=2s, the slope of the graph is positive and constant, equal to
a1=ΔvΔt=(v1−v0)(t1−t0)=(2ms1−0)2s−0=1ms−2
Between t1=2s and t2=4s, the slope is zero. So the acceleration is zero for this time interval.
Between t2=4s and t3=5s, the slopeis negative and constant, equal to
 .
.
a2=ΔvΔt=(v3−v2)(t3−t2)
=(0−2ms−1)5s−4s=−2ms−2
is a graph of the a1=ΔvΔr=(v1−v0)(t1−t0)
=(2ms2−0)2s−0=1ms−2
is a graph of the instantaneous acceleration for the motion.
|
Topper's Solved these Questions
- KINEMATICS-1BOOK - CENGAGE PHYSICSCHAPTER - KINEMATICS-1EXERCISE - Single Correct
52 Videos
- KINEMATICS-1BOOK - CENGAGE PHYSICSCHAPTER - KINEMATICS-1EXERCISE - Graphical Concept
17 Videos
- KINEMATICS-1BOOK - CENGAGE PHYSICSCHAPTER - KINEMATICS-1EXERCISE - Exercise 4.4
16 Videos
- GRAVITATIONBOOK - CENGAGE PHYSICSCHAPTER - GRAVITATIONEXERCISE - INTEGER_TYPE
1 Videos
- KINEMATICS-2BOOK - CENGAGE PHYSICSCHAPTER - KINEMATICS-2EXERCISE - Exercise Integer
9 Videos
Similar Questions
Knowledge Check
The v-x graph for a particle moving along a straight line is shown in the figure. At which of the points marked, the acceleration is negative?
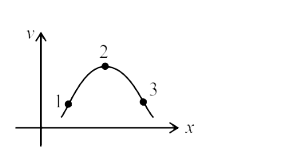 A1B3C1 and 2D3 and 2
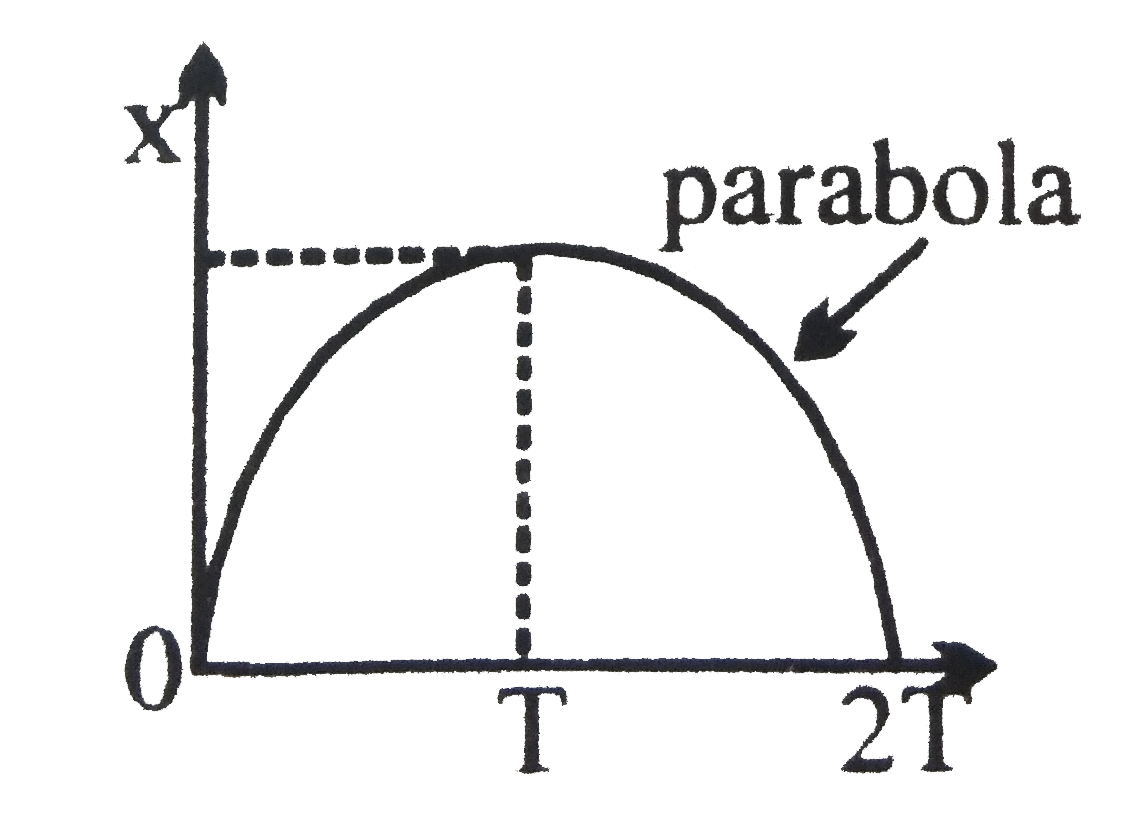
The x-t graph of a particle moving along a straight line is shown in figure
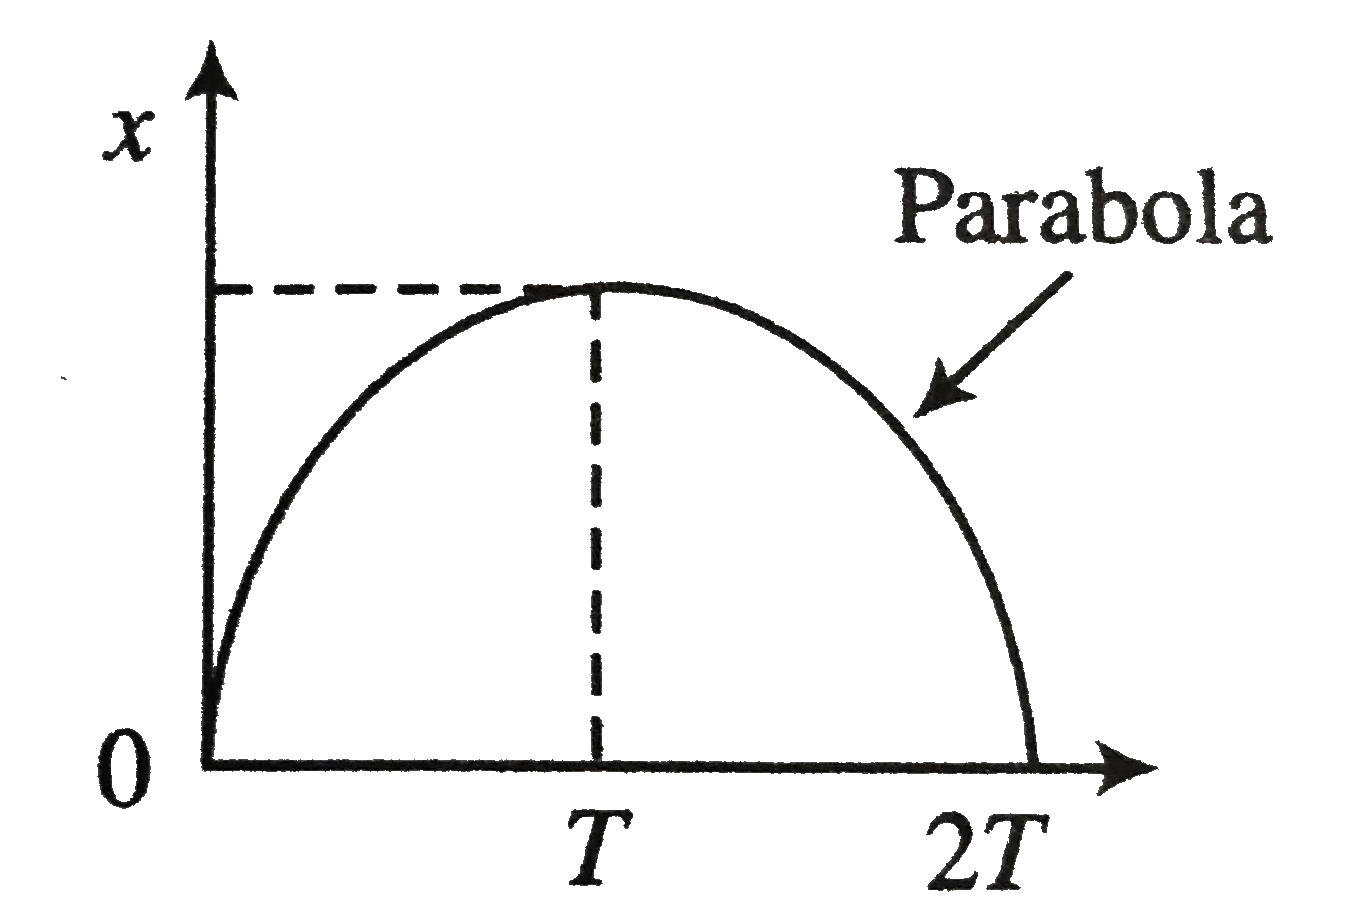
The a-t graph of the particle is correctly shown byA B
B C
C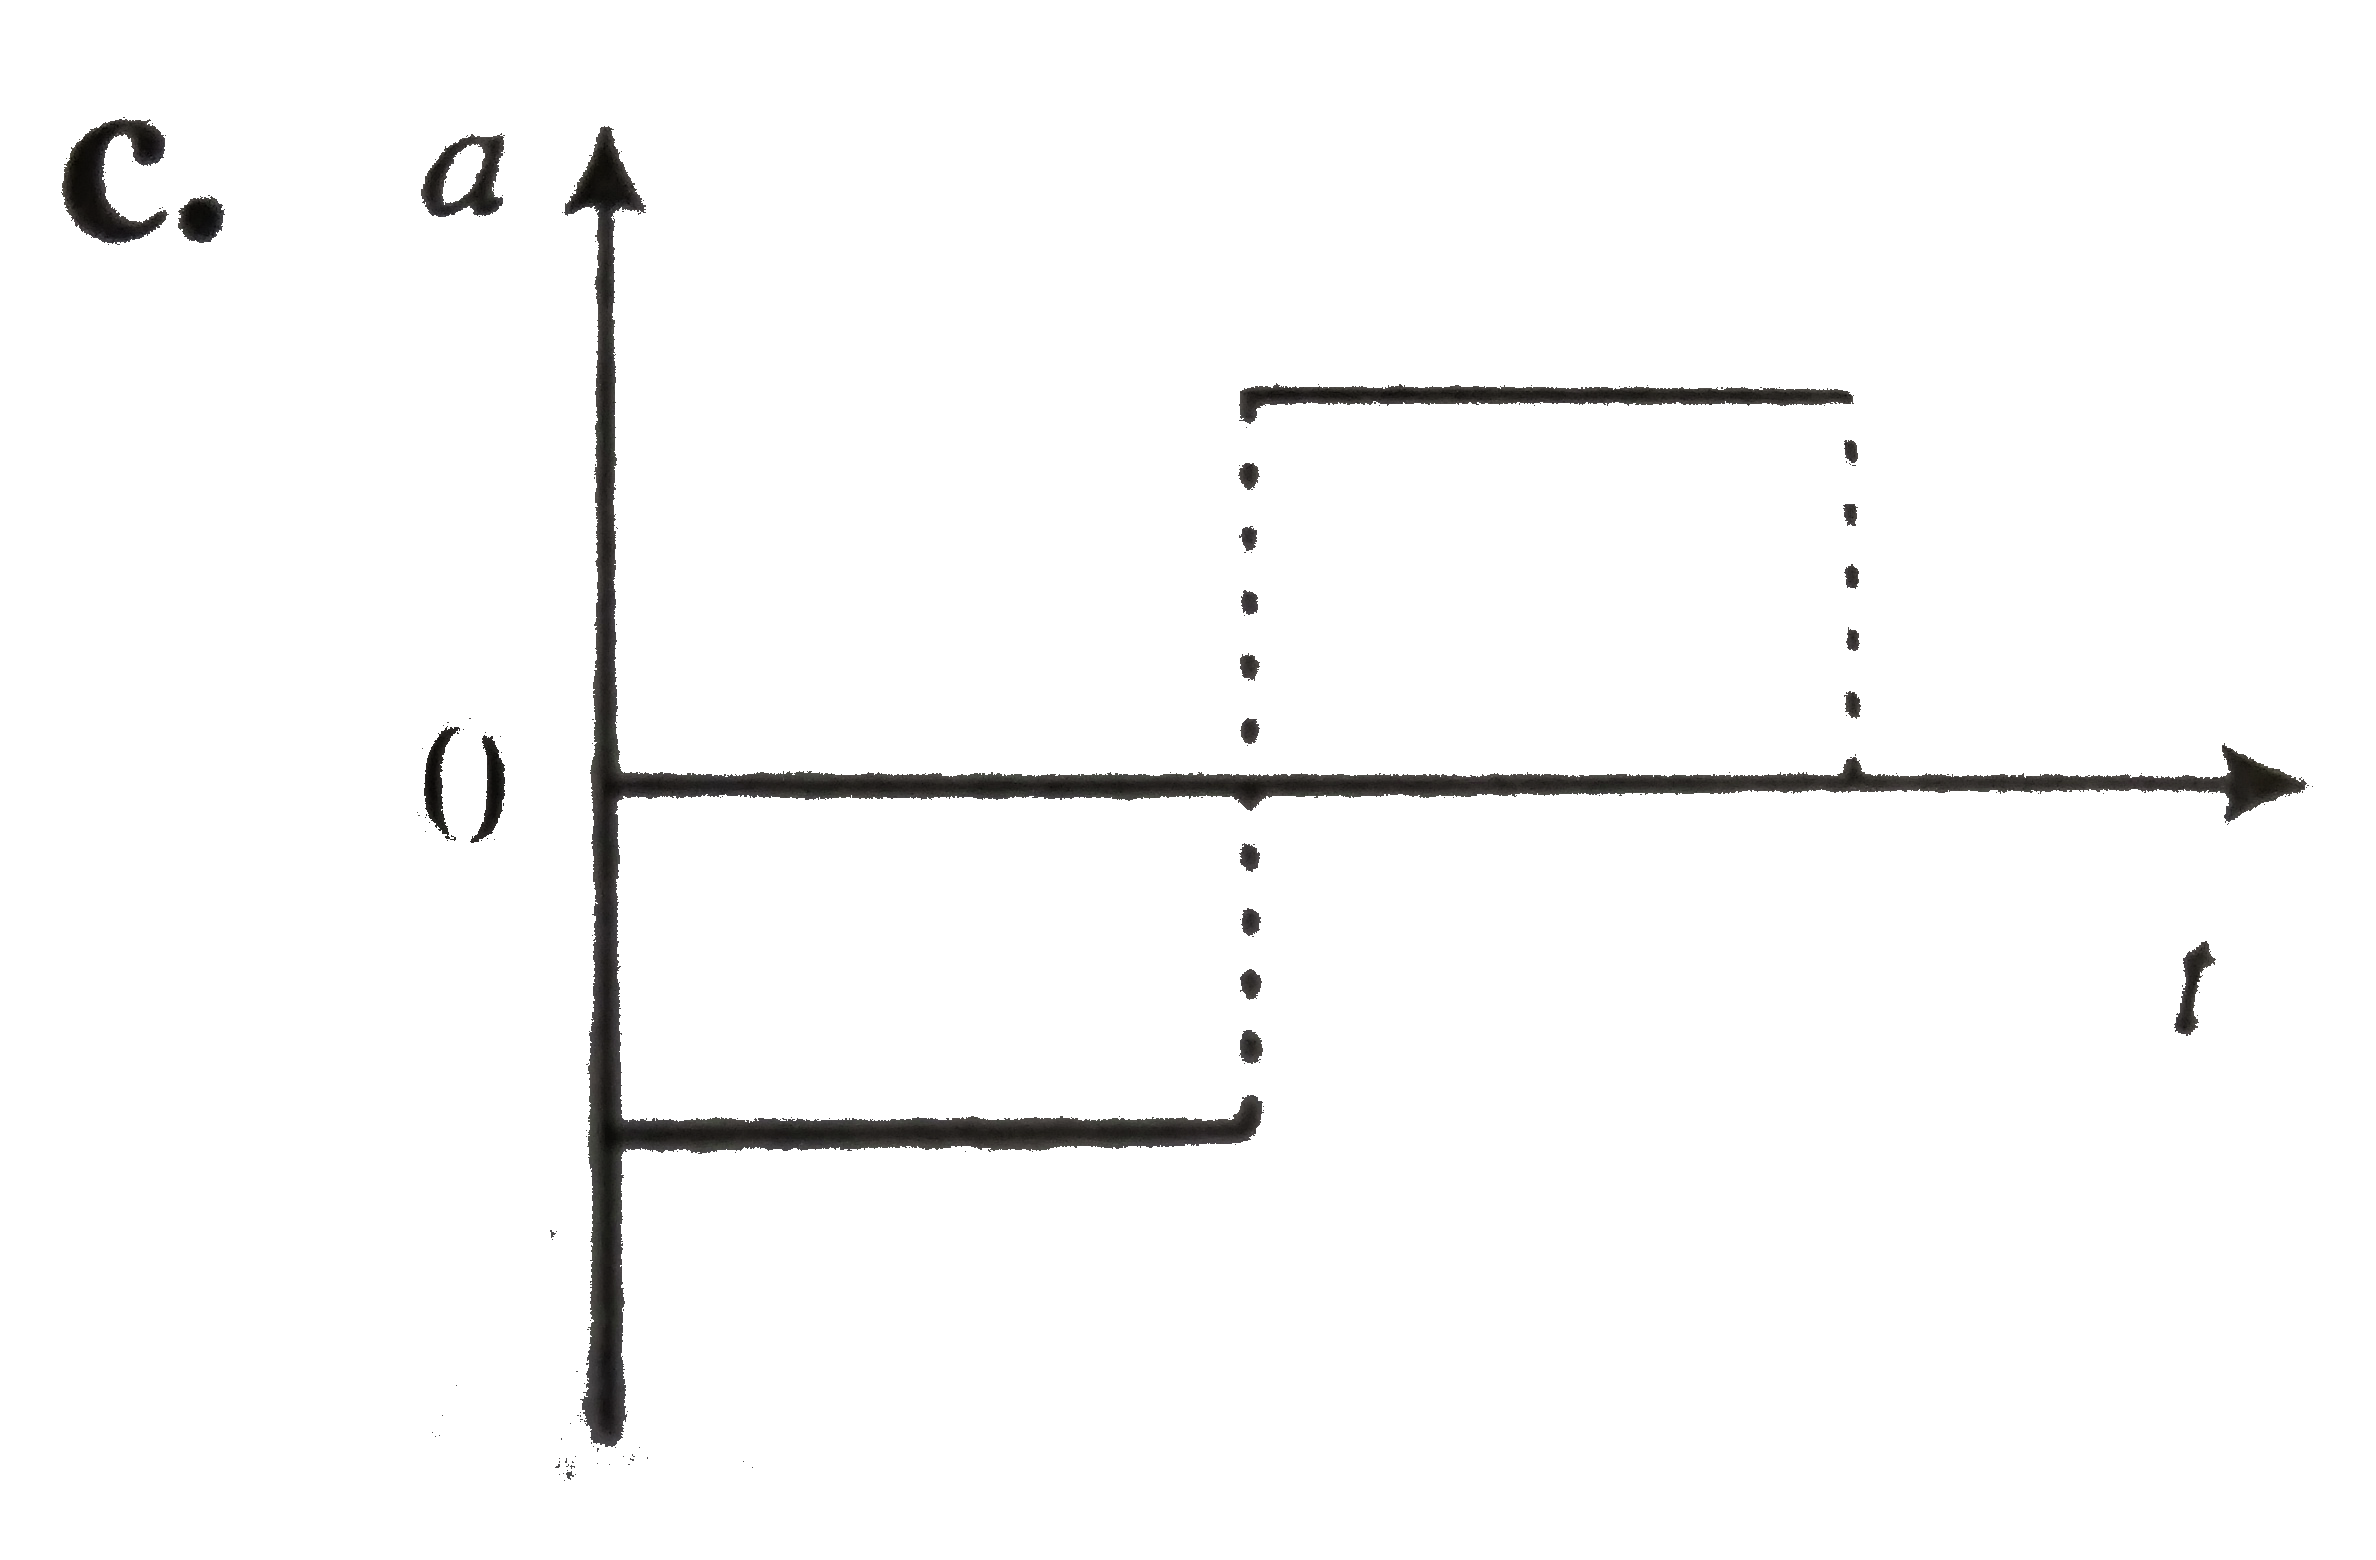 D
D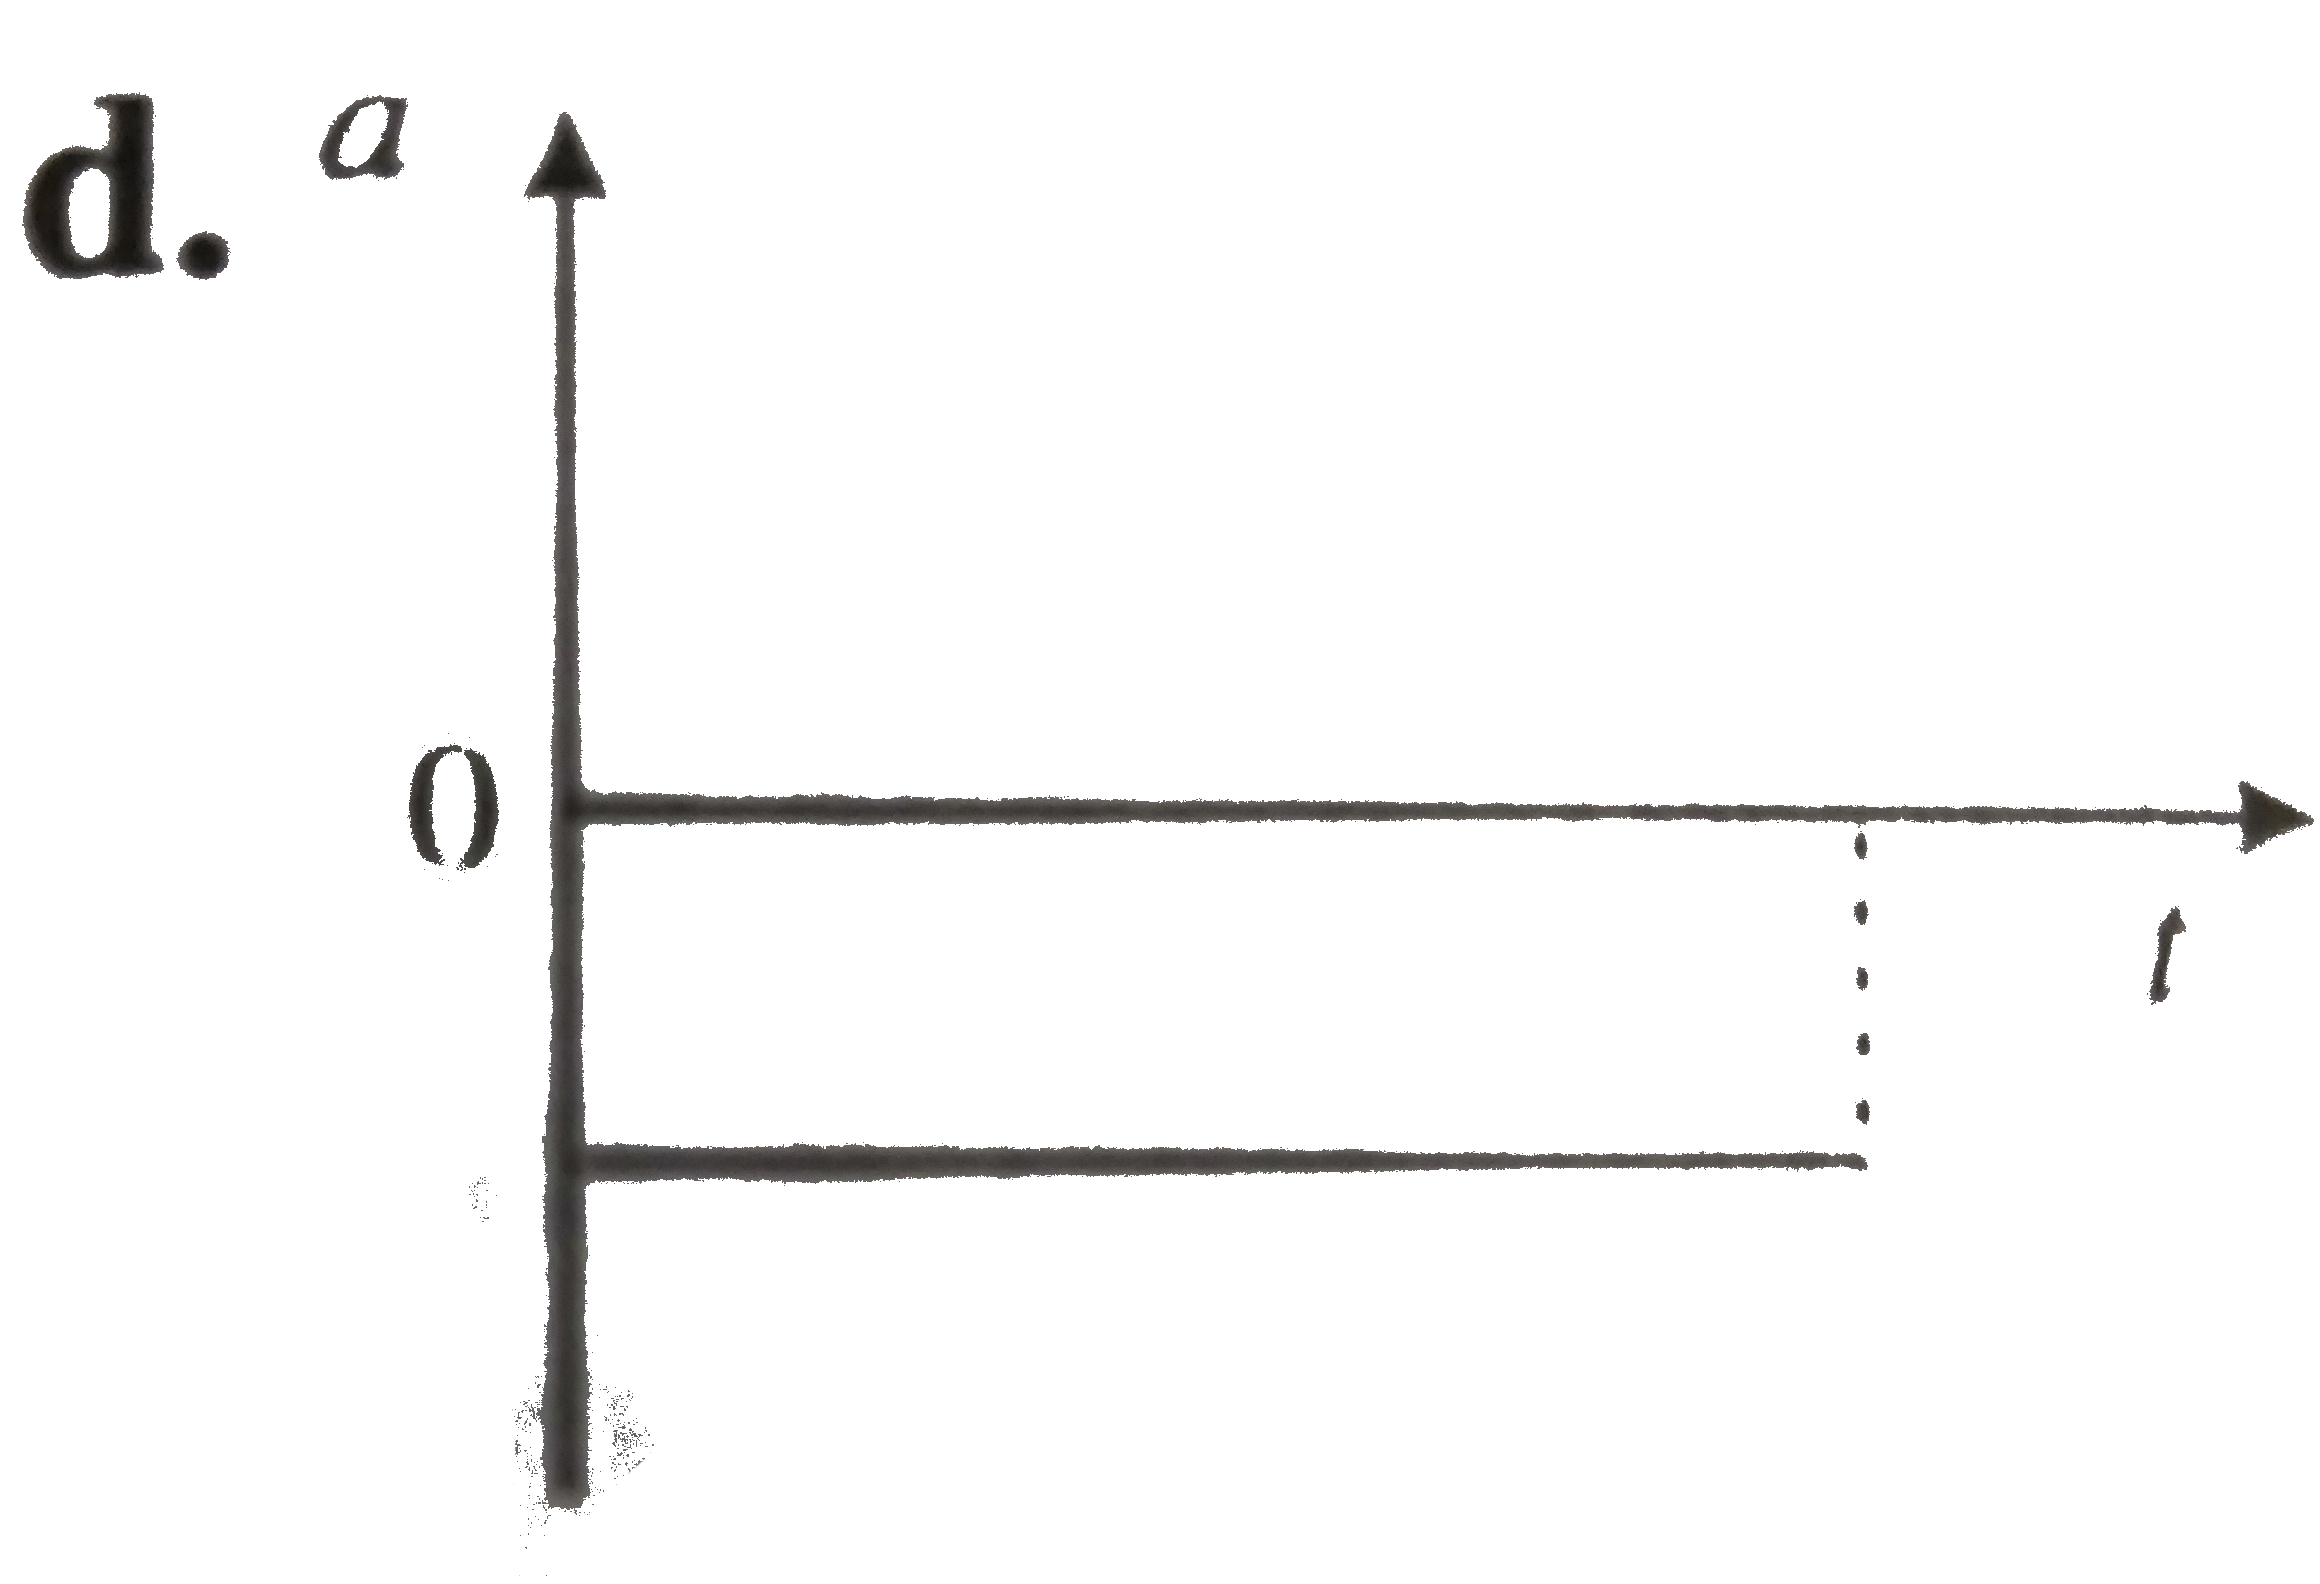
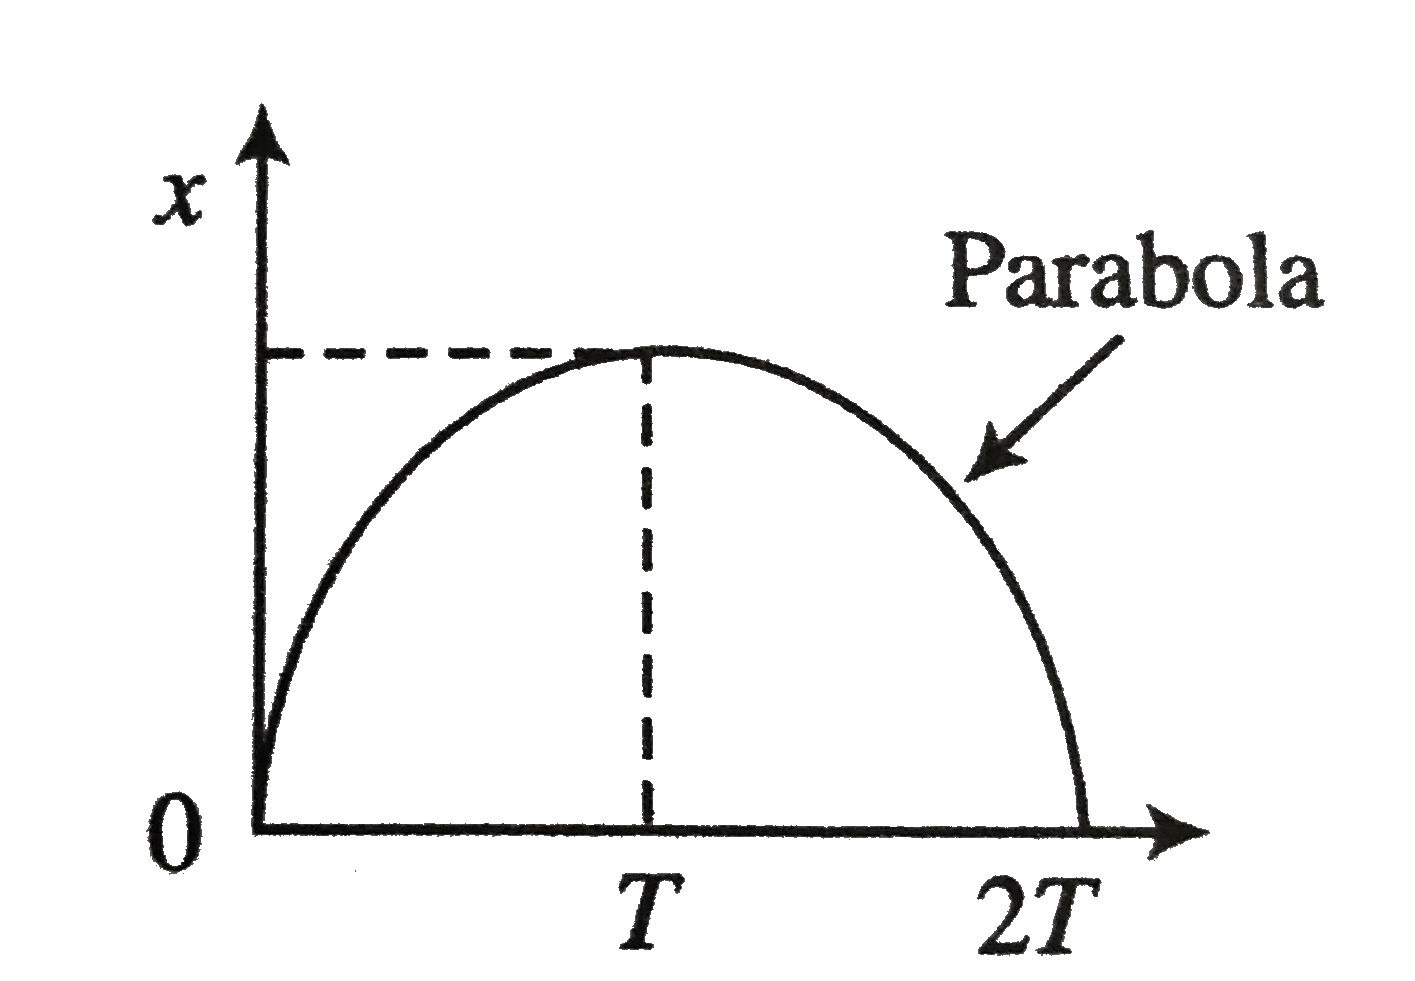
The x−t graph of particle moving along a straight line is shown in figure
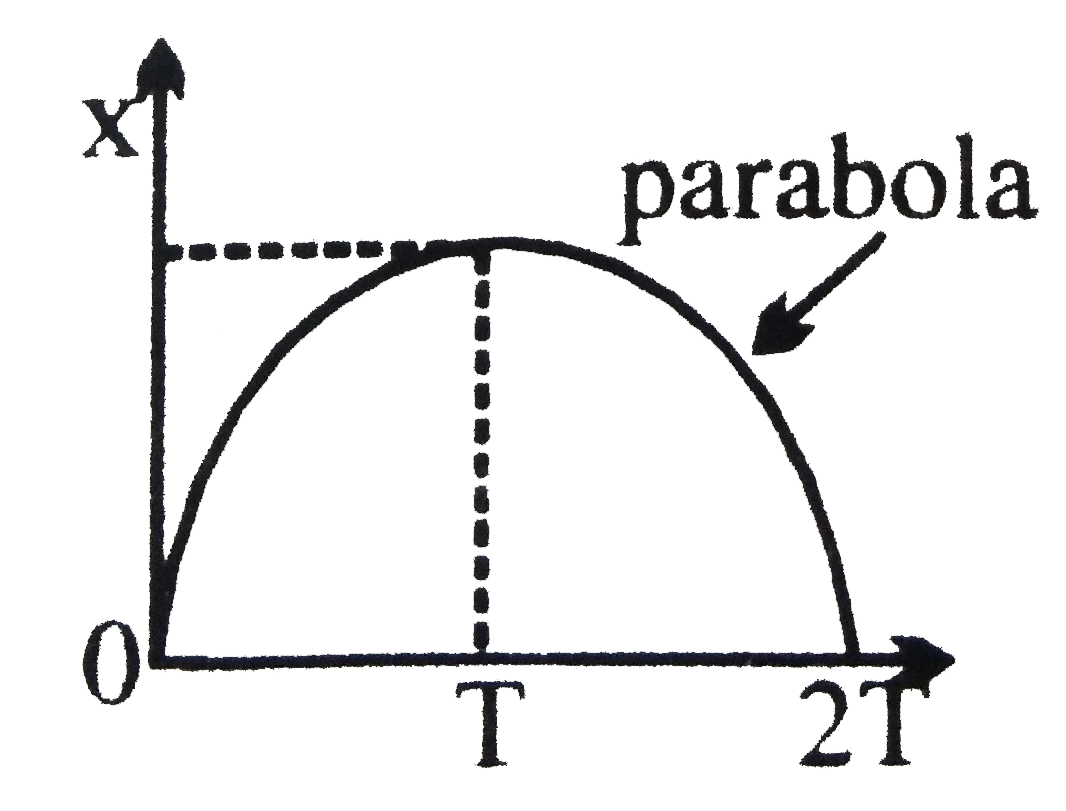
The a−t graph of the particle is correctly shown byA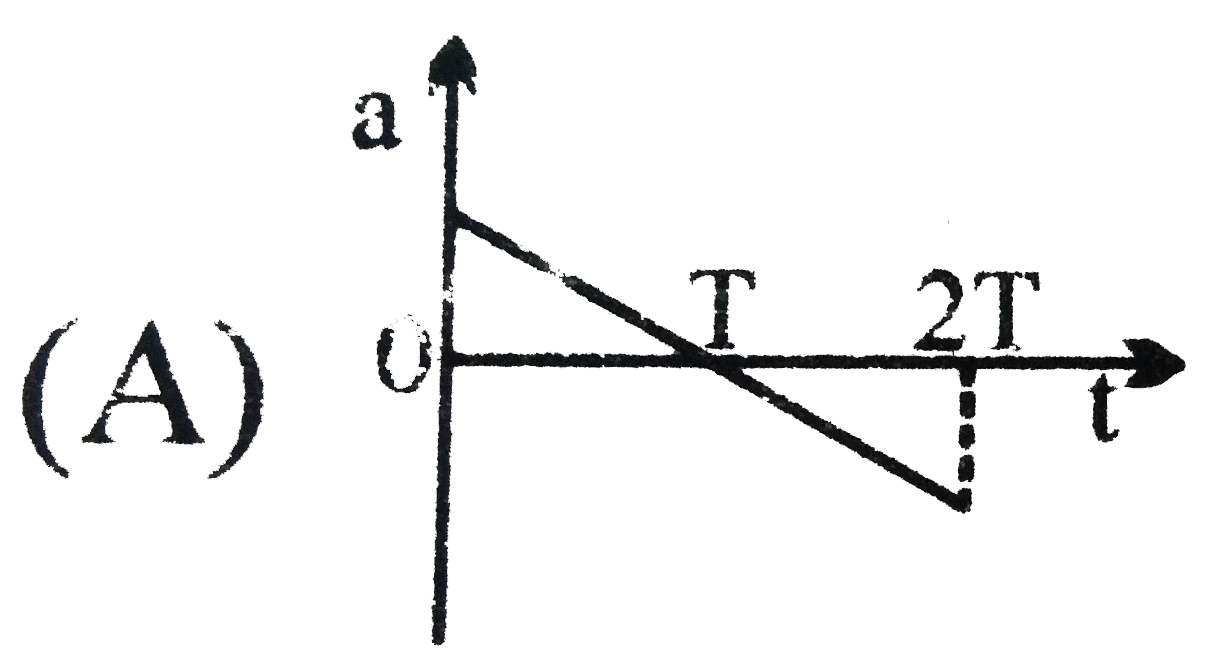 B
B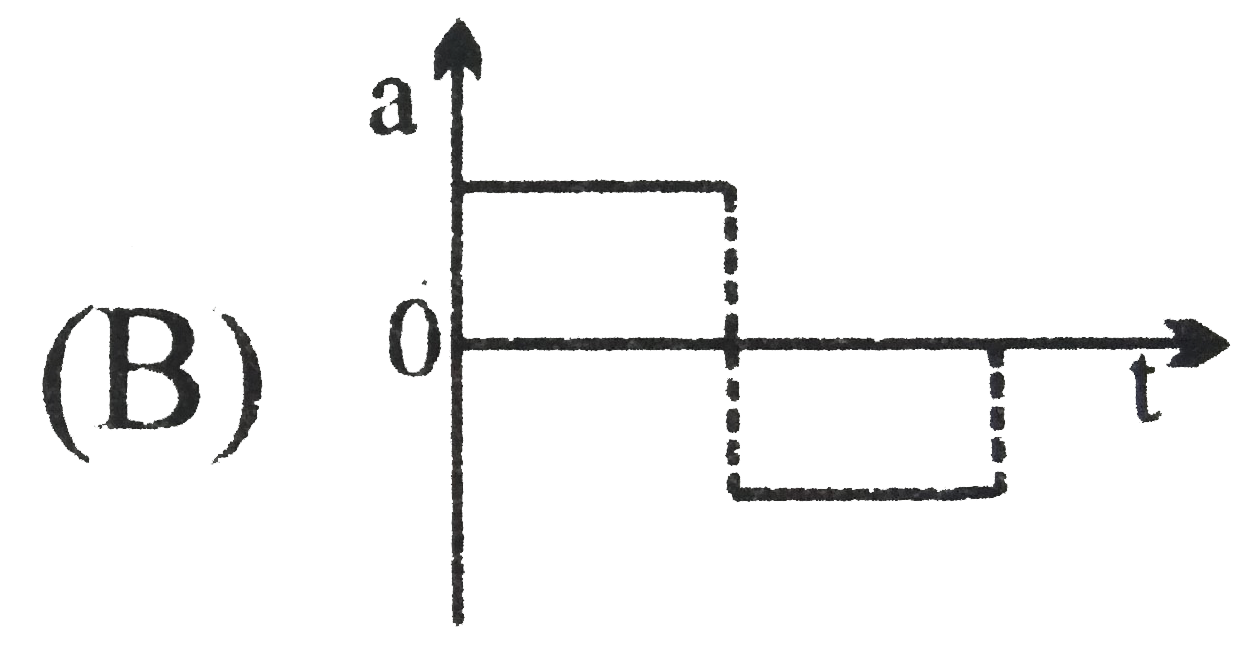 C
C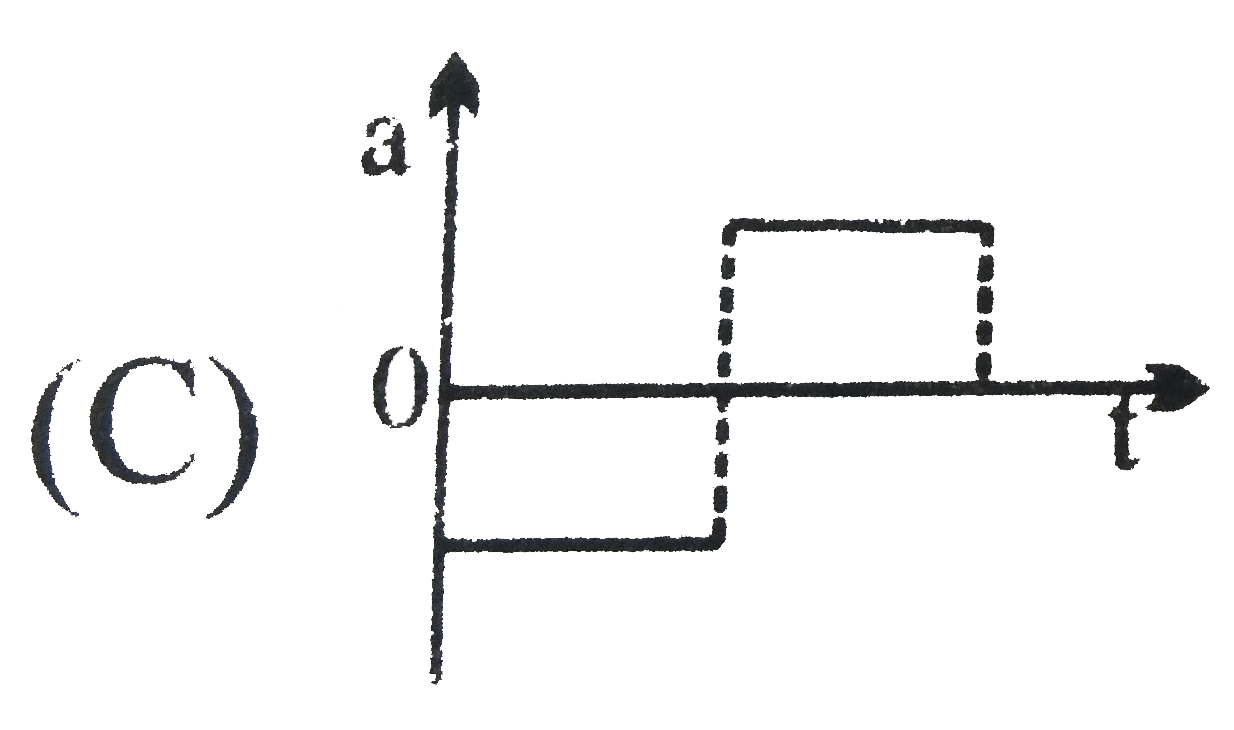 D
D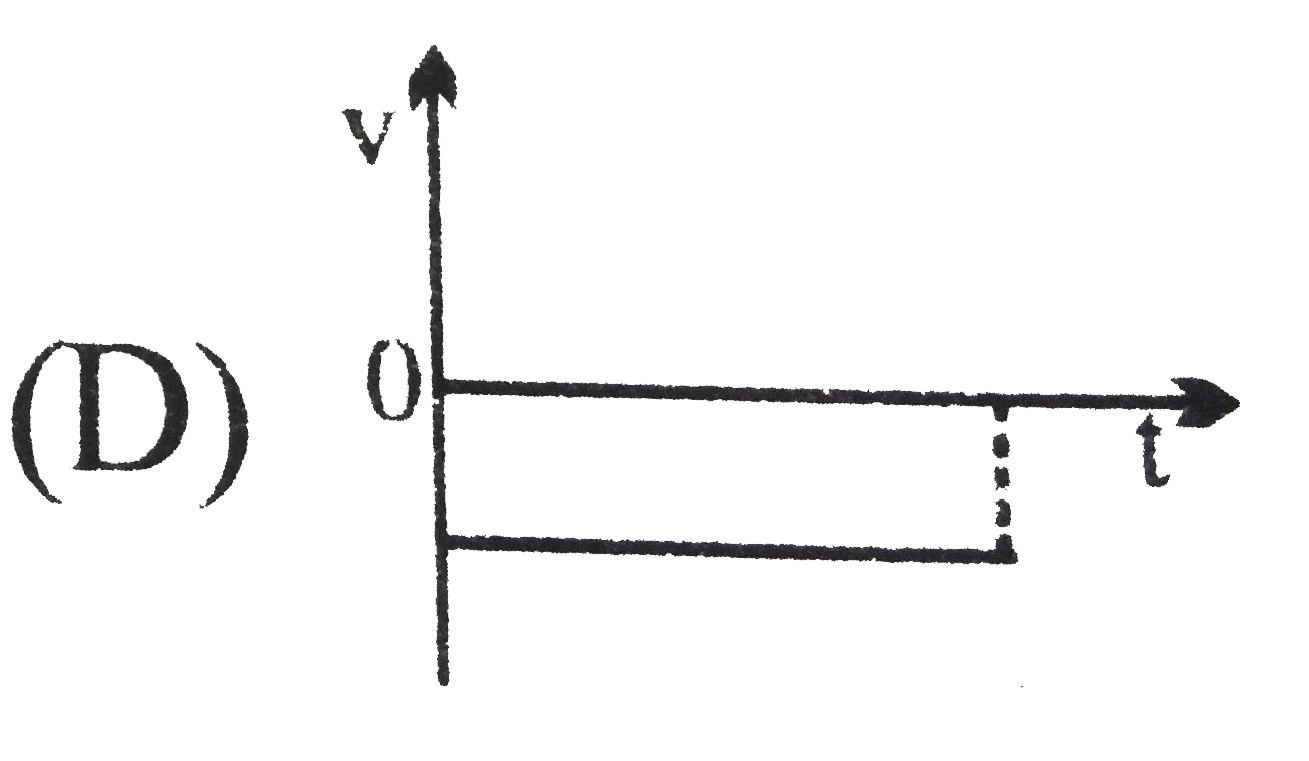
A particle is moving in a straight line under constant acceleration alpha. If the intial velocity is v0, sketch the v-t and s-t graphs. (v0>0).
View SolutionThe x-t graph of a particle moving along a straight line is shown in figure

The v-t graph of the particle is correctly shown by
View SolutionThe x−t graph of particle moving along a straight line is shown in figure
The v−t graph of the particles is correctly shown by
View SolutionThe x-t graph of a particle moving along a straight line is shown in figure
The speed-time graph of the particle is correctly shown by
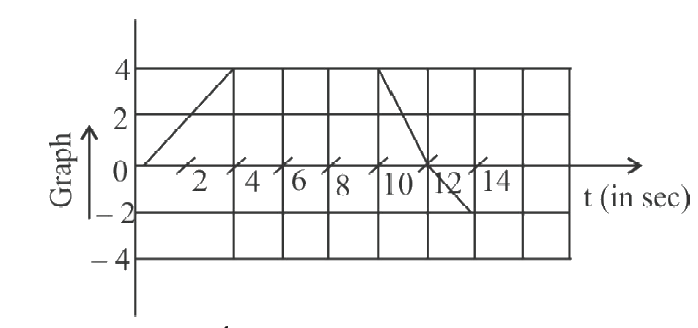
View SolutionA graph of acceleration versus time of a particle starting from rest at t=0 is as shown in figure. The speed of the particle at t=14s is
View Solution

