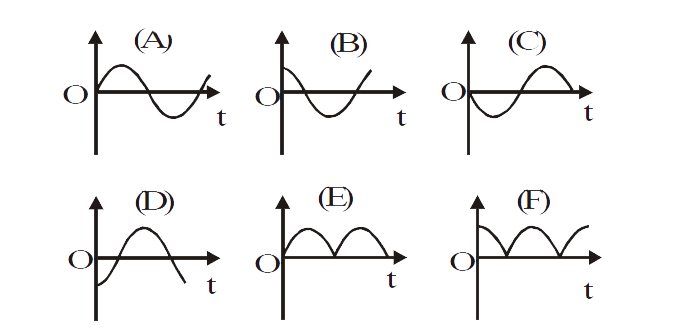
The oscillation of a body on a smooth horizontal surface is represented by the equation,
where X = displacement at time t
= frequency of oscillation
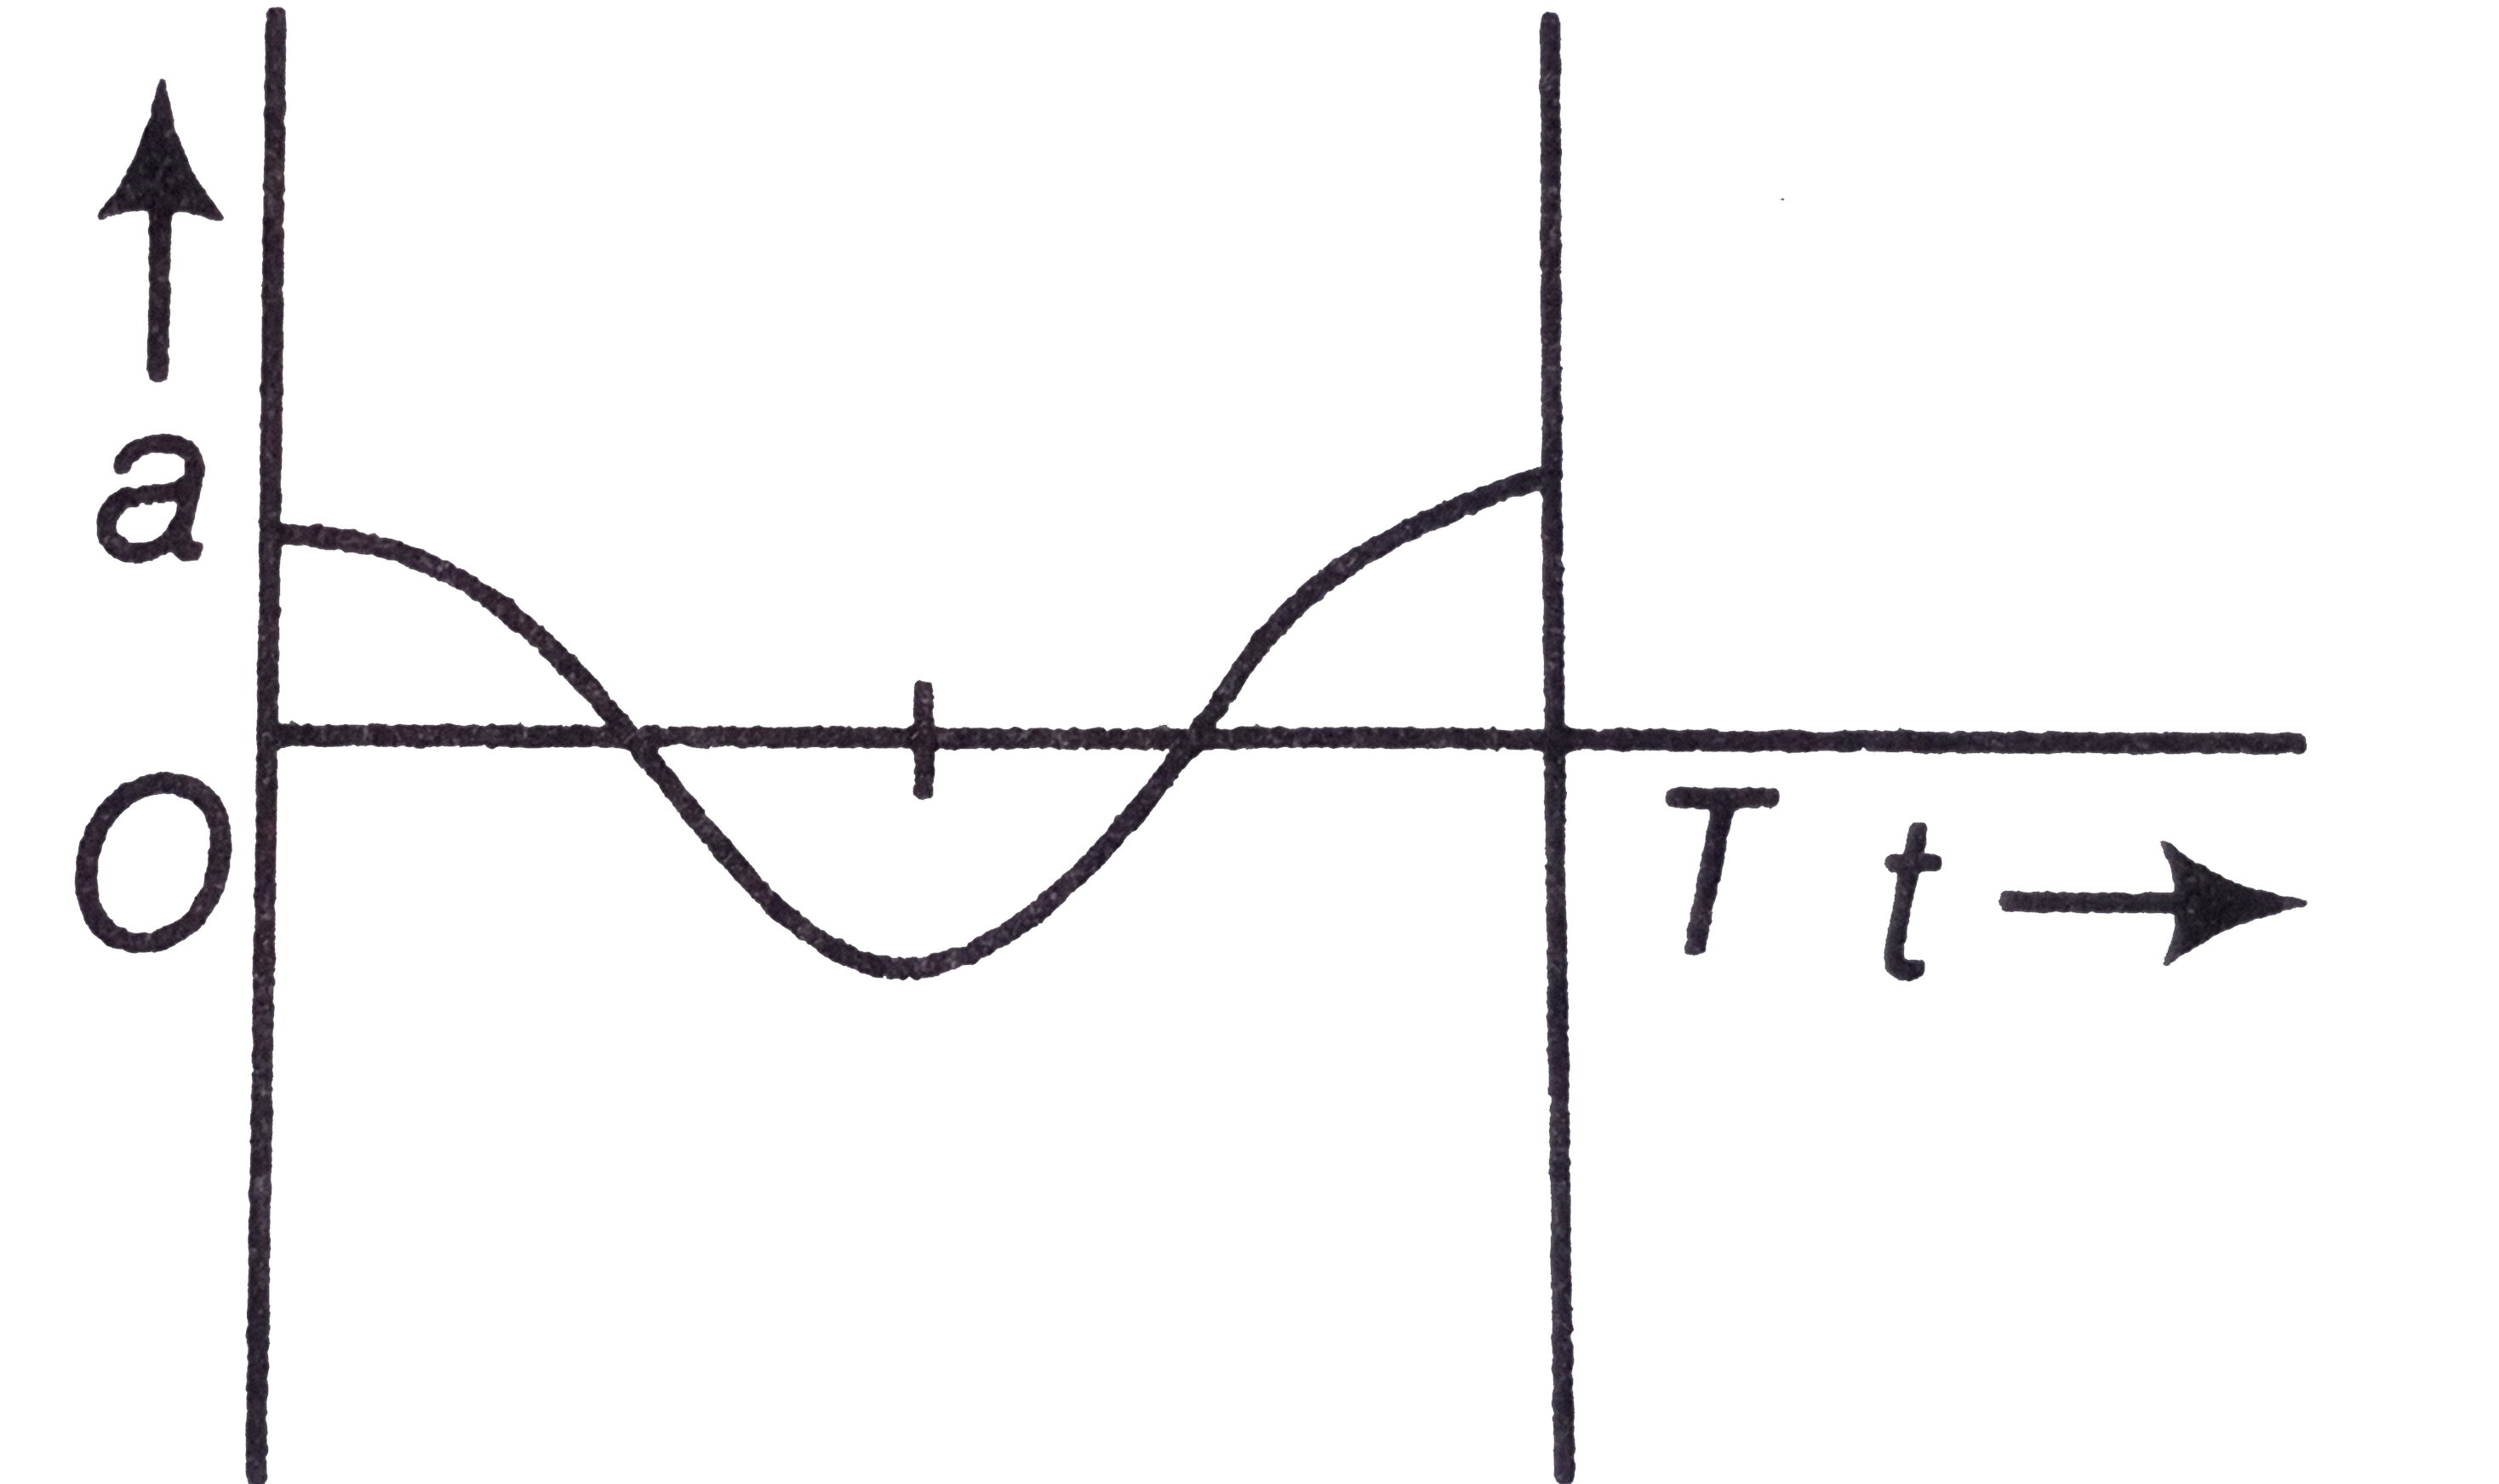
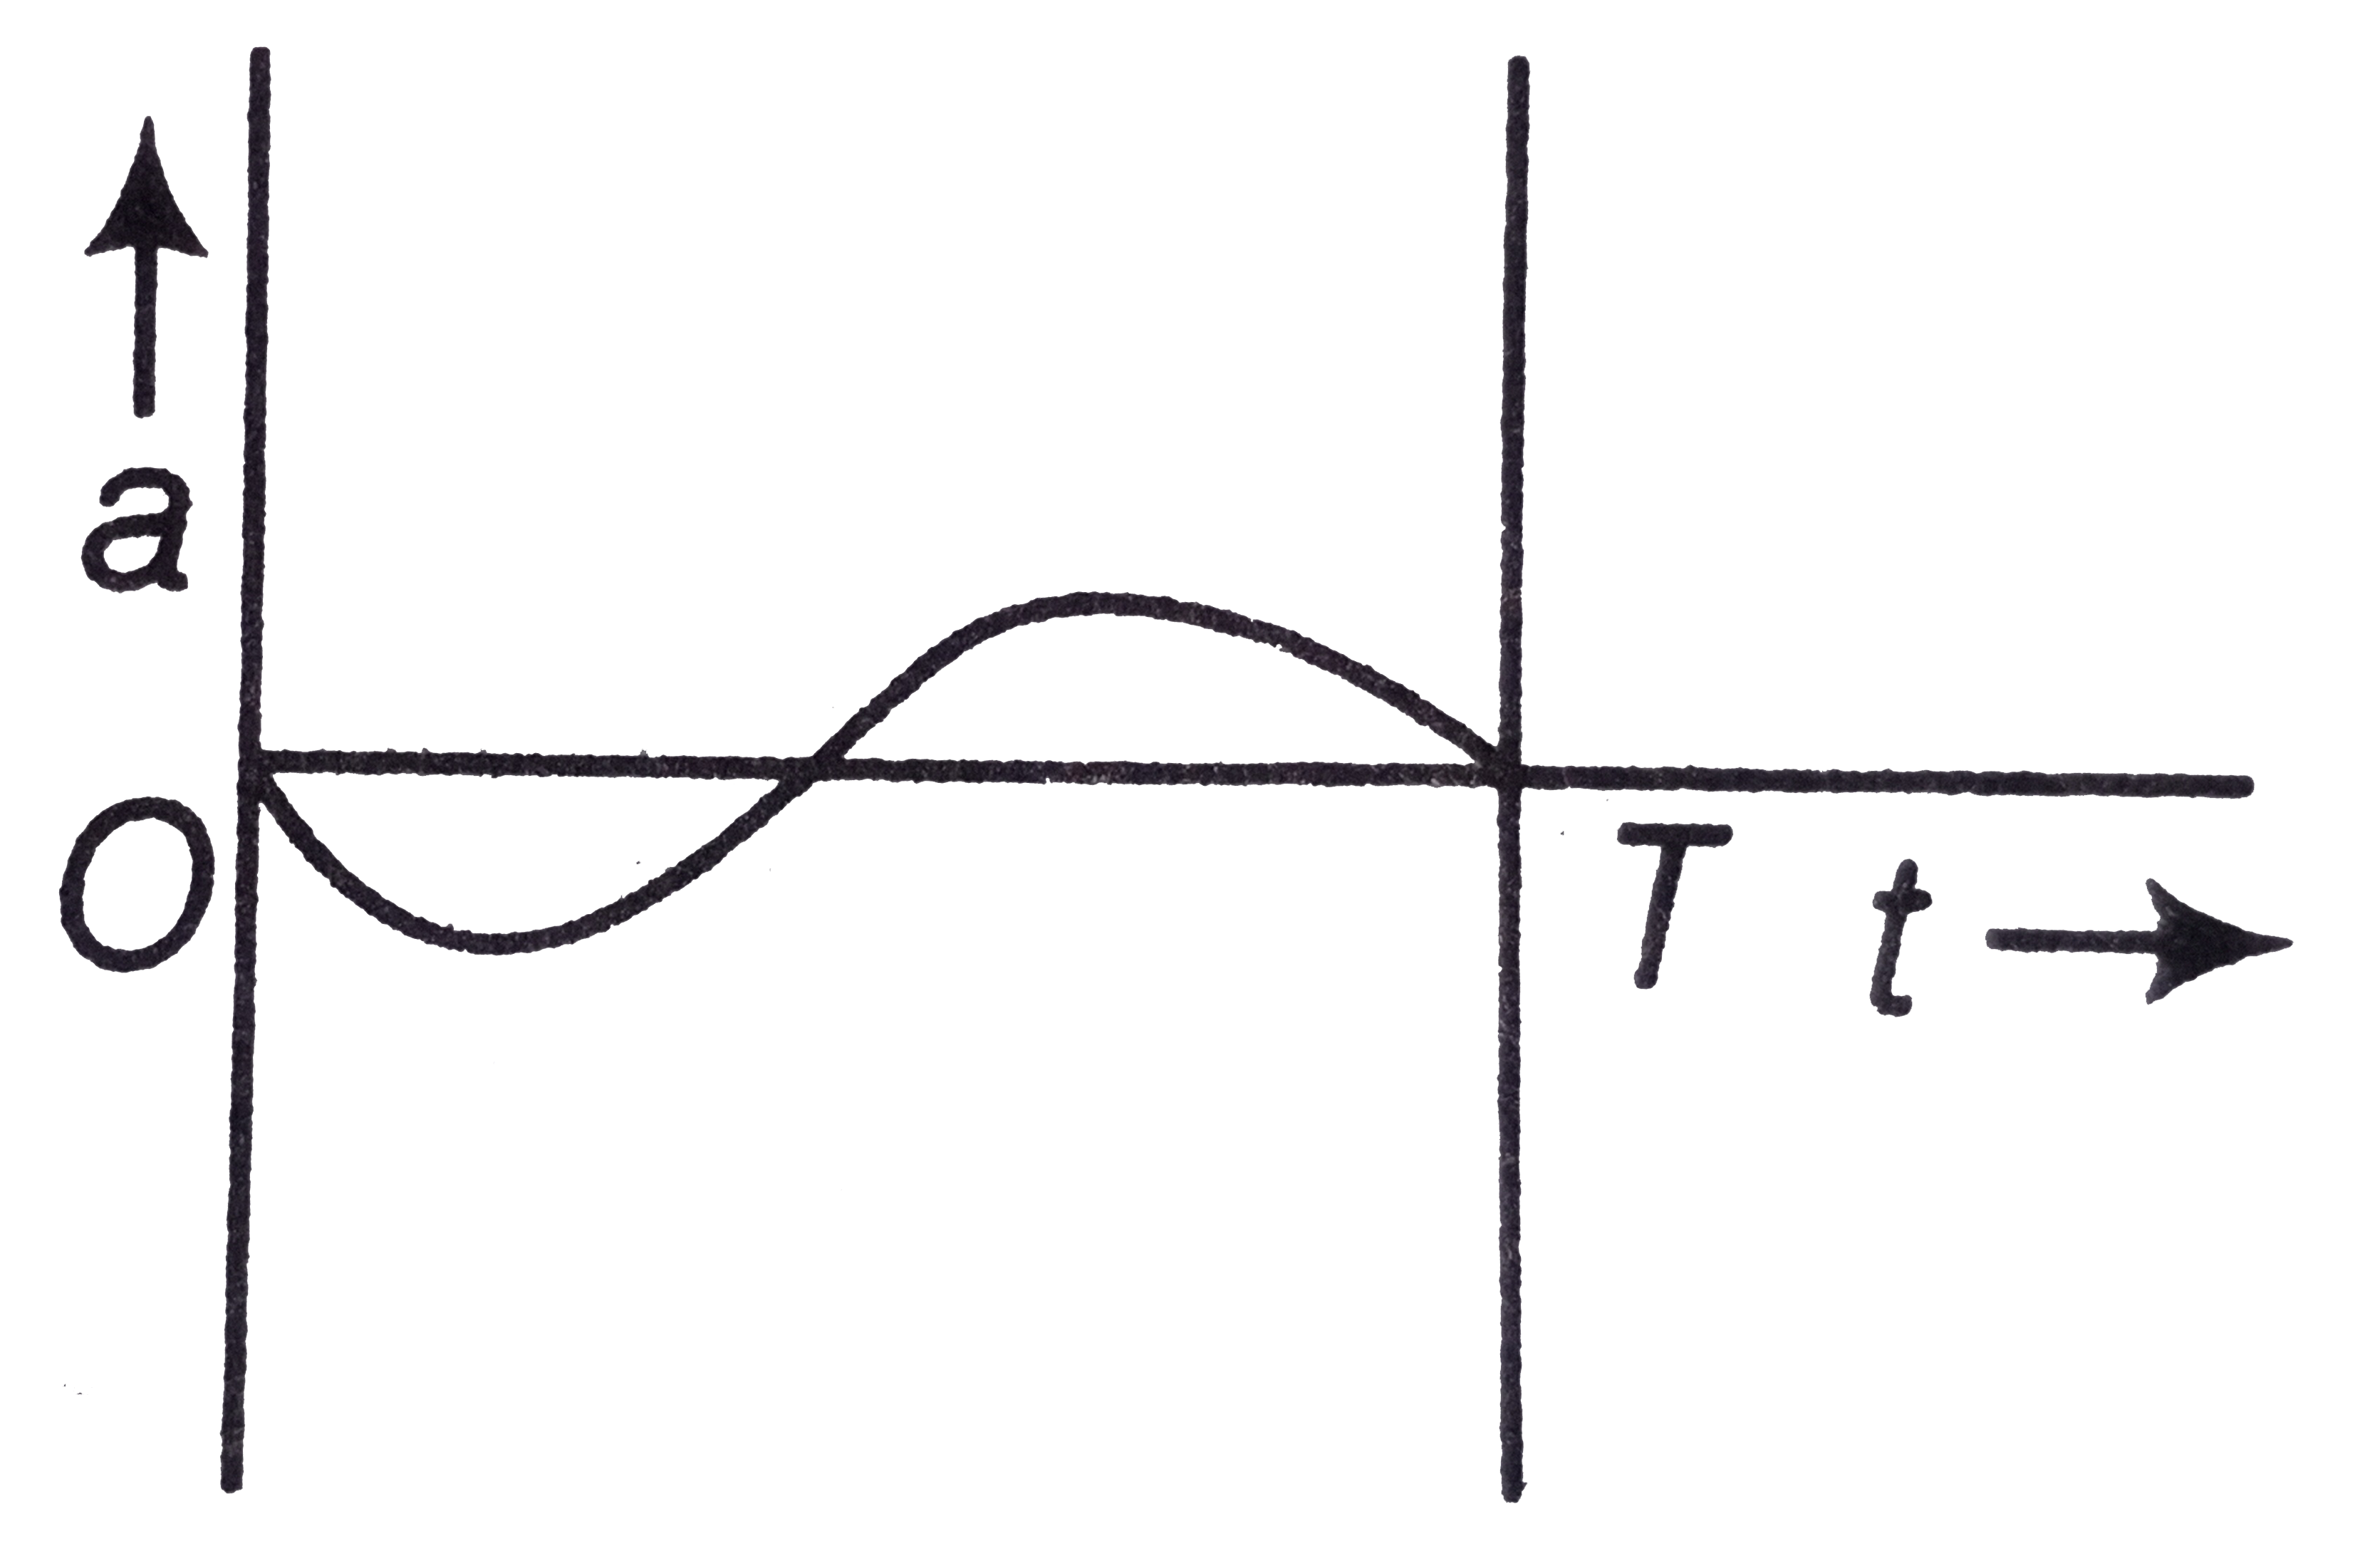
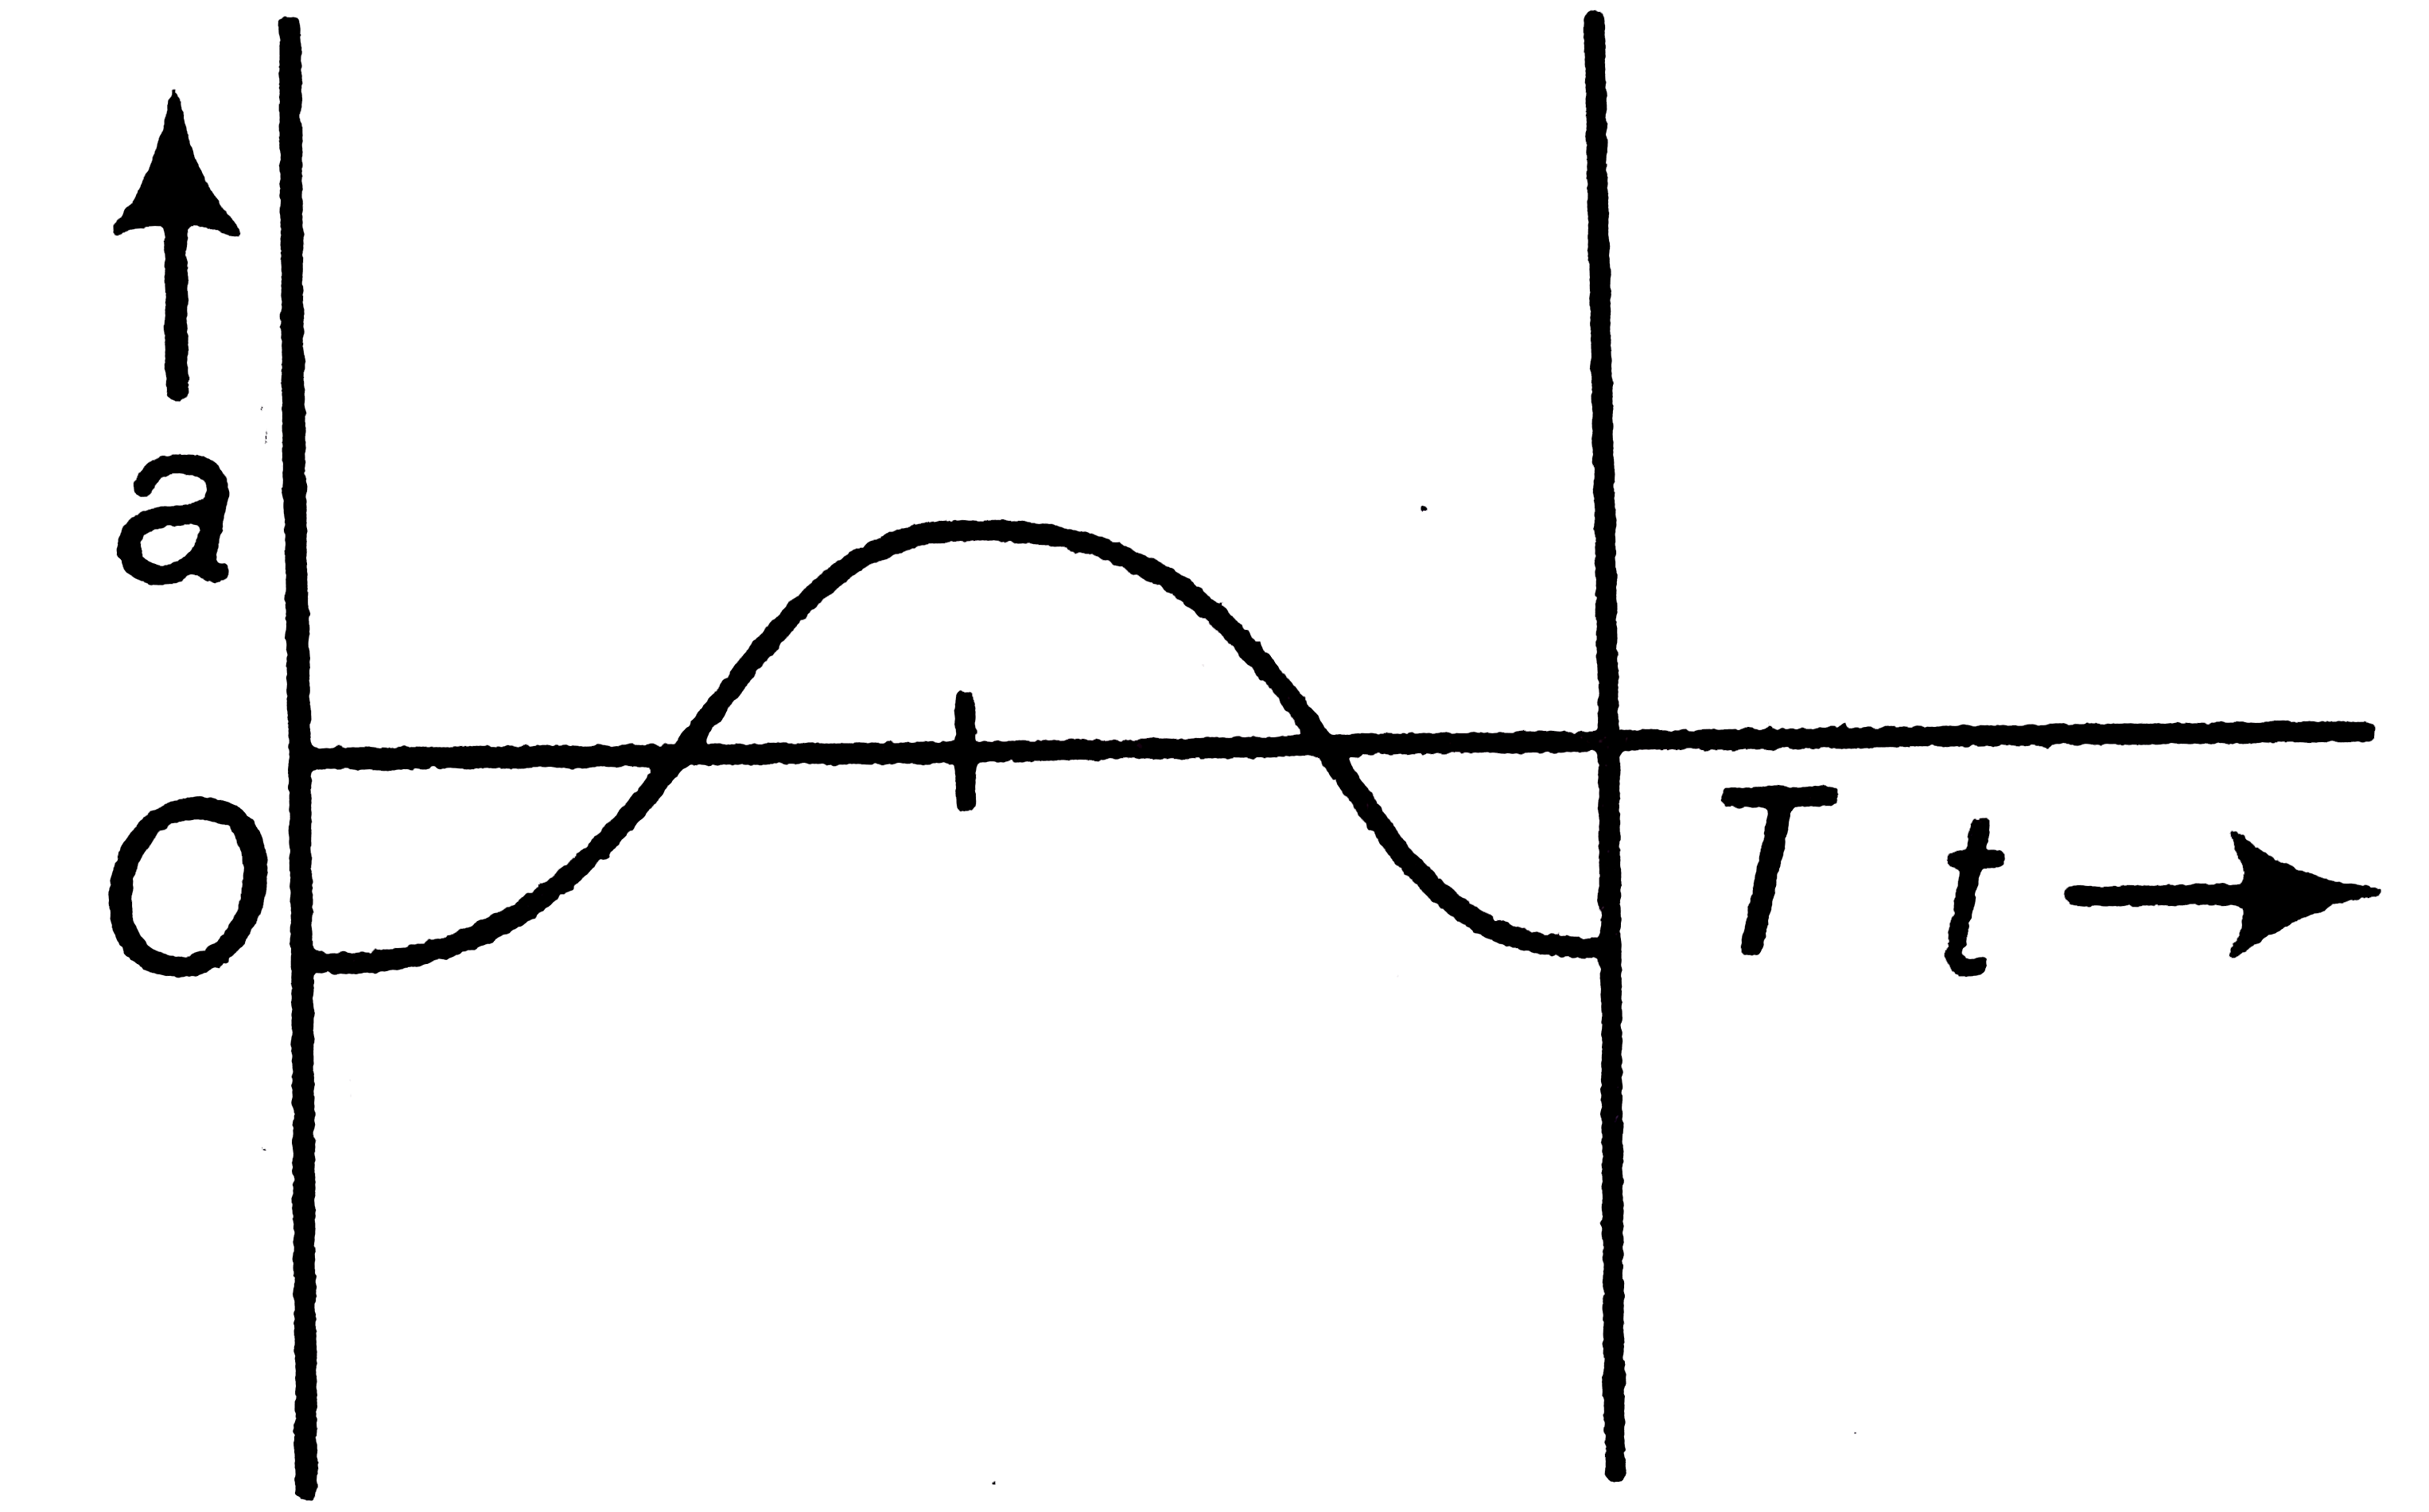
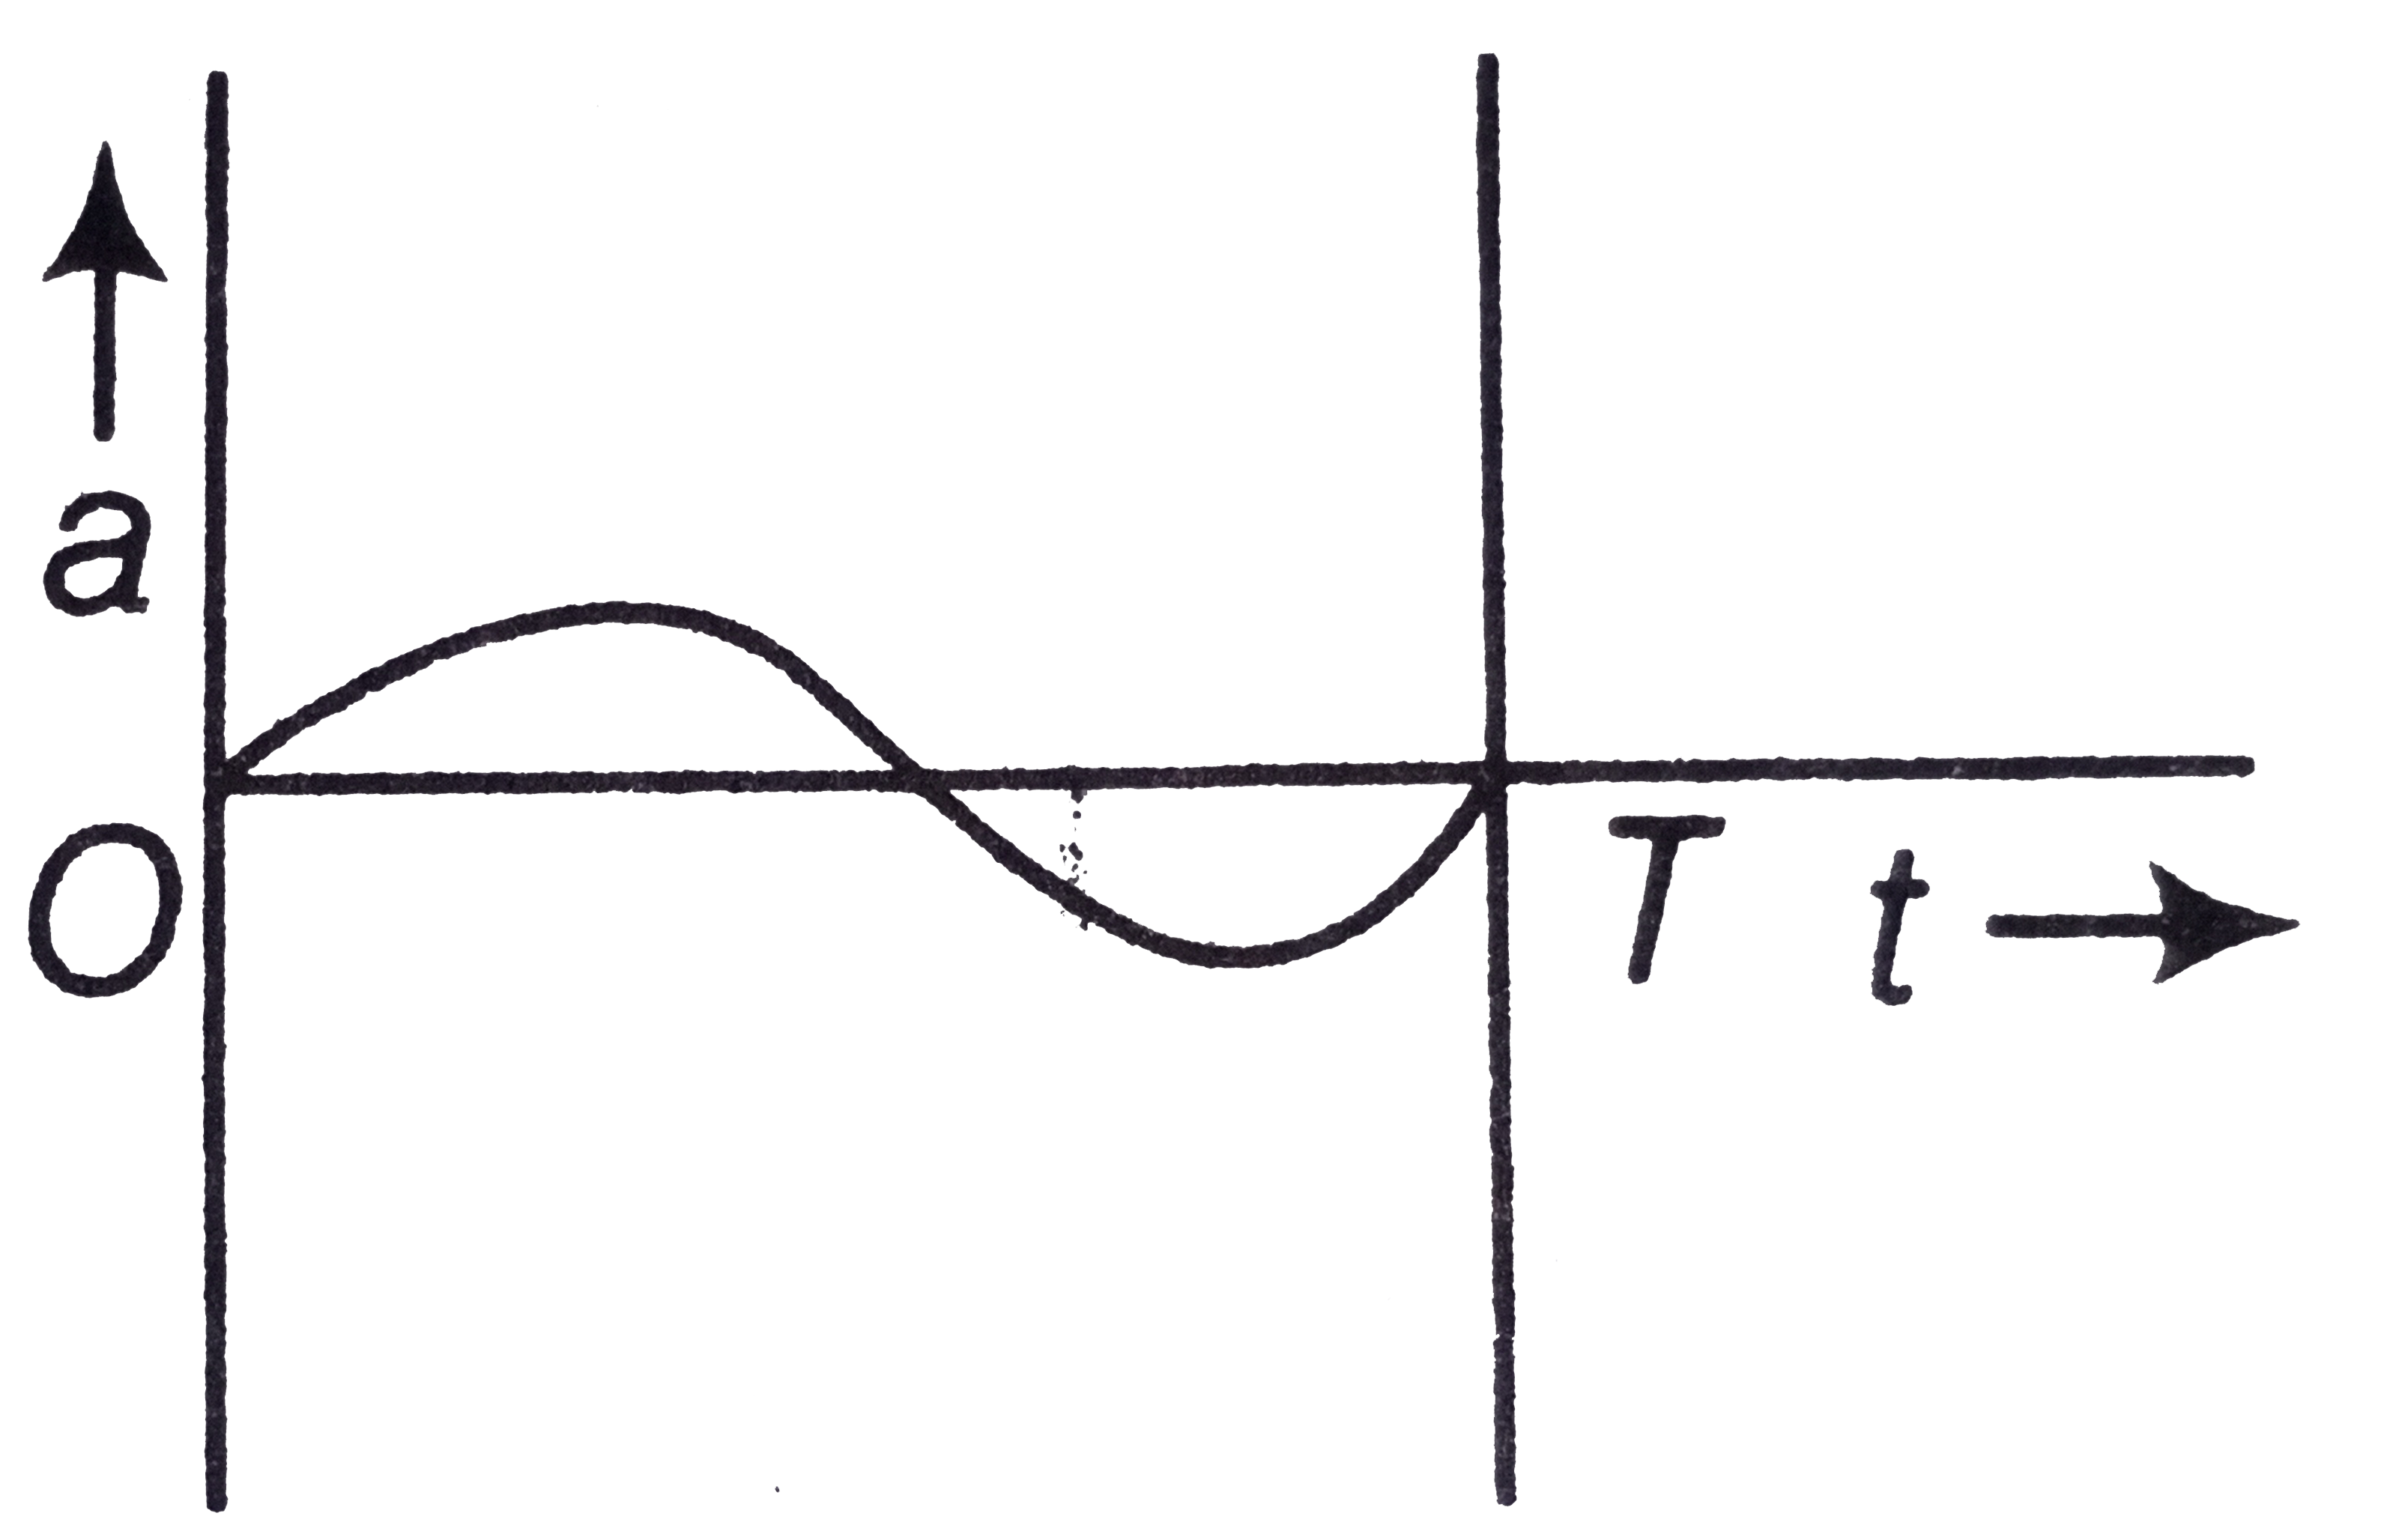
Which one of the following graphs shows correctly the variation a with t ?
The correct Answer is:A
We can find the correct graph by putting different values of t in the given expression,
and
Again
We can see that, only graph (i) will satisfy the above results

Topper's Solved these Questions
- OSCILLATIONSBook:MHTCET PREVIOUS YEAR PAPERS AND PRACTICE PAPERSChapter:OSCILLATIONSExercise:MHT CET CORNER
Explore 29 Videos
- OSCILLATIONSBook:MHTCET PREVIOUS YEAR PAPERS AND PRACTICE PAPERSChapter:OSCILLATIONSExercise:EXERCISE 1
Explore 67 Videos
- MOCK TEST 5Book:MHTCET PREVIOUS YEAR PAPERS AND PRACTICE PAPERSChapter:MOCK TEST 5Exercise:MCQs
Explore 42 Videos
- PRACTICE SET 01Book:MHTCET PREVIOUS YEAR PAPERS AND PRACTICE PAPERSChapter:PRACTICE SET 01Exercise:PAPER 1 (PHYSICS & CHEMISTRY)
Explore 50 Videos
Similar Questions
The oscillation of a body on a smooth horizental surface is respresented by the equation
X=Acos(ωt)
where one of the following graph shown correctly the variation a with t?
View SolutionThe graph shown the variation with times t of the velocity v of an object . Which one of the following graphs best represents the variation of acceleration a of the object with time t?

View Solution
Knowledge Check
The oscillationof a body on a smooth horizontal surface is represented by the equation
x=Acosωt
where x= displacement at time t, ω= frequency of oscillation. Which one of the following graphs shows correctly the variation of acceleration a with time t ?A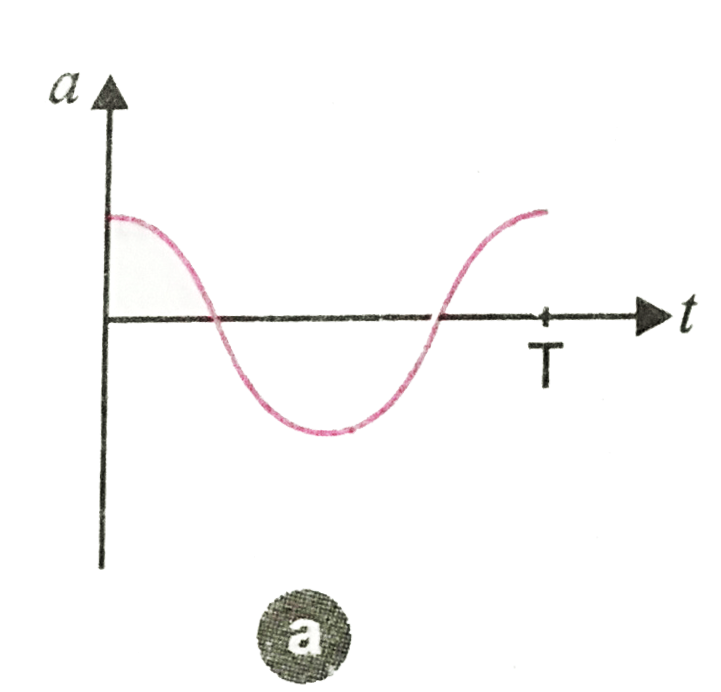 B
B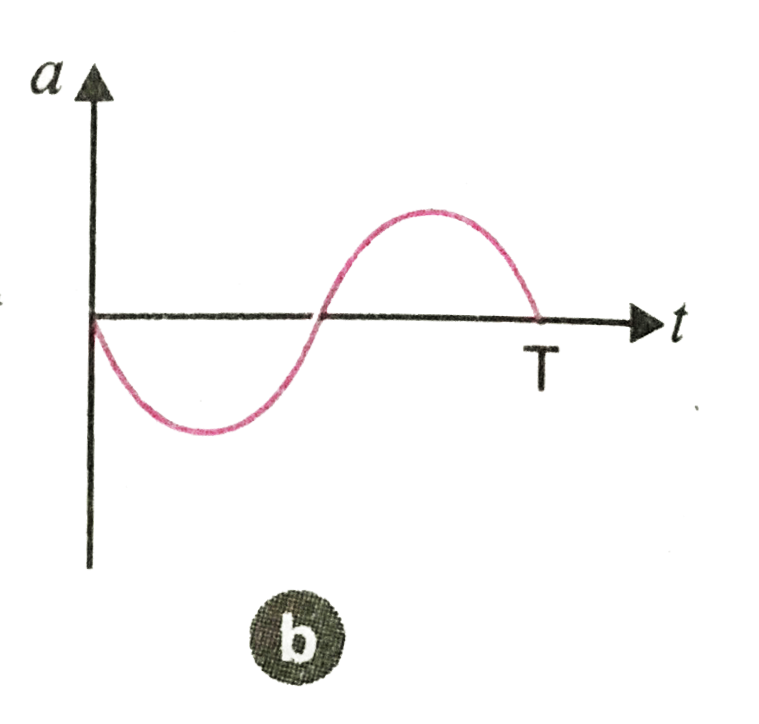 C
C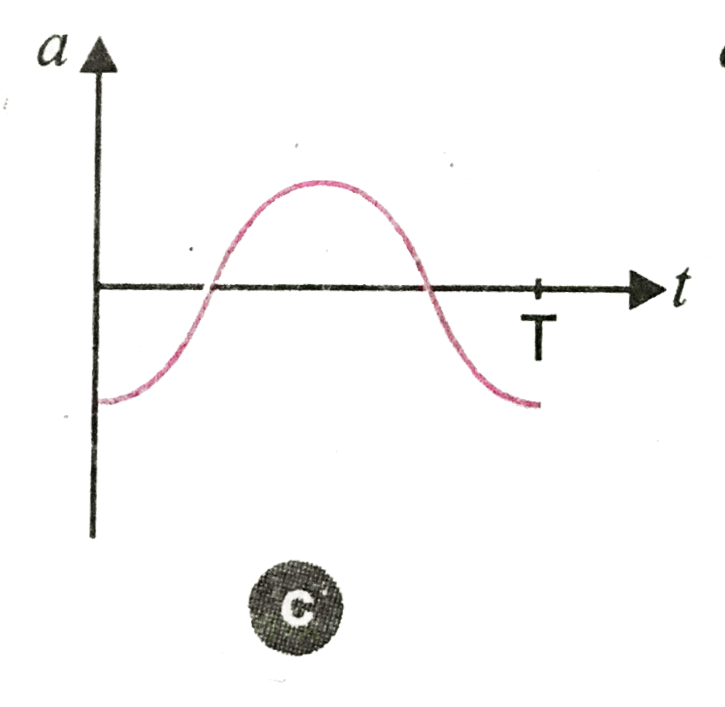 D
D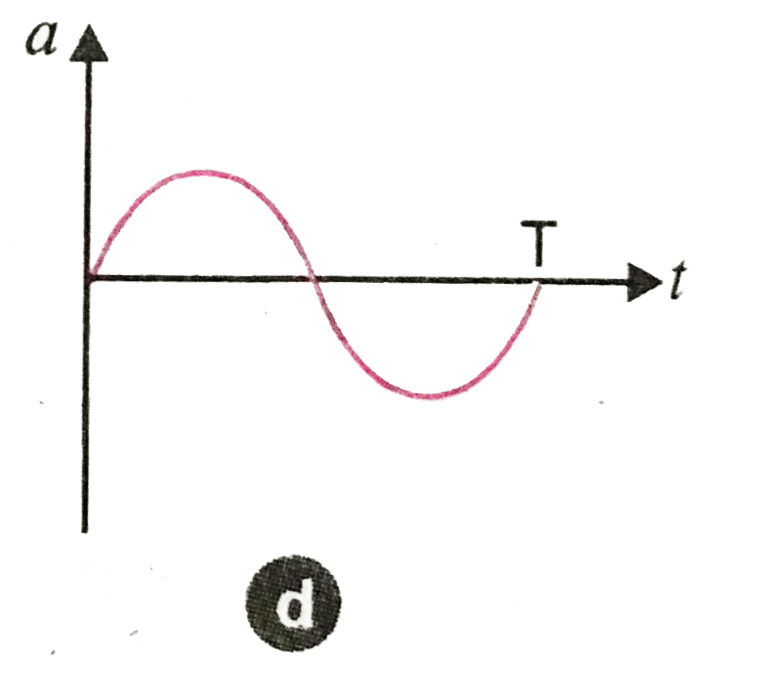
The oscillation of a body on a smooth horizontal surface is represented by the equation
X=Acos(ωt)
which one of the following graph shown correctly the variation a with t?A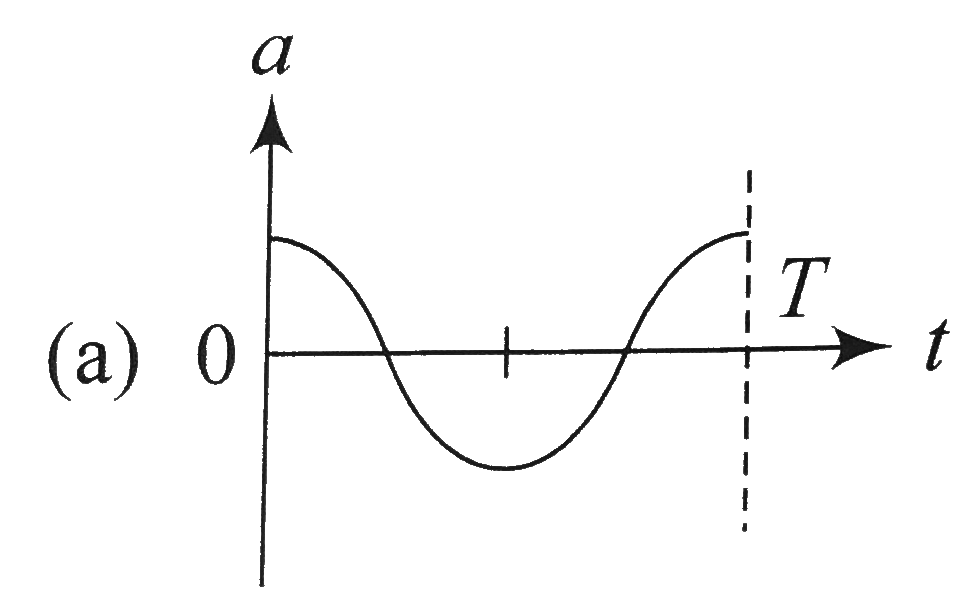 B
B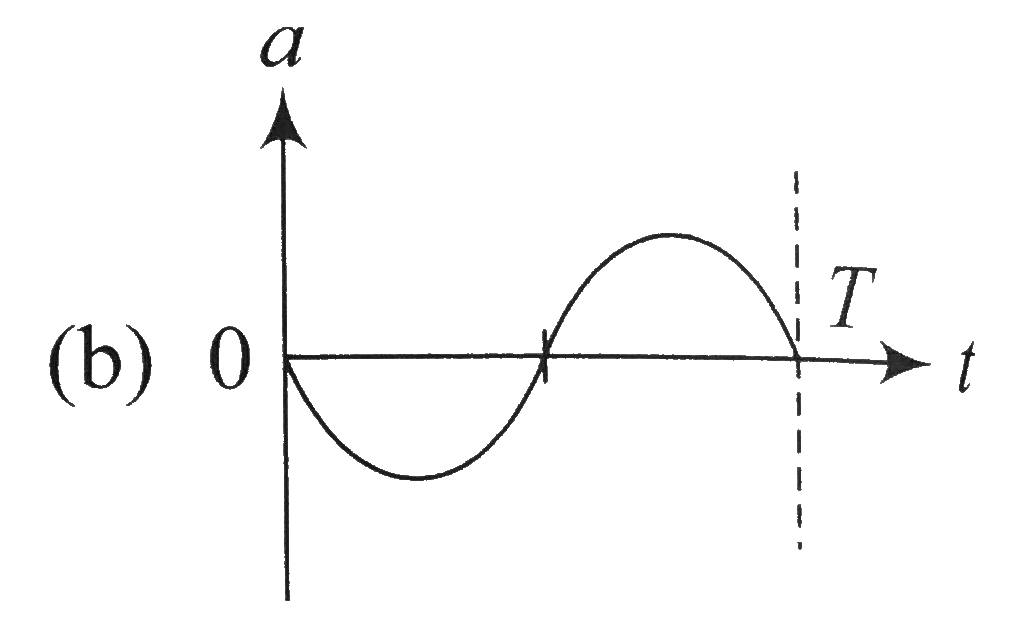 C
C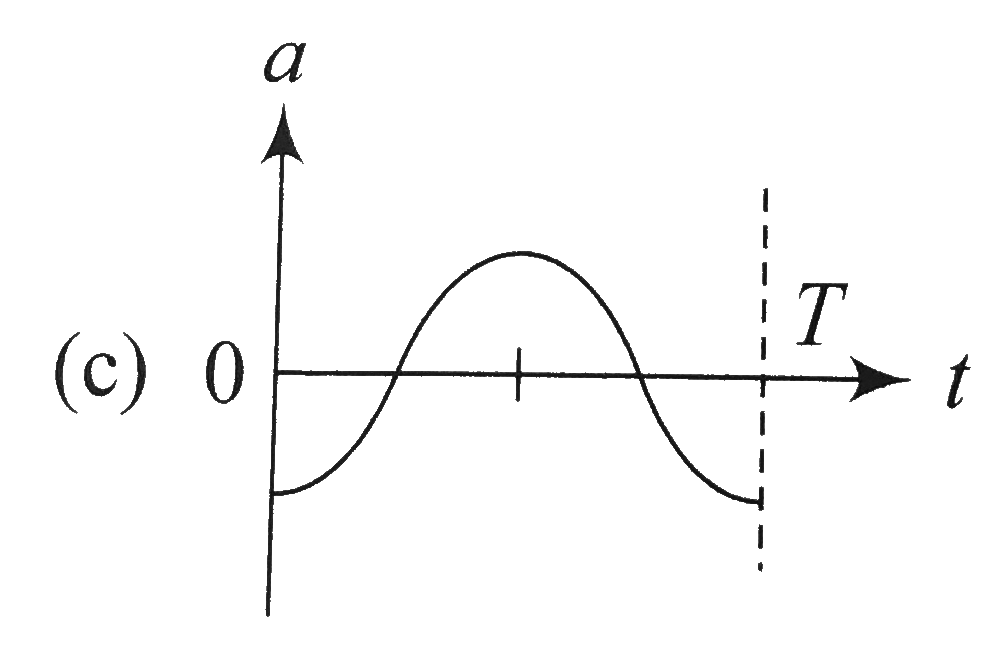 D
D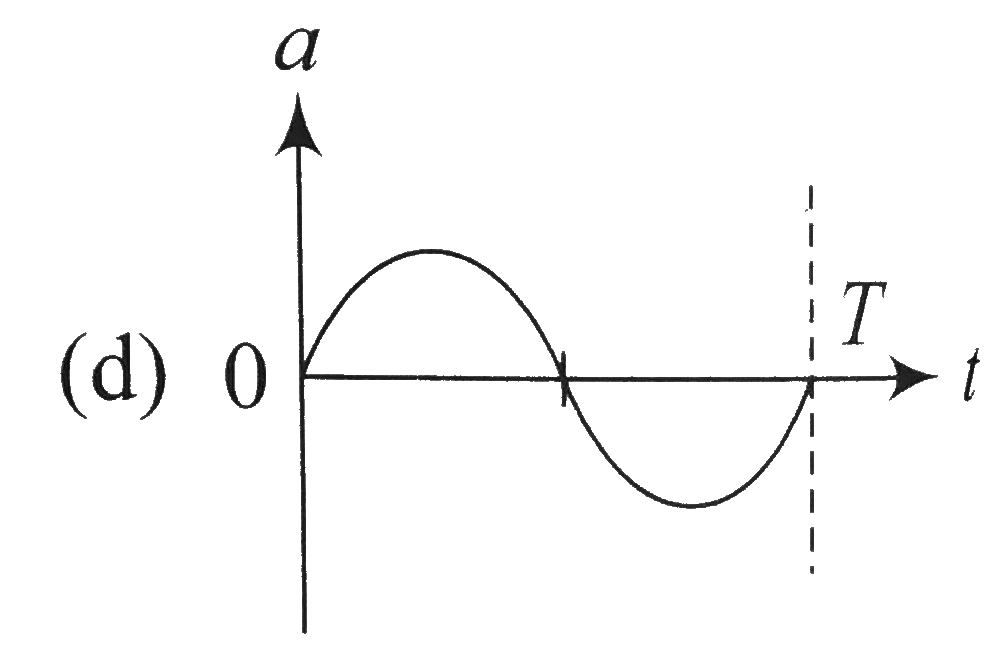
A simple harmonic motion is represented by
x(t)=sin2ωt−2cos2ωt. The angular frequency of oscillation is given byAωB2ωC4ωDω2
The displacement of a particle in S.H.M. is x=asinωt. Which of the following graph between displacement and time is correct :
View SolutionThe graph shown the variation with times t of the velocity v of an object . Which one of the following graphs best represents the variation of acceleration a of the object with time t?

View SolutionA simple pendulum of length φ oscillates with the time period T . Then which of the following graph correctly represents the relation ?
View SolutionA body is moving unidirectionally under the influence of a source of constant power supplying energy. Which of the diagrams shown in figure. Correctly shows the displacement-time curve for its motion ?
View SolutionEquations y=2Acos2ωtandy=A(sinωt+√3cosωt) represent the motion of two particles.
View Solution
