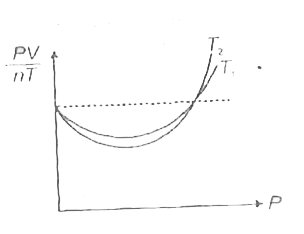
The figure below shows the plot of versus P for oxygen gas at two different temperatures
T_(1)gtT_(2)(pV)/(nT) at the point where the curves meet on the y-axis is the same for all gases Which of the above statements is true ?
A
(i) only
B
(i) and (ii) only
C
All of these
D
None of these
Text Solution
The correct Answer is:C
(i) The dotted line in the digram shows that there is no deviation in the value of for different temperature for increasing pressure so , this gas behaves ideally .Hence , dotted line corresponds to 'ideal ' gas behaviour.
(ii) At high temperature , the deviation of the gas is less and al low temperature the deviation of gas is more . In the graph, deviation for is greater than for . Thus ,
(iii) Since , the two curves intersect at dotted line so, the value of at that point on the the y-axis is same for all gases.
|
Topper's Solved these Questions
- KINETIC THEORY OF GASES ANDRADIATIONBOOK - MHTCET PREVIOUS YEAR PAPERS AND PRACTICE PAPERSCHAPTER - KINETIC THEORY OF GASES ANDRADIATIONEXERCISE - Exercise 2
50 Videos
- KINETIC THEORY OF GASES ANDRADIATIONBOOK - MHTCET PREVIOUS YEAR PAPERS AND PRACTICE PAPERSCHAPTER - KINETIC THEORY OF GASES ANDRADIATIONEXERCISE - MHT CET Corner
40 Videos
- KINETIC THEORY OF GASES ANDRADIATIONBOOK - MHTCET PREVIOUS YEAR PAPERS AND PRACTICE PAPERSCHAPTER - KINETIC THEORY OF GASES ANDRADIATIONEXERCISE - MHT CET Corner
40 Videos
- INTERFERENCE AND DIFFRACTION OF LIGHT BOOK - MHTCET PREVIOUS YEAR PAPERS AND PRACTICE PAPERSCHAPTER - INTERFERENCE AND DIFFRACTION OF LIGHT EXERCISE - MHT CET Corner
24 Videos
- MAGNETIC EFFECT OF ELECTRIC CURRENTBOOK - MHTCET PREVIOUS YEAR PAPERS AND PRACTICE PAPERSCHAPTER - MAGNETIC EFFECT OF ELECTRIC CURRENTEXERCISE - MHT CET CORNER
20 Videos
Similar Questions
Knowledge Check
The figure shows the plot of PVnT vs P, for oxygen gas at two different temperatures then
 AT1>T2BT2>T1CT1=T2Dmay be (1) & (2)
In the figure shown
(##AHT_PGT_PHY_C10_E01_006_Q01.png" width="80%">AP>P0BP<P0CP=P0DP=0In figure ,PR = ?
(##CEN_JEE_MAT_X_C14_E01_032_Q01.png" width="80%">A20 cmB22 cmC24 cmD26 cm
Does the graph below represent a function or a relation?
(##CEN_GRA_C01_S01_002_Q01.png" width="80%">
View SolutionThe IUPAC name of (##GRB_ORG_CHM_P1_C03_E03_046_Q01.png" width="80%">
View SolutionThe relative stablility of the compounds:
(GRB_ORG_CHM_P1_C07_E01_260_Q01.png" width="80%">
View SolutionThe value of angle r in figure below is
(##AAK_MCP_36_NEET_PHY_E36_017_Q01.png" width="80%">
View SolutionSTATEMENT-1:

##GRB_ORG_CHM_V02_QB_C03_E01_149_Q02.png" width="80%">
View Solution
